Published products

The EA trades with the trend. The direction of the trend is determined by the ZigZag indicator.
The Fibonacci grid is superimposed in the direction of the trend. At a given Fibonacci level, a limit order is placed in the direction of the trend.
The following levels are available for placing an order: 23.6 38.2 50.0 61.8 78.6 Stop loss is set to the Fibo level of 100 or specified by the user in the EA settings.
Take profit is set to Fibo level 0 or specified by the user in the
FREE

Trend Hunter is a trend indicator for trading Forex, precious metals, cryptocurrencies and CFDs. The indicator is designed to determine the current market direction, identify trend changes and find additional entry points within an already established market move. The indicator does not repaint and works with closed bars. Once a signal has been formed, it is not changed by minor price fluctuations within the following bar. Main features detection of uptrends and downtrends; trend change signals;

The EA trades with the trend. The direction of the trend is determined by the ZigZag indicator.
The Fibonacci grid is superimposed in the direction of the trend. At a given Fibonacci level, a limit order is placed in the direction of the trend.
The following levels are available for placing an order: 23.6 38.2 50.0 61.8 78.6 Stop loss is set to the Fibo level of 100 or specified by the user in the EA settings.
Take profit is set to Fibo level 0 or specified by the user in the EA settings. Ve
FREE

The indicator displays important technical levels on the chart. These levels act as support or resistance for the price movement.
The most important levels are multiples of 100 and 50 pips . You can also display levels in multiples of 25 pips .
When the price reaches the level, an alert or push notification is displayed. MT4 version https://www.mql5.com/en/market/product/69486 Settings Show Levels 100 pips - show levels that are multiples of 100 pips Show Levels 50 pips - show levels t
FREE

The behavior of different currency pairs is interconnected. The Visual Correlation indicator allows you to display various instruments on a single chart while maintaining their respective scales. You can identify positive correlation, negative correlation, or the absence of any correlation.
Some instruments begin their movement earlier than others; such instances can be identified by overlaying their charts.
The indicator supports the display of up to 5 symbols on a single chart, with each sy
FREE

News Robot 4.0
During the release of economic news, the price can overcome tens of points only in the first minute after the release. It is very risky to trade manually during high volatility , as it is difficult to quickly respond to rapidly changing quotes and actual data of a news release. To trade on the news, you need to draw up a scenario in advance , set the maximum risk .
Use a specialized professional robot to trade on news. News Robot implements your news trading strategy using both
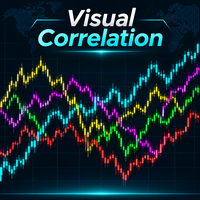
The behavior of different currency pairs is interconnected. The Visual Correlation indicator allows you to display various instruments on a single chart while maintaining their respective scales. You can identify positive correlation, negative correlation, or the absence of any correlation.
Some instruments begin their movement earlier than others; such instances can be identified by overlaying their charts.
The indicator supports the display of up to 5 symbols on a single chart, with each sy
FREE

The indicator displays important technical levels on the chart. These levels act as support or resistance for the price movement.
The most important levels are multiples of 100 and 50 pips. You can also display levels in multiples of 25 pips .
When the price reaches the level, an alert or push notification is displayed. MT5 version https://www.mql5.com/en/market/product/69740 Settings Show Levels 100 pips - show levels that are multiples of 100 pips Show Levels 50 pips - show levels that are
FREE

Trend Hunter is a trend-following indicator designed for trading Forex, CFDs, cryptocurrencies, and metals. It identifies long-term trends and locates trend-based entry points. Once a signal appears, it remains fixed and does not repaint. TakeProfit and StopLoss levels are calculated for each signal. Trades can be closed incrementally at multiple TakeProfit levels—multiples of the StopLoss size ( TP1 , TP2 , TP3 , TP5 , TP7 ). For ease of use, the indicator menu is located at the bottom of the c

The advantage of the Price Surfing indicator is the search algorithm for the extremes of the price of the instrument. Most indicator signals are located at local maximums and minimums of the price . For the convenience of the trader, the potential profit of each signal is displayed on the chart. The indicator does not repainting, the signal appears after the bar is closed. MT5 version https://www.mql5.com/en/market/product/47179 Parameters SendAlert - enable alert of a new signal SendEMail - e

The indicator detects divergences between price and the Moving Average Convergence Divergence (MACD) and Relative Strength Index (RSI) technical indicators.
The indicator's signals do not repaint; an entry signal appears after the bar with the arrow closes.
Divergence is defined as follows: If the price chart makes a new high, and the MACD or RSI value remains below the previous level, this is a bearish divergence. If the price chart drops to new lows, and the MACD or RSI value remain

The advantage of the Price Surfing indicator is the search algorithm for the extremes of the price of the instrument. Most indicator signals are located at local maximums and minimums of the price . For the convenience of the trader, the potential profit of each signal is displayed on the chart. The indicator does not repainting, the signal appears after the bar is closed. MT4 version https://www.mql5.com/en/market/product/46054 Parameters SendAlert - enable alert of a new signal SendEMail

The indicator detects divergences between price and the Moving Average Convergence Divergence (MACD) and Relative Strength Index (RSI) technical indicators.
The indicator's signals do not repaint; an entry signal appears after the bar with the arrow closes.
Divergence is defined as follows: If the price chart makes a new high, and the MACD or RSI value remains below the previous level, this is a bearish divergence. If the price chart drops to new lows, and the MACD or RSI value remains above