RBM Volume Profile Master

RBM VolumeProfileMaster

Professional Volume Profile Analysis for MetaTrader 5.

RBM VolumeProfileMaster was developed to analyze volume distribution across price levels, identify areas of trading concentration, and provide a clearer understanding of market acceptance and rejection zones.

A comprehensive analytical tool combining Volume Profile, market structure, and volume flow analysis in a single interface.

KEY FEATURES

  • Volume Profile: Displays traded volume distribution across individual price levels.
  • POC (Point of Control): Identifies the price level with the highest volume concentration.
  • VAH and VAL: Define the upper and lower boundaries of the Value Area.
  • HVN (High Volume Node): Identifies areas with high volume concentration.
  • LVN (Low Volume Node): Identifies areas with low volume concentration.
  • Naked POC: Highlights historical POCs that have not been reached by subsequent price ranges.
  • Delta: Displays an estimated buying and selling volume distribution at each price level.
  • Composite Volume Profile: Displays consolidated volume distribution over recent days or the visible chart area.
  • Dynamic Updates: Tracks changes in volume distribution during market activity.
  • Visual Customization: Adjustable colors, transparency, width, and calculation parameters.

HOW TO USE

The indicator helps traders identify:

  • Price levels with the highest trading volume concentration.
  • Market acceptance and balance areas.
  • Low participation zones and potential price displacement areas.
  • Important historical levels for price monitoring.
  • Potential support and resistance zones based on volume distribution.

MARKETS AND TIMEFRAMES

The indicator can be used with different financial instruments available on MetaTrader 5, including:

  • Forex
  • Gold (XAUUSD)
  • Indices, including NAS100
  • Commodities
  • Other instruments provided by your broker

The indicator uses M1 data to build its volume distribution, regardless of the chart timeframe selected.

RBM TRADER METHODOLOGY

RBM VolumeProfileMaster integrates volume analysis with the GFT methodology, helping traders identify relevant trading areas and better understand market structure.

Its purpose is not to predict market movements through automatic signals, but to provide analytical information for more informed trading decisions.

IMPORTANT INFORMATION

The indicator uses real volume when provided by the broker's server. Otherwise, tick volume is used.

Price-level distribution is estimated using M1 candle data. The buying and selling Delta classification is also estimated from the candle closing position within its price range. It does not represent actual aggressor-side identification from individual trades.

This indicator is an analytical tool and does not generate automatic buy or sell recommendations.

RBM TRADER

Geopolitics. Fundamentals. Technical Analysis.

Technology and intelligence applied to global market analysis.

Recommended products
This indicator automatically detects harmonic price patterns on your chart, both bullish and bearish, and shows them as soon as they form, including potential patterns that are still developing. For every pattern it draws the Potential Reversal Zone (PRZ), and for completed patterns it also draws two take-profit and two stop-loss levels. Supported Patterns: Gartley, Bat, Butterfly, Crab, Deep Crab, Shark and Cypher. Each pattern can be switched on or off individually. Key Features: Completed
FREE
AutoFibonacci draws Fibonacci retracement and extension levels automatically. It finds the significant swing high and low on the chart itself, so the levels appear without you drawing anything, and they update as new highs and lows form. Drawing Fibonacci by hand has a practical problem: you choose the swing. Two traders looking at the same chart pick different points and get different levels. This indicator removes that step. It works on any symbol and any timeframe. How the range is chosen Thr
FREE
Trading Session MT5
Kevin Schneider
3 (1)
Trading Session Indicator The Trading Session Indicator visualizes the high and low points as well as the start and end times of the Asian, London, and New York trading sessions directly on your chart. Features: Visualization of major trading sessions Highlighting of high and low points Display of start and end times for each session Customizable session times User-friendly and efficient Customizability: Each trading session (Asian, London, New York) can be individually customized to match speci
FREE
Value Chart Candlesticks
Flavio Javier Jarabeck
4.57 (14)
The idea of a Value Chart indicator was presented in the very good book I read back in 2020 , " Dynamic Trading Indicators: Winning with Value Charts and Price Action Profile ", from the authors Mark Helweg and David Stendahl. The idea is simple and the result is pure genius: Present candlestick Price analysis in a detrended way! HOW TO READ THIS INDICATOR Look for Overbought and Oversold levels. Of course, you will need to test the settings a lot to find the "correct" one for your approach. It
FREE
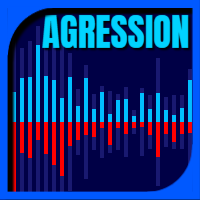
This is a buyer and seller aggression indicator that analyzes the shape of each candle and project this data in a histogram form. There are 4 histograms in one. On the front we have two: Upper - Buyer force. Lower - Seller force. At the background we also have two histogram, both with same color. They measure the combined strenght of buyers and sellers. This histograms can be turned off in Input Parameters. It is also possible to have the real or tick volume to help on this force measurement. IN
FREE
TradeDeck Lot Calculator
Joaquin Nicolas Metayer
LotCalc is a minimalist MT5 indicator designed for fast, precise position sizing. Set your risk amount in dollars, click the button, then click your entry and stop-loss levels directly on the chart — the lot size and point distance are calculated and displayed instantly. No clutter, no extra panels, just the one tool you actually need before placing a trade.
FREE
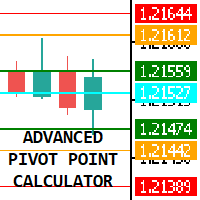
The Advanced Pivot Point Indicator is a powerful tool designed to help traders identify key support and resistance levels in the market. This versatile indicator offers a customizable and user-friendly interface, allowing traders to select from five different pivot point calculation methods: Floor, Woodie, Camarilla, Tom DeMark, and Fibonacci. With its easy-to-read lines for pivot points (PP), support (S1, S2, S3, S4), and resistance (R1, R2, R3, R4) levels, the Advanced Pivot Point Indicator pr
FREE
this free candle stick timer works on all symbol and all timeframe, in dicator help you to see remain time in hours, minutes, seonds until it close, it is simple and easy to use  and very light, it doesn't not consume much RAM, CPU. you can change font size and can change color of the indicator and what time frame you want it to work on, you also can choose to disable it on specifix time frame.
FREE
This indicator will show you the average entry price for positions, pending orders and both, every side and every type has an different color; It will also show you actual risk, pending risk, both sum and for both sides and the sum of both; you can configure Day, Week, Month and Year Financial Risk to show you if you are close to it; it shows the risk return of each side and both sides too, based on risk and profit for actual position and pending orders
FREE
Reversal Oscillator — Advanced Momentum Shift Detector Reversal Oscillator is a free indicator designed to highlight price zones that are statistically outside their normal movement patterns, helping traders anticipate potential turning points before they occur. Unlike traditional oscillators that react mainly to overbought/oversold conditions, this indicator applies third derivative analysis (the "acceleration of the acceleration" of price) calculated using two independent methods within a n
FREE
TimeFrameLow milliseconds
Israel Goncalves Moraes De Souza
O indicador mostra o preço ou volume em milissegundos, ótimo para identificar padrões de entrada por agressão de preço ou volume e escalpelamento rápido. Características Período de tempo do WPR em milissegundos Oscilador de agressão de preço Tela personalizável O indicador pode indicar movimentos de entrada, como: Cruzamento da linha 0.0 Identificando padrões de onda A velocidade de exibição do gráfico dependerá do seu hardware, quanto menores os milissegundos, mais serão necessários do hardwar
FREE
Trade Behavior Mirror reads your own account's closed trade history and counts one specific pattern: opening a new position shortly after a loss, at a lot size larger than your own recent normal. It does not predict, and it does not advise. Every number on the panel is something that already happened on this account. How the numbers are built: it reads up to 31 days of closed deals across every symbol and every magic number - this is an account-wide picture, not a chart-specific one. From the 3
FREE
Sierra Capital Session Sweep Scanner maps out the Asian, London, and New York trading sessions directly on your chart, then watches for a specific price-action pattern: a candle that spikes through the Asian session's high or low and closes back inside it — a classic liquidity sweep. What it shows: Colour-coded boxes marking the Asian, London, and NY session ranges, with the Asian high/low projected forward as reference lines Arrows marking each qualifying sweep-and-reject candle, with projected
FREE
Envolventes con alertas
Juan Manuel Rojas Perez
MT5 Enveloping Pattern Detector: Your competitive advantage in trading Are you looking for a tool to help you accurately identify the best trading opportunities in the forex market? Our Engulfing Pattern Detector provides you with a highly reliable buy or sell signal, based on one of the most recognized and effective Japanese candlestick patterns: the engulfing pattern. With an average success rate of 70%, this indicator will allow you to make safer and more profitable investment decisions. Don'
FREE
WH Price Wave Pattern MT5
Wissam Hussein
4.15 (13)
Welcome to our Price Wave Pattern MT5 --(ABCD Pattern)-- The ABCD pattern is a powerful and widely used trading pattern in the world of technical analysis. It is a harmonic price pattern that traders use to identify potential buy and sell opportunities in the market. With the ABCD pattern, traders can anticipate potential price movements and make informed decisions on when to enter and exit trades. Send me a  Message and Get A Free Gift : ABCD  Symbol Scanner Dashboard! EA Version:    Price W
FREE
Ict market structure signals
Botsalo Martin Letlhoagoje
5 (5)
SMC Signals  (BOS/CHoCH + ADR TP/SL Zones)  SMC Signals  is a free Smart Money Concepts (SMC) market structure indicator for MetaTrader 5 that automatically detects: BOS (Break of Structure) CHoCH (Change of Character) Swing High / Swing Low pivots Trade entry levels and projected targets The indicator also calculates ADR(10) (Average Daily Range) and automatically plots: Entry level Stop Loss (SL) Take Profit 1 (TP1) Take Profit 2 (TP2) A built-in dashboard displays live performance statistic
FREE
Cybertrade Keltner Channels
Emanuel Andriato
4.67 (6)
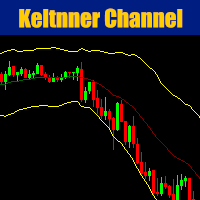
Cybertrade Keltner Channels - MT5 Created by Chester Keltner, this is a volatility indicator used by technical analysis. It is possible to follow the trend of financial asset prices and generate support and resistance patterns. In addition, envelopes are a way of tracking volatility in order to identify opportunities to buy and sell these assets. It works on periods longer than the period visible on the chart. All values ​​are available in the form of buffers to simplify possible automations.
FREE
Little useful tool - you manually select range on chart by dragging vertical blue lines and indicator shows support and resistance zones for this range and extends them outside of selected range.  Useful for: * Range trading * Range breakout * Range breakout & retest * Good entry during pullback in trend phase when previous high is retested * Good for scalping on short timeframes * Good for trades on longer timeframes around selected important zones like daily high or low
FREE
PZ Fibonacci MT5
PZ TRADING SLU
4.57 (14)
Are you tired of plotting Fibonacci retracements or extensions manually? This indicator displays Fibo retracements or extensions automatically, calculated from two different price points, without human intervention or manual object anchoring. [ Installation Guide | Update Guide | Troubleshooting | FAQ | All Products  | Get Help ] Easy to use Manual anchoring is not needed Perfect for price confluence studies The indicator evaluates if retracements or extensions are needed Once drawn, you can m
FREE
Key Liquidity Levels and Confirmation shows where liquidity is resting on the chart and marks the moment it is taken. It combines three steps of one trading idea in a single tool: the key level, the sweep of that level, and the confirmation that follows. KEY LEVELS - Asia, London and New York session highs and lows - Previous day high and low (PDH / PDL) - Previous week high and low (PWH / PWL) - Previous month high and low - All-time high and all-time low Levels that share the same price are
FREE
Top Down CandleCast
Opeyemi Fuad Anokwu
Project the Bigger Picture, Trade Every Timeframe with Higher-Timeframe Confidence and Execute with Precision!   Professional traders understand that every quality trade begins with top-down analysis. However, traditional workflows require constant switching between multiple charts and timeframes, interrupting concentration and increasing the likelihood of missing important higher-timeframe information. This repetitive process slows analysis, disrupts execution, and makes it harder to maintain
FREE
IBI Footprint
Brahim Eljaziri
IBI Footprint draws a professional footprint chart from the real trades of the exchange : for every candle and every price level you see how many contracts were sold and how many were bought . What you see Top of each column: candle volume (V) and delta (Δ = buys − sells). Each price row: sells | buys. Warmer cells = more volume. Diagonal imbalances highlighted (buyer in blue, seller in red). POC (price with the most volume) framed in gold. Click the panel to shrink it to a thin bar and see your
FREE
Gold Max pro
Israr Hussain Shah
4 (1)
Here   our more valuable tools SMC Trend Trading   ,  Easy SMC Trading  ,  Institutional SMC Architect Volume Analysis Tools  ,  Volume flow Profile  ,  Market volume profile  , FVG with Volume  , Liquidity Heatmap Profile  ,  Volume Spread Analysis Automatic Professional Theme:   Instantly applies a high-contrast "Color on White" theme with DeepSkyBlue bull candles and Black bear candles for maximum clarity. Interactive Timeframe Panel:   21 vertical buttons on the left side allow for one-clic
FREE
FREE — automatic support and resistance levels: previous-day high/low, previous-week high/low and round-number levels, drawn and kept up to date for you. 100% free, no limitations. If it earns a place on your charts, a short review is the one thing that helps us most — it takes 30 seconds and it is what lets other traders find this tool. Platform: MetaTrader 5 only — there is no MetaTrader 4 edition. These are the levels most intraday traders mark by hand every morning. This indicator draws t
FREE
High Low Open Close
Alexandre Borela
4.98 (46)
If you like this project, leave a 5 star review. This indicator draws the open, high, low and closing prices for the specified period and it can be adjusted for a specific timezone. These are important levels looked by many institutional and professional traders and can be useful for you to know the places where they might be more active. The available periods are: Previous Day. Previous Week. Previous Month. Previous Quarter. Previous year. Or: Current Day. Current Week. Current Month. Current
FREE
VolumeBasedColorsBars
Henrique Magalhaes Lopes
VolumeBasedColorsBars — Free Powerful Volume Analysis for All Traders Unlock the hidden story behind every price bar! VolumeBasedColorsBars is a professional-grade, 100% FREE indicator that colorizes your chart candles based on real, adaptive volume analysis. Instantly spot surges in market activity, identify exhaustion, and catch the moves that matter. This indicator gives you:    • Dynamic color-coded bars for instant volume context    • Adaptive thresholds based on historical, session-awar
FREE
Volume Profile FREE — Multi-Session Heatmap (POC · VAH · VAL) See where trading activity actually occurs—not just where price moves. This indicator builds a clear, color-coded Volume Profile Heatmap directly on your chart and highlights the market's most important price levels: the Point of Control (POC) and the Value Area (VAH/VAL) , where price is most likely to react.
FREE
TrendVision AI
Murtadha Majid Jeyad Al-Khuzaie
TrendVision AI – Smart Trend Channels & Price Forecasting for MetaTrader 5 Discover market structure and explore potential future price direction with TrendVision AI, an advanced technical indicator for MetaTrader 5 that combines automatic trendline analysis with a machine-learning-based price forecasting model. How Does TrendVision AI Work? TrendVision AI analyzes historical candlestick data within a configurable lookback window. It automatically draws two trendlines directly on the chart:
FREE
RSI Advanced Indicator for MetaTrader 5 While the Relative Strength Index (RSI) is a staple in technical analysis, the standard version often lacks the precision and flexibility required by modern traders. The RSI Advanced Indicator for MetaTrader 5 transforms this classic oscillator into a powerful, institutional-grade analysis and alert tool. Designed to eliminate chart clutter and screen-watching, this indicator provides a pristine visualization of the RSI, coupled with a highly granular,
FREE
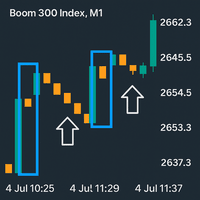
boom Spike Mitigation Zone Pro A professional spike pattern indicator built for synthetic traders who scalp and swing Boom 500/300/1000/600/900with precision.  This indicator: Detects powerful 3-candle spike formations (Spike → Pullback → Spike) Automatically draws a clean box around the pattern Marks the entry price from the middle candle Extends a horizontal mitigation line to guide perfect sniper entries Automatically deletes & redraws the line once price touches it (mitiga
FREE
Buyers of this product also purchase
Trend Sniper X
Sarvarbek Abduvoxobov
4.86 (44)
Trend Sniper X is a multi-timeframe trend-following indicator for MetaTrader 5 that helps traders identify trend direction and potential reversal points with clarity and precision. for MT4: https://www.mql5.com/en/market/product/193245 Price Information: The current price is promotional and is subject to change as upcoming updates and new features are released. Bonus Offer: To get the FREE Auto-Trade Assistant EA for this indicator, please message the author after purchasing. Code2Profit Channe
A new King in town - Indicator + Order management indications(tp1+tp2+tp3) + Optional Telegram Signal sender   INCLUDED (FREE) + Bonus EA Robot ( FULL TRADING  and SIGNAL SYSTEM ) Our best EA for Gold: Gold Slayer TRY > Reversion Queen  Expert advisor >JOIN Community Channel < NEW Free Automation EA link < click here ( disclaimer: this is new and still on testing and phase , use at your risk on demo) Free Telegram Bridge < click here  This indicator includes an advanced Strategy, a trading sys
Smart Trend Trading System — MetaTrader 5 Message me on MQL5 after purchase to receive Smart Universal Expert Advisor for FREE, plus the online course, PDF manual, and private group access. STTS brings trend direction, entry and exit signals, reversal zones, and important price levels together on your chart. Follow the system manually, or connect a separate compatible EA for automated execution using your chosen settings. ONE SYSTEM. FOUR TRADING APPROACHES. STTS organizes its trading approaches
Zoryk Gold
Reda El Koutbane
4.78 (18)
discount ends SOON next price 69 $ ZORYK — Advanced XAUUSD Signal System for MetaTrader 5 You know the feeling. You spend time analyzing gold. You wait for the entry. You finally open the trade, and price immediately moves against you. You close too early, move the Stop Loss or hesitate for a few seconds. Then the market reaches the exact destination you originally expected without you. The direction was not always the problem. The real problem was uncertainty. You did not know exactly where th
Entry Points Pro shows you where to enter, where to put the stop and what lot to trade — before you place the order. PRICE Now 149 USD, and this is the last copy at this price. After it the price goes up to 199 USD, and the final price is 349 USD. I make my money trading the markets, and I show it, so I don't need to sell this indicator to everyone. It is a tool for traders who think for themselves, not a magic button. The arrow appears when the candle closes and does not repaint. Two setting
M5 Sniper
MeanFX
5 (4)
Get your trading edge in the line of sight M5 Sniper   is a new indicator by MeanFX. It combines   precise trading signals   with   adaptive TP/SL levels   - creating best possible statistical trades as a result! The price increases every 5 purchases, the next price is 79$ Message me after purchase to receive tips/guide and bonus EA plus trading methodology Auto Optimisation only works on LIVE chart , needs data feed >JOIN Community Channel < What makes it stand out?   Proven statistical per
SuperScalp Pro
Van Minh Nguyen
4.54 (37)
SuperScalp Pro - Professional Multi-Layer Confluence Scalping System SuperScalp Pro is an advanced scalping indicator that upgrades the classic Supertrend with multiple intelligent confirmation filters. It helps you identify higher-probability Buy/Sell opportunities while significantly reducing false signals. Clear Buy and Sell arrows appear directly on the chart, along with automatic ATR-based Stop Loss and Take Profit levels calculated in real time. After purchase, please message me on MQL5 to
Gold Trend Coach MT5
Cristhian Alexander Gaibor Cuasquer
4.2 (10)
Gold Trend Coach is a gold (XAUUSD) trend indicator for MetaTrader 5 with buy and sell signals, stop loss and three take profit targets confirmed on candle close (no repaint), a coach that guides you from the entry to TP3, a multi-timeframe dashboard and alerts to your phone and Telegram. Built for M1 and M5 scalping and M15 intraday during the London and New York sessions. BONUS: FREE Auto-Trade EA for Gold Trend Coach. Message me after purchase and I send you the EA that trades the indicator s
GoldenX Entry MT5
VividMind Digital Solutions
5 (17)
Price will increase by $20 every 10 buyers to maintain premium value. After purchase, contact via   MQL5 inbox   to receive your buyer kit and bonus. You have probably tested dozens of indicators before. But we are not here to be “just another signals indicator.” Behind GoldenX Entry is intensive research & development focused on building sophisticated algorithms designed to adapt to the real behavior of every instrument — not generic signals recycled everywhere else. From advanced Auto Optim
SMC Intraday Formula
VividMind Digital Solutions
5 (26)
Secure the Lowest Price Today. After purchase, contact via   MQL5 inbox   to receive your buyer kit and bonus. Let's be honest first. No indicator will make you profitable on its own. If someone tells you otherwise, they're selling you a dream. Every indicator that shows perfect buy/sell arrows can be made to look flawless — just zoom into the right window of history and screenshot the winners. We won't do that. SMC Intraday Formula is a tool. It reads the market structure for you, maps the hig
Gann Made Easy   is a professional and easy to use Forex trading system which is based on the best principles of trading using the theory of W.D. Gann. The indicator provides accurate BUY and SELL signals including Stop Loss and Take Profit levels. You can trade even on the go using PUSH notifications. PLEASE CONTACT ME AFTER PURCHASE TO GET TRADING  INSTRUCTIONS   AND GREAT EXTRA INDICATORS  FOR FREE! Probably you already heard about the Gann trading methods before. Usually the Gann theory is a
Ultra Indicator
Ihor Otkydach
5 (1)
ULTRA is a technical indicator that operates on an “all-in-one” basis—it independently analyzes the market, generates trading signals, displays levels for setting stop-loss orders, and suggests when to close trades to lock in profits or minimize losses. In other words, it doesn't matter if you don't know how to analyze the market, determine levels—where to set your stop-loss—or struggle with money management. ULTRA will do all of that for you! BUYER BONUS: After purchasing the ULTRA indicator, s
Boba Analysis Suite
Trade Ready Solutions LLC
5 (2)
Boba Analysis Suite Boba Analysis Suite is an analytical indicator for MetaTrader 5. It brings market structure, relevant price zones and broader market context together in a single chart view. Developed through practical experience as a trader and trading coach, it supports a structured analysis process: assessing market direction, identifying important levels and considering multiple timeframes together. Analysis in Context Individual signals gain meaning through context. Boba Analysis Suite h
Welcome to Entry In The Zone & SMC Multi Timeframe —  COMPLETE SMC ANALYSIS SYSTEM — ALL IN ONE INDICATOR Entry In The Zone & SMC Multi Timeframe  An indicator designed for market analysis based on Smart Money Concepts (SMC), displaying Market Structure, Key Zones (Order Blocks, Supply & Demand Zones, and Fair Value Gaps), Liquidity, and real-time BUY / SELL signals. It supports both Single-Timeframe and Multi-Timeframe analysis, along with the Confluence at Zone feature, which helps you evaluat
M1 Sniper MT5
Oleg Rodin
5 (7)
M1 SNIPER  is an easy to use trading indicator system. It is an arrow indicator which is designed for M1 time frame. The indicator can be used as a standalone system for scalping on M1 time frame and it can be used as a part of your existing trading system. Though this trading system was designed specifically for short-term trading, it still can be helpful for all traders. This trading system can be used with any forex pair and time frame, though lower time frames are recommended from M1 up to M
Gold Entry Sniper
Tahir Mehmood
5 (22)
Gold Entry Sniper – Professional Multi-Timeframe ATR Dashboard for Gold Scalping & Swing Trading Gold Entry Sniper is a cutting-edge MetaTrader 5 indicator designed to give traders precise buy/sell signals for XAUUSD and other symbols, powered by ATR Trailing Stop logic and a multi-timeframe analysis dashboard . Built for both scalpers and swing traders, it combines real-time market direction , dynamic stop levels , and professional visual dashboards to help you identify high-probability gold en
FiboSniper Pro
Van Minh Nguyen
5 (4)
FiboSniper Pro - Multi-Filter Fibonacci System with Auto SL/TP and Control Panel FiboSniper Pro is a technical indicator that combines dynamic Fibonacci Envelopes with multiple confirmation filters to generate selective Buy and Sell signals. Fibonacci levels are calculated from Moving Average and ATR, then filtered by ADX, EMA, RSI, ATR, Volume, Time and Candle structure. The indicator displays automatic ATR-based Stop Loss and Take Profit levels directly on the chart, along with an interactive
ARICoins
Temirlan Kdyrkhan
ARICoin is a powerful trading companion designed to generate high-probability entry signals with dynamic TP/SL/DP levels based on volatility. Built-in performance tracking shows win/loss stats, PP1/PP2 hits, and success rates all updated live. Key Features: Buy/Sell signals with adaptive volatility bands Real-time TP/SL/DP levels based on ATR Built-in MA Filter with optional ATR/StdDev volatility Performance stats panel (Success, Profit/Loss, PP1/PP2) Alerts via popup, sound, push, or email Cust
ScalpPoint
Temirlan Kdyrkhan
ScalpPoint is a powerful trading companion designed to generate high-probability entry signals with dynamic TP/SL/DP levels based on volatility. Built-in performance tracking shows win/loss stats, PP1/PP2 hits, and success rates — all updated live. Key Features: Buy/Sell signals with adaptive volatility bands Real-time TP/SL/DP levels based on ATR Built-in MA Filter with optional ATR/StdDev volatility Performance stats panel (Success, Profit/Loss, PP1/PP2) Alerts via popup, sound, push, or emai
Auto Optimized SpeedAngle is an institutional-grade momentum vectoring system that eliminates curve-fitting through continuous Walk-Forward Optimization (WFO). Rather than relying on static inputs that degrade when market regimes shift, the indicator dynamically recalibrates its parameters using Out-of-Sample (OOS) validation, ensuring the displayed signals represent genuine statistical edges rather than historical anomalies. By shifting the focus from subjective visual angles to normalized, qua
Adaptive Price Action Engine Buy Indicator- Get EA Based on it for FREE. Self-Optimizing Multi-Timeframe Trend & Candlestick Intelligence Markets do not behave the same way all the time—and not every price-action pattern has the same value in every market regime. Adaptive Price Action Engine is designed to adapt to changing market conditions by combining trend structure, multi-timeframe analysis, candlestick patterns, and statistical optimization into one analytical framework. Two Adaptive Mode
Crystal Heikin Ashi Signals
Muhammad Jawad Shabir
5 (5)
Crystal Heikin Ashi Signals—Professional Trend & Signal Detection Indicator Advanced Heikin Ashi Visualization with Intelligent Signal System for Manual & Automated Trading Final Price: $149 ---------> Price goes up $10 after every 10 sales . Limited slots available — act fast . Overview User Guide PDF Crystal Heikin Ashi Signals is a professional-grade MetaTrader 5 indicator that combines pure Heikin Ashi candle visualization with an advanced momentum-shift detection system. Designed for both m
Scalper Vault is a powerful, fully-equipped trading system designed for traders who want to achieve consistency in intraday trading . This high-precision indicator serves as a complete, standalone trading system that delivers institutional-grade analysis for both Forex and Binary Options traders. PLEASE CONTACT ME AFTER PURCHASE TO GET MY TRADING TIPS PLUS A GREAT BONUS! By eliminating the guesswork and complex manual analysis, Scalper Vault allows you to focus purely on execution using easy to
Trend Catcher ind mt5
Ramil Minniakhmetov
5 (18)
TREND CATCHER INDICATOR Trend Catcher Indicator analyzes market price movements, using a combination of the author’s proprietary and customized adaptive trend-analysis indicators.  It identifies the true market direction by filtering out short-term noise and focusing on underlying momentum strength, volatility expansion, and price structure behavior.  It also uses a combination of smoothing and trend-filtering customized indicators such as moving averages, RSI, and volatility filters.   Real ope
Tokyo mt5 Indicator
Vasiliy Strukov
5 (15)
Tokyo Indicator provides a clear visual overview of trend direction, potential trading signals, and market conditions. Its colour-coded, stepped trend line distinguishes bullish phases in blue from bearish phases in magenta. Matching directional arrows highlight potential buying and selling opportunities when the displayed trend changes. An integrated dashboard brings together the current signal, market bias, momentum, volatility, and signal quality in one convenient view. This allows traders t
Atomic Analyst MT5
Issam Kassas
4.5 (64)
Atomic Analyst — MetaTrader 5 Message me on MQL5 after purchase to receive Smart Universal Expert Advisor for FREE, plus the online course, PDF manual, and private group access. Atomic Analyst brings price action, trend direction, entry and exit signals, Stop Loss and multiple Take Profit levels together on your chart. SEE THE SIGNAL. UNDERSTAND THE SETUP. Atomic Analyst organizes its analysis into clear visual information: • Buy and sell arrows to identify potential entries. • Stop Loss and mul
Unix Scalper
Issam Kassas
4 (4)
Unix Scalper — MetaTrader 5 Message me on MQL5 after purchase to receive Smart Universal Expert Advisor for FREE, plus the online course, PDF manual, and private group access. Find the setup. See the plan. Choose how to trade it. UNIX Scalper brings market analysis, BUY/SELL/WAIT decisions and Entry, Stop Loss, TP1 and TP2 levels into one organized panel. SEE THE SIGNAL AND THE PLAN • Clear decisions: BUY, SELL or WAIT. • Defined levels: Entry, Stop Loss, TP1 and TP2. • Multi-timeframe overvie
SIO Oscillator: Self-Optimizing Semivariance Imbalance Oscillator Buy the indicator and get the Expert Advisor based on it for FREE. Most oscillators treat all price movement the same. SIO separates upside and downside market pressure and measures the imbalance between them, showing which side is really in control: buyers or sellers. When the imbalance reaches an extreme, SIO prints a clear signal with entry, Stop Loss and Take Profit levels. What makes SIO different is that it doesn’t rely on f
Volatility Master for MetaTrader is a real-time dashboard tool that scans up to  50 symbols  to identify high-volatility , trending markets instantly. With bullish/bearish signals, customizable alerts, and a user-friendly interface, it helps you avoid range-bound conditions and focus on high-probability trades. Clarity leads to confidence. Trade confidently and protect your capital effectively with this powerful dashboard. We don't offer free or bonus indicators in exchange of reviews from you.
Smc Pro ToolKit
Talal N Z Aljarusha
5 (14)
SMC PRO TOOLKIT — SMART MONEY ANALYSIS & STRUCTURED TRADE PLANNING SMC Pro ToolKit is a professional Smart Money Concepts analysis workspace for MetaTrader 5. It combines market structure, multi-timeframe analysis, institutional price zones, setup evaluation, confirmation tools, volume context, alerts, and risk planning inside one organized chart environment. One workspace. Multiple layers of confirmation. One structured trading plan. OPEN COMPLETE USER GUIDE MULTI-CONDITION SETUP ENGINE At
More from author
RBM Flow Footprint
Renato Brendim Medici
RBM Flow Footprint Read what happens inside every candle. RBM Flow Footprint shows, at each price level, how much was traded by buyers and sellers, right on your MetaTrader 5 chart, in a clean, dark, professional design. Instead of deciding only by candle body and wick, you see where the market really fought, where one side took control, and where price moved through without finding interest. What you see on the chart Bid x Ask footprint: each candle becomes a column. The left half shows selling
FREE
RBM Quick Entry Panel
Renato Brendim Medici
RBM Quick Entry Panel PRO SHORT DESCRIPTION One-click on-chart entry panel: lot size, stop loss, take profit, up to 3 partial exits and automatic breakeven. FULL DESCRIPTION Anyone who trades every day knows the hard part is rarely the analysis. It's the execution. Opening the order window, typing the lot, working out the stop, remembering to take partials, moving to breakeven at the right moment. In a fast market every one of those steps costs seconds and leaves room for mistakes. RBM Quick Ent
FREE
RBM Gold Liquidity Hunter
Renato Brendim Medici
5 (1)
Gold doesn’t forgive a bad entry. It sweeps stops, tricks anyone reading the candle at face value, and reverses right when everyone’s convinced the trend is set. RBM Gold Liquidity Hunter shows you exactly where those traps happen, before you walk into one. The indicator maps yesterday’s high and low automatically and draws the Asian session range live on your chart, that window that usually decides where the day is headed once London and New York show up. When price breaks one of those levels
FREE
RBM Flow Structure PRO
Renato Brendim Medici
RBM Flow Structure PRO Advanced Capital Flow and Market Structure Analysis for MetaTrader 5 Five integrated modules. One tool. A more complete market view. RBM Flow Structure PRO is a multifunctional indicator designed for traders who want to gain a deeper understanding of market behavior. It combines capital flow analysis, price structure, supply and demand zones, and key trading levels on a single chart. With five independent and configurable modules, the indicator helps organize your analysis
FREE
RBM Delta Gold
Renato Brendim Medici
5 (1)
Gold does not move only because of price. It moves because of aggression, imbalance, and market flow. The Delta Indicator was created to reveal exactly that. The RBM Trader Delta Indicator for XAUUSD identifies the difference between aggressive buyers and sellers, helping traders detect real market pressure before the movement becomes obvious on the chart. While most traders focus only on candles, Delta shows what is happening behind price action. This indicator was specially developed for
FREE
SMC Intraday
Renato Brendim Medici
SMC INTRADAY RBM Quick User Manual Smart Money Concepts | MetaTrader 5 1. Installation Open MetaTrader 5. Go to File → Open Data Folder. Navigate to MQL5 → Indicators and copy the indicator file into this folder. Open MetaEditor, compile the file, and return to MetaTrader 5. Refresh the Navigator, locate SMC Intraday RBM, and drag it onto the desired chart. 2. How to Interpret the Indicator BOS — Break of Structure: A break of a previous market structure that may indicate continuation of the cur
FREE
RBM Smc
Renato Brendim Medici
RBM SMC Liquidity Hunter MT5 — Institutional Structure and Liquidity Indicator   The RBM SMC Liquidity Hunter is a professional tool developed to map Smart Money Concepts (SMC) dynamics directly on your charts. The indicator tracks market structure breaks, validates supply and demand zones using price displacement, and detects liquidity sweeps confirmed by volume, integrating all confluences into an executive on-chart dashboard.   Key Features  Market Structure Mapping (BOS / CHoCH): Automatic
FREE
RBM OB Dashboard
Renato Brendim Medici
RBM OB Dashboard Short Description Market structure indicator featuring BOS, ChoCH, Pending Breaks, scored Order Blocks, FVG, liquidity sweeps, sessions, Volume Profile, and a draggable dashboard. Full Description The RBM OB Dashboard reads market structure and key price reaction zones directly on the chart. It combines BOS, ChoCH, Order Blocks, Fair Value Gaps (FVG), liquidity, sessions, Kill Zones, Volume Profile, and a compact dashboard for rapid analysis. Built for traders who rely on market
FREE
RBM Zoomscroll
Renato Brendim Medici
RBM Zoom Scroll Every trader knows the feeling. You are on the gold M5, you want to see how the whole day built up, and you start clicking zoom buttons or dragging the price scale around. By the time you are done, the move you wanted to look at is already gone. RBM Zoom Scroll fixes this the way it should have worked from day one: you spin the mouse wheel over the chart and the chart zooms. No buttons, no menus, no dragging. How it works Scroll: zooms the chart in and out horizontally, which mea
FREE
RBM Trader Painel
Renato Brendim Medici
RBM Trade Panel - Automatic Lot Calculator and Order Management Fast execution panel for MetaTrader 5 featuring automatic dollar-based risk calculation, chart-based partial exits, one-click breakeven, and complete order management. Full Description Doing manual math or switching to external position calculators while price moves rapidly usually leads to missed entries or oversized positions. The RBM Trade Panel fixes this directly on your MetaTrader 5 chart by handling all risk calculations a
FREE
RBM Volume Real 2
Renato Brendim Medici
5 (2)
O RBM Volume Real foi desenvolvido para transformar volume em informação útil para tomada de decisão. Em vez de observar apenas a movimentação do preço, o indicador permite identificar quem está dominando o mercado em determinado momento: compradores ou vendedores. O primeiro dado apresentado é o volume de Compras, que representa a agressão dos participantes que aceitaram pagar o preço pedido para entrar no mercado. Já o volume de Vendas mostra a agressão daqueles que aceitaram vender ao preço
FREE
RBM Watermarkgrid
Renato Brendim Medici
RBM Watermark Grid - MQL5 Market Description RBM Watermark Grid A transparent symbol watermark plus a clean, wide-spaced grid for your MetaTrader 5 charts. Overview RBM Watermark Grid gives your chart a cleaner, more professional look. It shows the symbol name (and optionally the symbol description and timeframe) as a subtle watermark in the center of the chart, and replaces the default MT5 grid with a softer, more open grid that has fewer lines and does not clutter your candles. Key features Sy
FREE
RBM Prior Cote
Renato Brendim Medici
The previous day's open, close, high and low are among the levels the market respects most. Gold, Nasdaq, forex, indices: price comes back to these points, tests them, rejects them or breaks through. RBM Prior Cote draws them for you automatically, so you stop marking lines by hand every morning. What it does • Plots the open, close, high and low of the previous daily candle • Shows the last several days of history (you choose how many), so you can see where price actually reacted • Adds a la
FREE
RBM Volume Ultimate
Renato Brendim Medici
RBM Volume Ultimate RBM Volume Ultimate is an indicator for MetaTrader 5 that combines buyer and seller financial volume, cumulative delta, daily VWAP and automatic detection of absorption and exhaustion in a single panel. The purpose of the indicator is to give traders a clearer view of buying and selling flow in real time. The histogram separates financial volume between buyers and sellers on a bar by bar basis, making it easier to identify moments when pressure shifts from one side of the ma
FREE
RBM Nasdaq Liquidity Hunter Institutional Liquidity Indicator for Nasdaq RBM Nasdaq Liquidity Hunter is an advanced liquidity analysis tool developed for Nasdaq traders who want to identify institutional liquidity events with greater precision. Instead of highlighting every breakout, the indicator filters market noise and identifies only liquidity sweeps confirmed by volume, trend, and multiple institutional confluence factors. Every detected event is evaluated through a proprietary scoring
FREE
RBM Volume Real Pro
Renato Brendim Medici
RBM Volume Real PRO 3.0 RBM Volume Real PRO 3.0 was developed to transform volume data into actionable market intelligence. While most traders focus exclusively on price movement, this indicator allows users to identify the participants truly driving the market by revealing the balance of power between buyers and sellers in real time. The first component is Buy Volume, which represents the aggression of participants willing to execute orders at the asking price. Conversely, Sell Volume measur
FREE
RBM PivotZones
Renato Brendim Medici
RBM Pivot Zones automatically detects pivot highs and lows directly on the chart, marking each level with a horizontal line and a subtle visual zone. The logic is straightforward: the indicator scans price history looking for structural tops and bottoms, the areas where price arrived, rejected, and reversed. Pivot highs in blue, pivot lows in red. Clean chart, no clutter. The indicator adjusts to any timeframe automatically. It works the same way on M5, H1, or D1 without reconfiguration. Sensiti
FREE
RBM Atr Pro
Renato Brendim Medici
RBM ATR PRO v1.10 Quem opera mercado volátil sabe como é ruim tomar stop por causa de uma violinada de pavio e ver o preço andar forte a favor logo depois. O RBM ATR PRO foi desenvolvido exatamente para resolver isso. Ele evolui o indicador clássico de volatilidade combinando a leitura do ATR com dois níveis independentes de suavização. A linha no gráfico fica limpa e objetiva: verde para estrutura de alta e vermelha quando o mercado vira para a baixa. Funciona perfeitamente para rastrear a ten
FREE
RBM Stop and Take Label
Renato Brendim Medici
5 (1)
Here is the English version of the product description, tailored to sound clear, professional, and engaging for the MQL5 Market: RBM SL TP Label — Indicator for MetaTrader 5 If you trade Forex and miss seeing the exact financial value of your risk and target directly on your chart, this indicator solves that in a clean, direct, and intuitive way. What It Does As soon as you open a position, the indicator automatically detects your Stop Loss and Take Profit lines and displays, in real-time, both
FREE
RBM Calendario Pro
Renato Brendim Medici
RBM | CALENDAR PRO MACROECONOMIC INTELLIGENCE DIRECTLY INSIDE METATRADER 5 Developed by RBM.TRADER RBM | CALENDAR PRO is an advanced economic calendar dashboard designed for traders who want to monitor major global macroeconomic events directly inside MetaTrader 5. More than just an economic agenda, this tool organizes essential economic information, allowing you to track upcoming releases, compare market expectations and identify economic surprises that may influence financial markets. KEY FEAT
FREE
RBM EA Pro Gold
Renato Brendim Medici
RBM EA PRO — the most complete Expert Advisor you’ll find for XAUUSD Gold doesn’t behave like any other asset. It reacts to US interest rates, dollar strength, breaking news, and it loves to sweep stops before making its real move. RBM EA PRO was built specifically to handle that complexity, with no shortcuts and no impulsive entries. How it decides to enter This isn’t a robot that buys or sells at random. RBM EA PRO only considers an entry when multiple layers of analysis agree with each ot
RBM EA Deluxe
Renato Brendim Medici
An XAUUSD-focused robot that only enters when several market conditions line up at once: trend, volume, price structure and session. It shows you exactly what it’s analyzing on the chart, and why it decided to trade or wait. Most gold robots you’ll find out there run on something simple: a moving average cross, or a channel breakout, and that’s it. The problem is gold doesn’t trade that way. It sweeps liquidity, traps early entries, and usually only moves for real after shaking everyone out fir
RBM QuickEntryPanel PRO
Renato Brendim Medici
RBM QUICK ENTRY PRO PANEL LEGEND Trade execution, risk management and operational control for MetaTrader 5 PRODUCT OVERVIEW The RBM Quick Entry PRO | Panel Legend is a professional trade execution and position management panel developed for MetaTrader 5. It combines order entry, risk control, position management and performance monitoring in a compact interface integrated into the chart. MAIN FEATURES 01 | TRADE EXECUTION Market orders: BUY and SELL. Pending orders: BUY LIMIT and SELL LIMIT. St
RBM Heatmap Pro
Renato Brendim Medici
RBM Heatmap PRO 2.08 Visualize market strength across multiple asset classes in a single dashboard. RBM Heatmap PRO is an indicator developed for MetaTrader 5 that brings multiple asset classes together in a visual dashboard, allowing traders to monitor percentage changes, prices, and relative market movements in a clear and organized way. Featuring a professional interface, dynamic asset management, and bilingual support, the indicator is designed for traders who need to monitor different marke
Filter:
No reviews
Reply to review