Astral Wave Riding
- Indicators
-
Ottaviano De Cicco
 There’s more to your chart than meets the eye.
Merkava Labs develops quantitative trading tools
that bring market behaviour into focus.
Built on research. Refined through validation.
Complementary perspectives for the way you trade.
Explore our tools: merkavalabs.com - Version: 1.10
Astral Wave Riding
Follow the trend. Understand the signals.
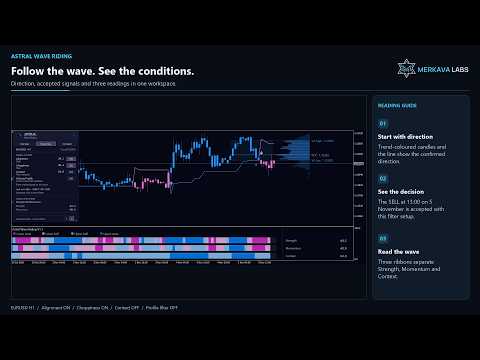
A trend change and a pullback within that trend answer different questions. Astral Wave Riding brings direction, signal selection and price context into one workspace for discretionary traders who follow market trends.
- Separate turns from pullbacks. Distinguish accepted trend-change arrows from round Signals in Trend markers.
- Understand the conditions. Review enabled filters and the decision for the last trend change beside the current readings.
- Keep the picture together. Compare Strength, Momentum and Context, with an optional previous-session volume profile alongside price.
Use Wave Riding to review direction, pullback conditions and reference levels together, with the signal sources and filters you choose.
Read direction and signals separately
The ATR-based trend line follows confirmed direction. Large arrows mark trend changes accepted by the enabled filters. Round dots mark Signals in Trend: optional pullback-zone events from Strength, Momentum, either source or both crossing on the same candle.
Coincident sources produce one dot, and an accepted trend-change arrow takes priority on that candle. A turn in the line can occur without an arrow when its signal is rejected. A later filter Pass does not turn that rejection into a delayed entry.
Signals use closed candles and normally become available when the next candle opens, once required data is ready. Arrows and dots are drawn on their signal candles; the current trend-line endpoint holds the latest confirmed value.
Strength, Momentum and Context
Wave View brings three readings into one resizable subwindow on a common 0–100 scale:
- Strength: short-term price strength.
- Momentum: position within a recent price range.
- Context: position within the observed range of a rolling calendar-day window, seven days by default.
Choose three historical ribbons for a compact overview or curves for more detail. Four coordinated shades distinguish the lower zone, lower half, upper half and upper zone. The outer zones are darker and more saturated. Click a sidebar row to focus a channel, then click again to reset.
Signals in Trend identifies entries into configured pullback zones within the existing direction. It does not require a completed structural reversal. The readings are different calculations, not probabilities; Context is not a separate closed weekly candle.
Choose your confirmation
- Alignment: requires directional pressure to agree with the candidate.
- Choppiness: requires the reading to be below your selected maximum.
- Context: optionally requires the longer reading to agree with the direction.
- Volume Profile: optionally selects trend-change signals using POC or Value Area conditions.
The panel separates the last closed candle's readings from the decision recorded for the last trend change. Current Pass and Block states can differ from the conditions on that earlier candle.
Alignment, Choppiness and Context apply to enabled turn and in-trend candidates. Volume Profile filters trend-change candidates only. Panel filter choices persist for the chart instance across timeframe changes and restarts. Changing them recalculates historical selection without alerting on those historical changes.
Keep the previous session in view
The lateral volume profile shows the previous available completed UTC day's estimated distribution, Point of Control (POC), and 70% Value Area boundaries (VAH and VAL). Visibility and filtering are independent: the profile is shown by default, while its signal filter starts OFF.
POC and Value Area modes offer directional continuation conditions and qualifying rejections near a Value Area edge, with room towards POC. Other enabled filters must also pass. The profile does not create a new entry stream.
The estimate uses M1 candle ranges and real volume when available throughout the source session, otherwise tick volume. It is not trade-by-trade order flow. Check its source date before relating displayed levels to an earlier signal.
Make the workspace yours
Drag, resize or minimize the panel; choose Overview, Wave View or Compact. Quantum themes coordinate the line, markers, profile and subwindow. Chart Background is separate and defaults to Off (Keep Current).
Price Style can show trend-coloured candles or OHLC bars, while Show Trend Line remains independent. Signal Arrows controls arrow visibility, size, distance and theme or custom colours. Rejected-turn X markers are optional.
Calculation and settings
The initial setup uses ATR 10 / multiplier 3, Alignment and Choppiness ON, Context and profile filters OFF, and Signals in Trend from Strength OR Momentum. Periods, levels and signal spacing are adjustable. Max Bars defaults to 3,000; 0 displays all supplied history. Point spacing depends on the symbol's quote precision.
Alerts
Popup, sound, push and email alerts are available separately and start OFF. Push and email require terminal configuration. Alerts concern newly closed accepted signals; attachment and historical catch-up are silent.
Data and support
Install the main EX5 from MetaTrader 5 Navigator; Wave View and graphical resources are embedded. No separate companion, DLL or custom include installation is required. Use broker symbols with sufficient price history, including M1 history for the profile and enough history for the Context window. Missing required data can leave an enabled filter pending or block its signal.
Automatic session-clock mode detects the current broker UTC offset. A manual offset is available for historical periods and Strategy Tester use. Corrected history or changed inputs can change historical results.
Astral Wave Riding is an analysis indicator. It does not place or manage orders, size positions or define mandatory stops and targets. Support is available through MQL5 product comments and private messages.
Welcome to Astral
Built on research. Designed to work together.
Astral by Merkava Labs combines established analytical methods with original research to create complementary market indicators. Each module has a distinct role and a shared visual language, so you can use it independently or alongside the others.