RM Volume Profile
- Indicators
- Version: 1.0

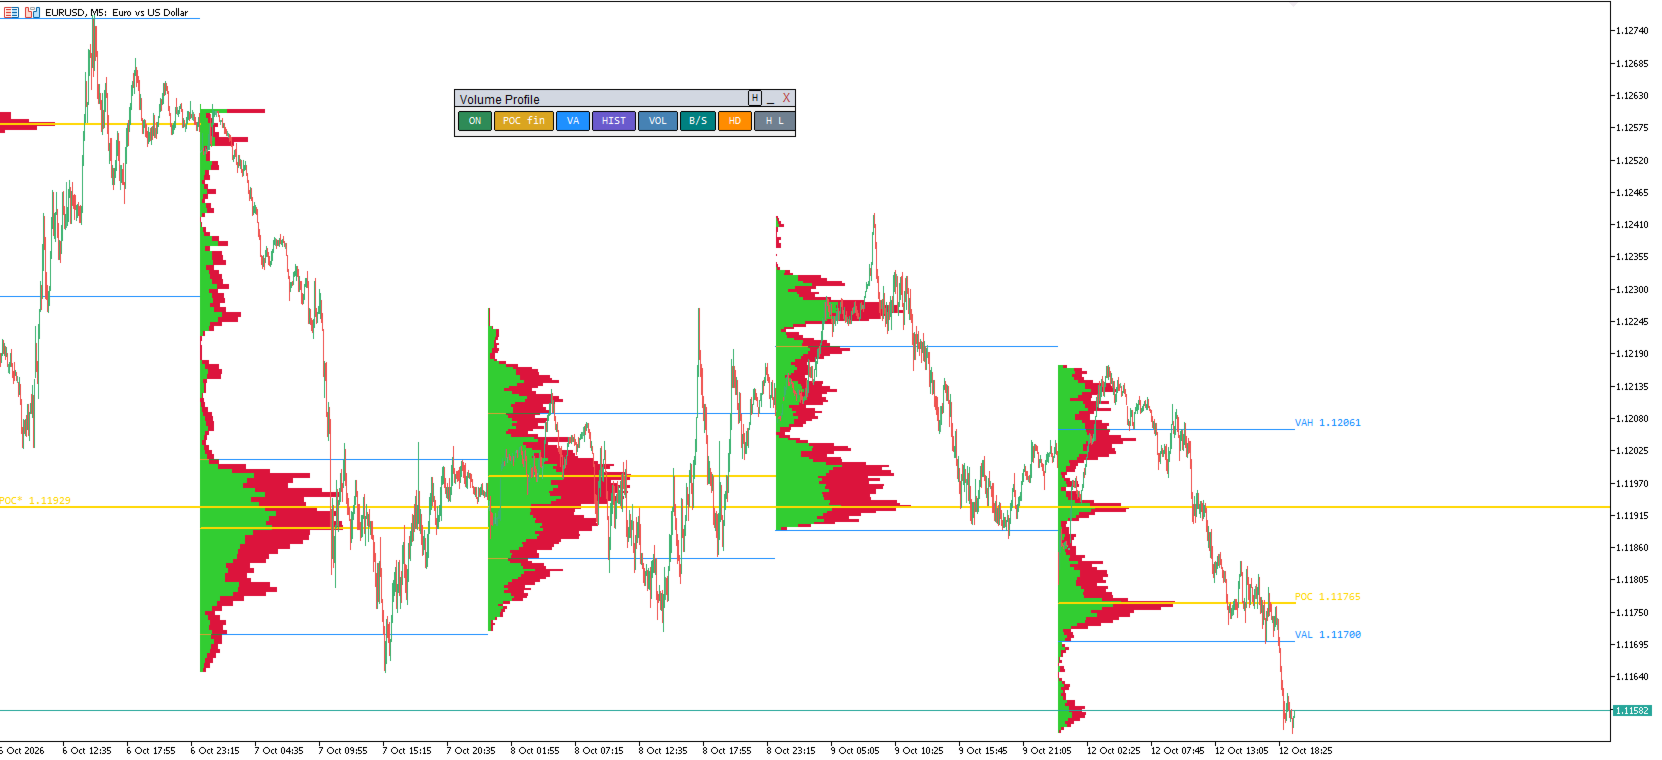
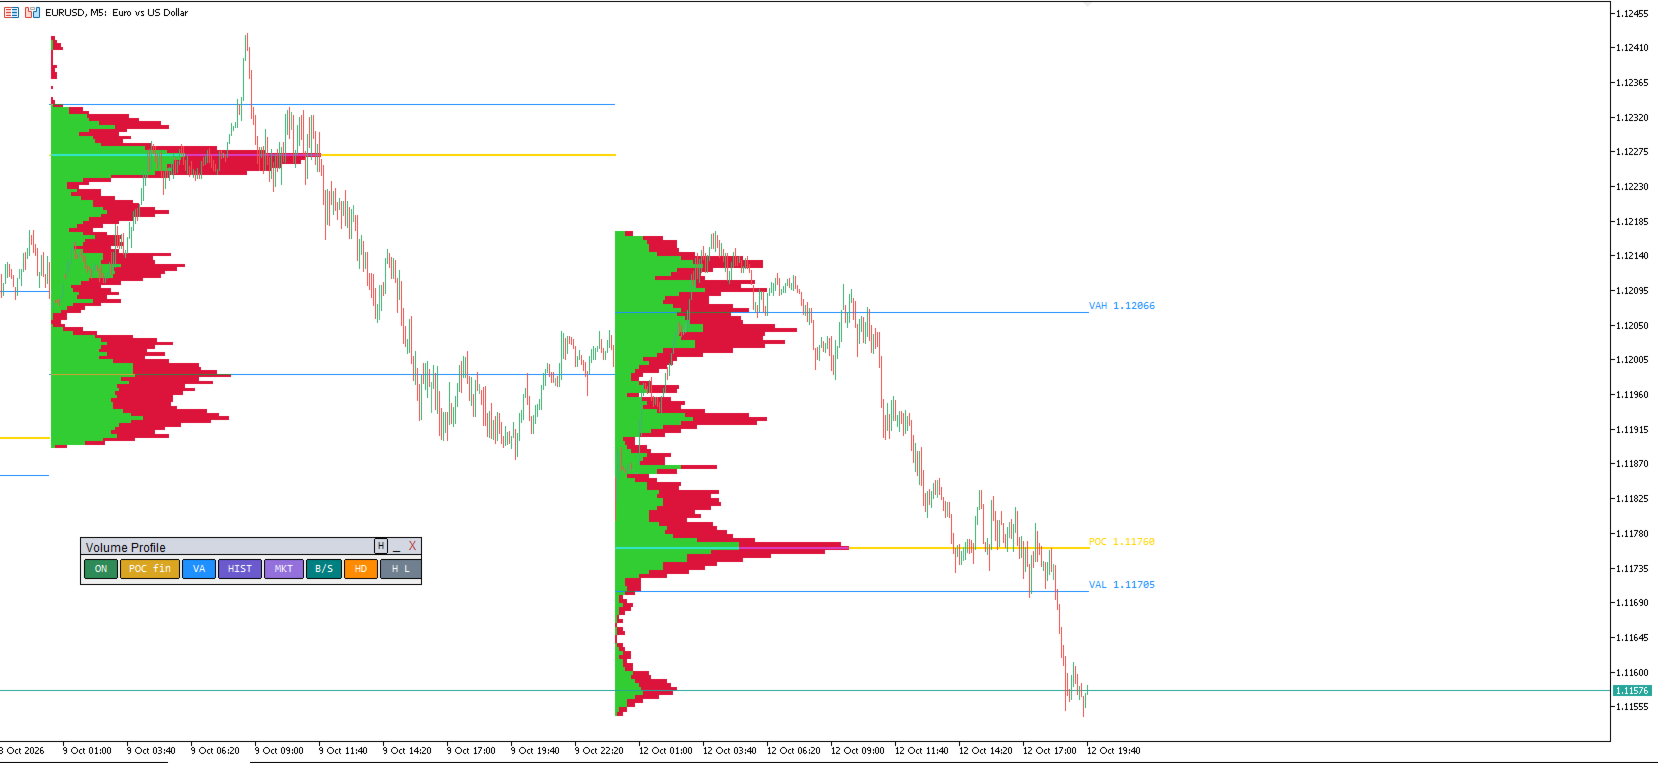
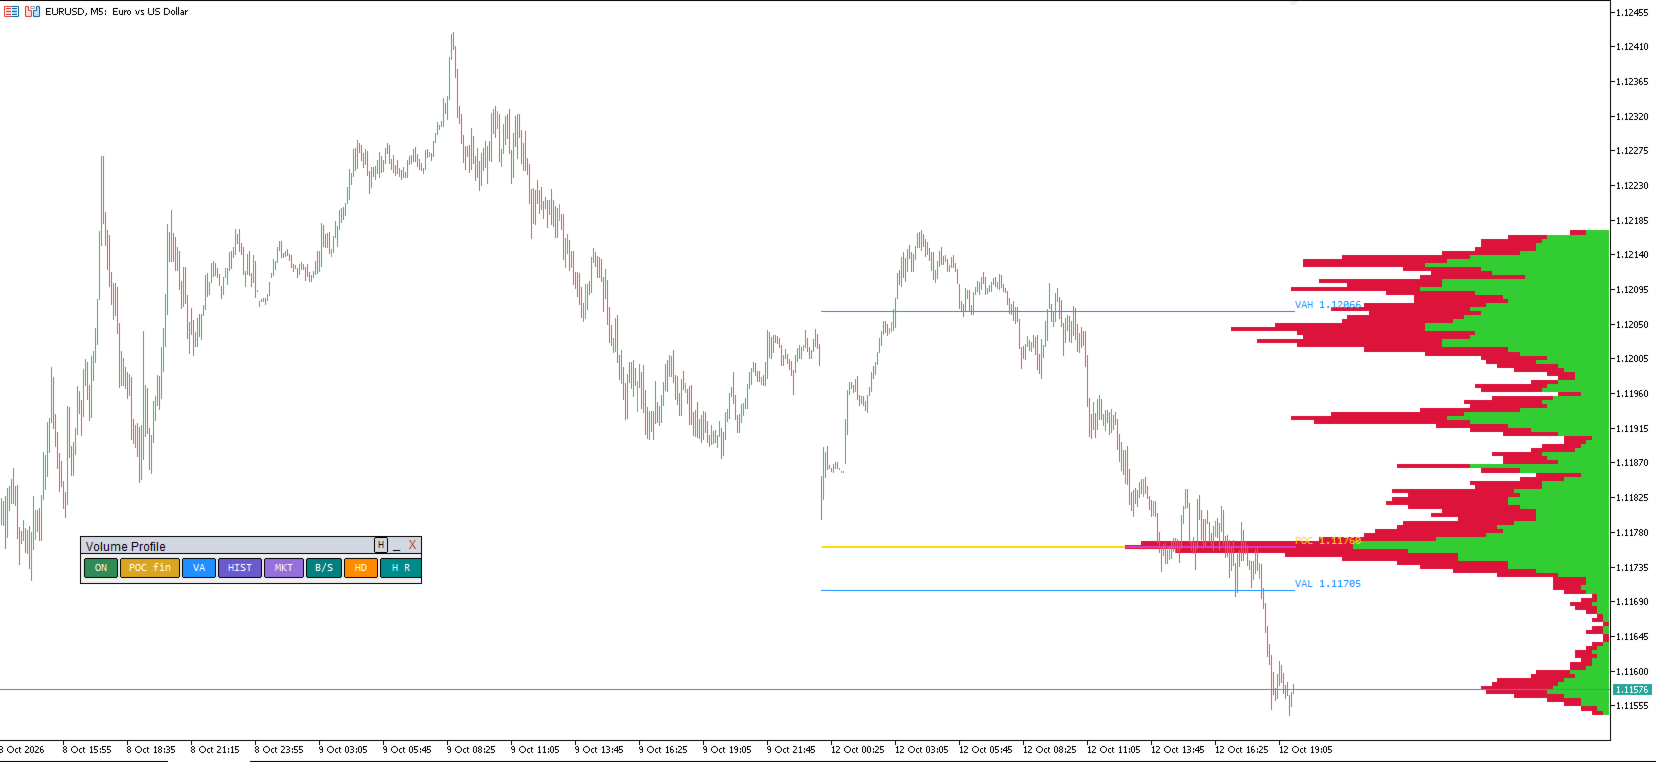
RM Volume Profile draws a full Volume Profile and Market Profile (TPO) on your chart — one profile per trading session — so you can see where real business was done and how the Point of Control migrates from day to day.
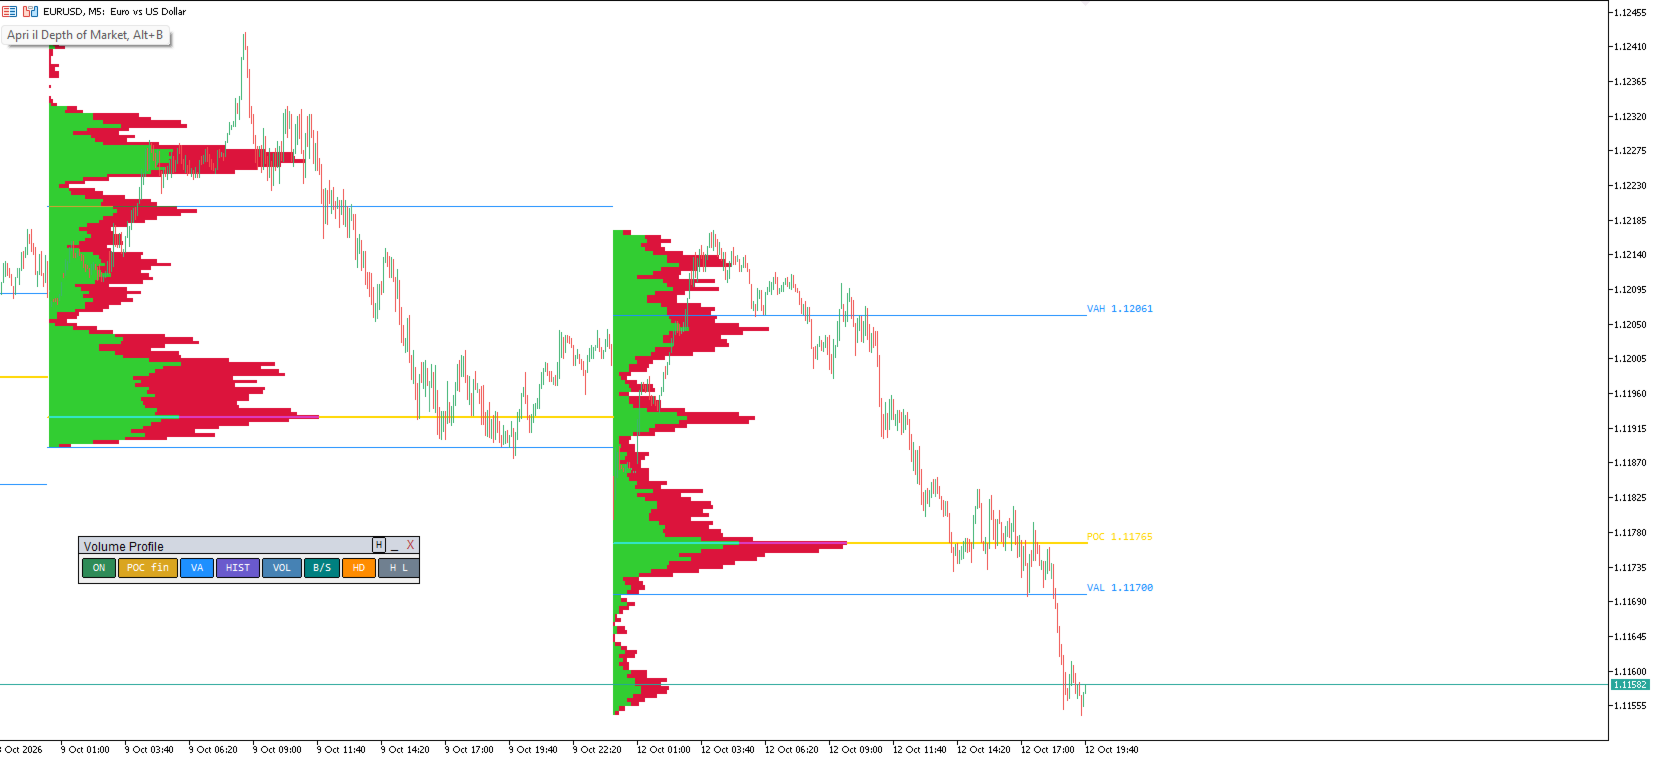
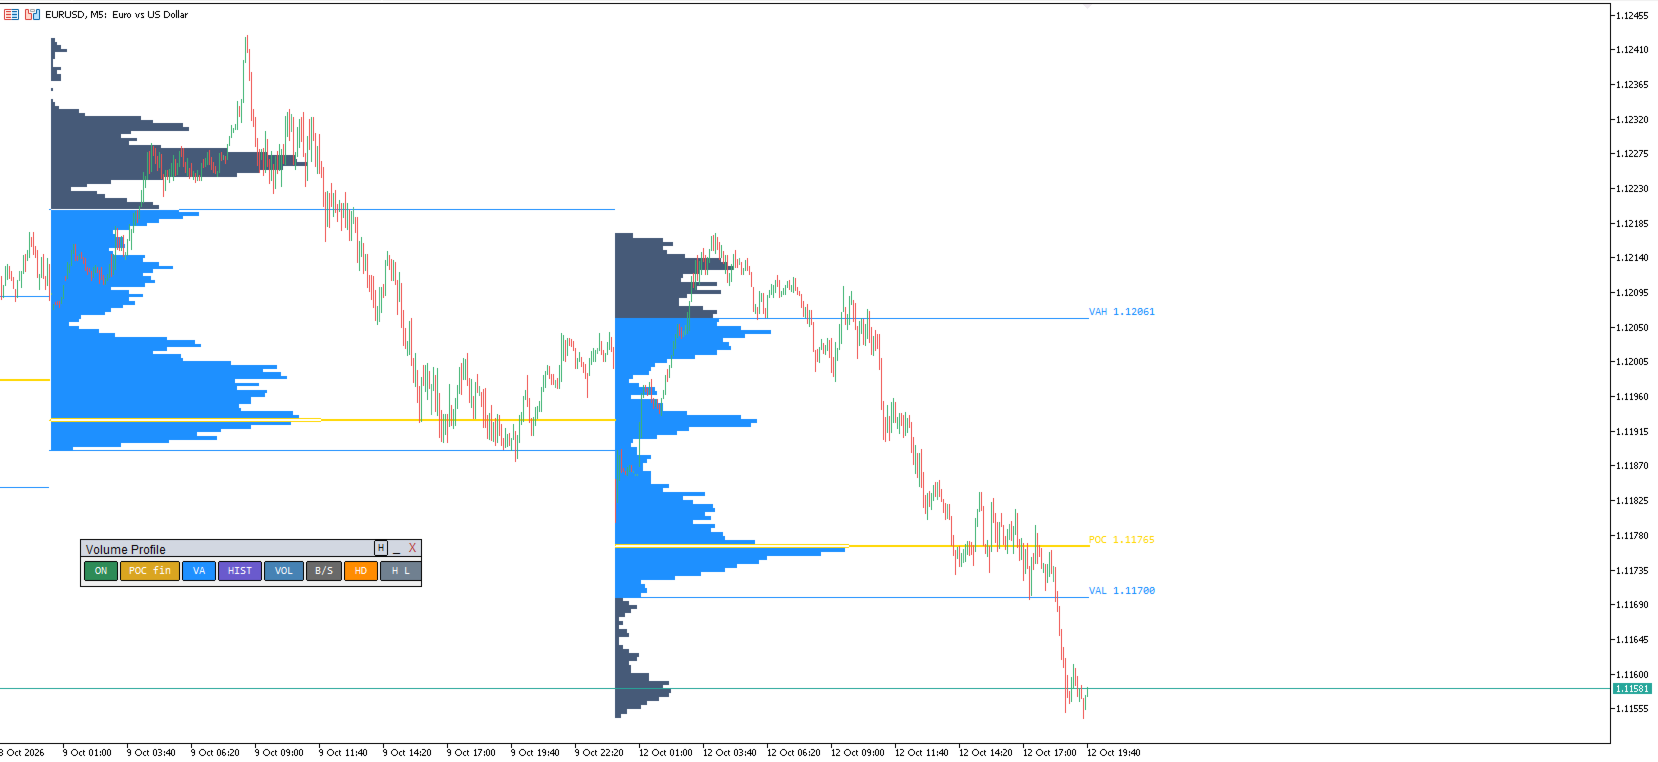
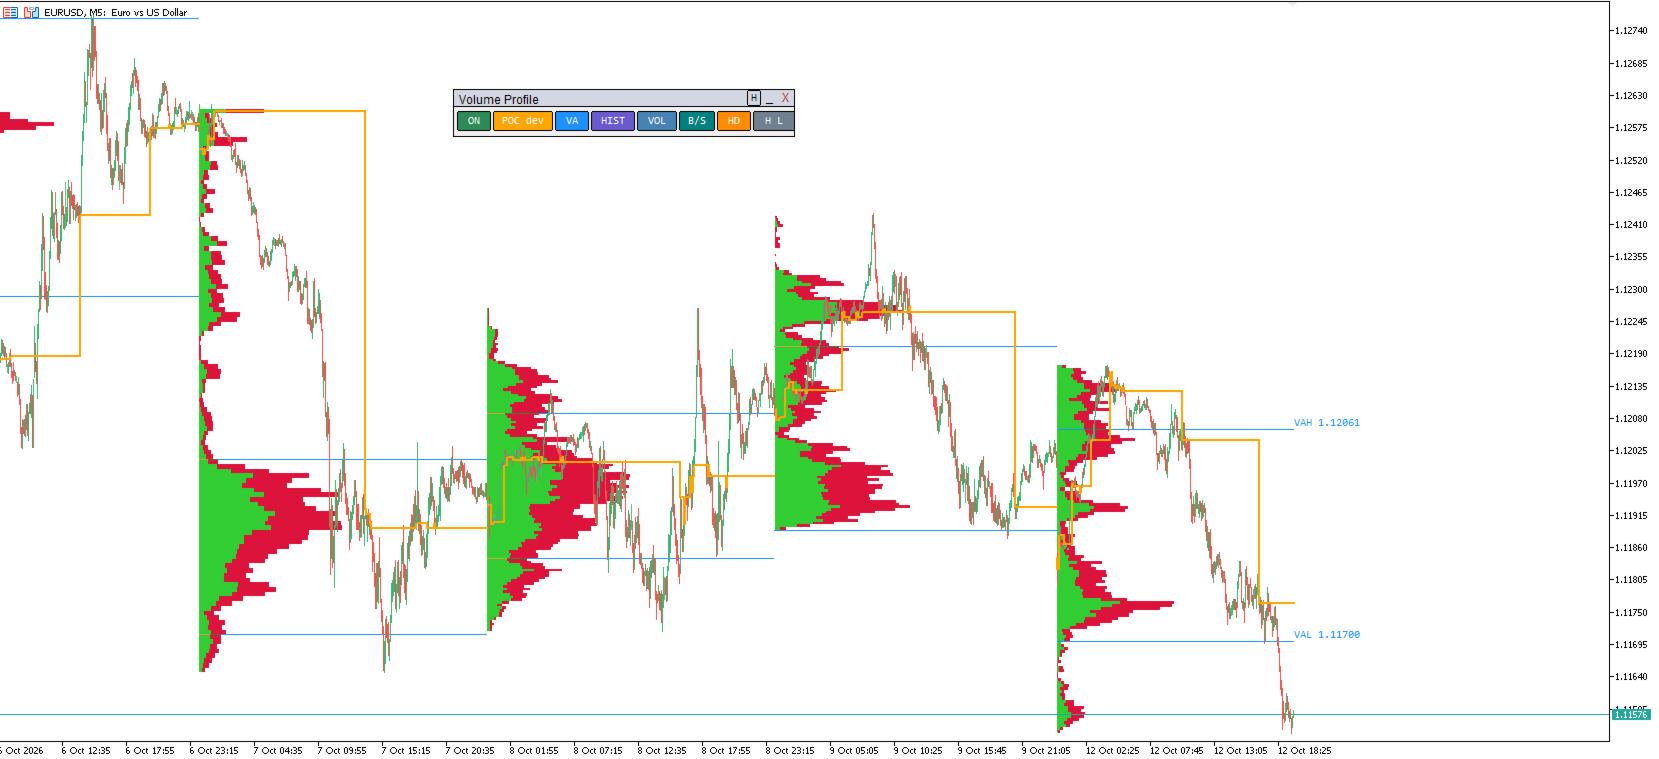
Each session shows its POC (Point of Control) and Value Area (VAH/VAL), plus an optional volume histogram. Show several previous sessions at once to follow POC migration and spot where the market accepted or rejected price.
KEY FEATURES
- Volume Profile AND Market Profile (TPO) in one indicator — one click to switch.
- Per-session profiles with a configurable session start: NY close (17:00), broker midnight, Europe midnight, or real exchange opens (Asia/Tokyo, London, US/NYSE, US pre-market), with daylight-saving time handled internally.
- Several previous sessions side by side to watch POC migration.
- POC, Value Area (VAH/VAL) with a configurable Value Area %.
- Developing POC: a stepped line that shows how the POC built up during the session.
- Buy/Sell split: colour the histogram by up/down candles to see where buyers and sellers were active.
- HD mode: distributes volume using M1 data for a precise profile on any timeframe.
- Left or right placement: anchor profiles at the session open (left), or pin the current session to the right edge so the histogram sits in the empty space and does not cover your candles.
- Click a POC / VAH / VAL to pin it as a horizontal level (shared across charts of the same symbol).
- Draggable on-chart panel with one-click toggles, plus an optional fixed X/Y position (handy on Mac).
- Fully customizable colours and line widths.
HOW TO USE
- Attach to any chart. Use the panel to switch Volume/Market Profile, buy/sell colouring, developing POC, HD and the histogram side.
- Trade with context: look for value acceptance/rejection around the POC and Value Area, and follow POC migration across sessions.
NOTES
- Self-contained: no DLL, no external indicators, no file dependencies. Works on any symbol and timeframe.
- Fast: recalculates only on a new bar and reuses chart objects.
- Volume is tick volume (standard on forex/CFD, where real exchange volume is not available).
- This is an analysis/context tool (where volume traded), not a signal/arrow system.