RM Cycle MTF
- Indicators
- Version: 1.0

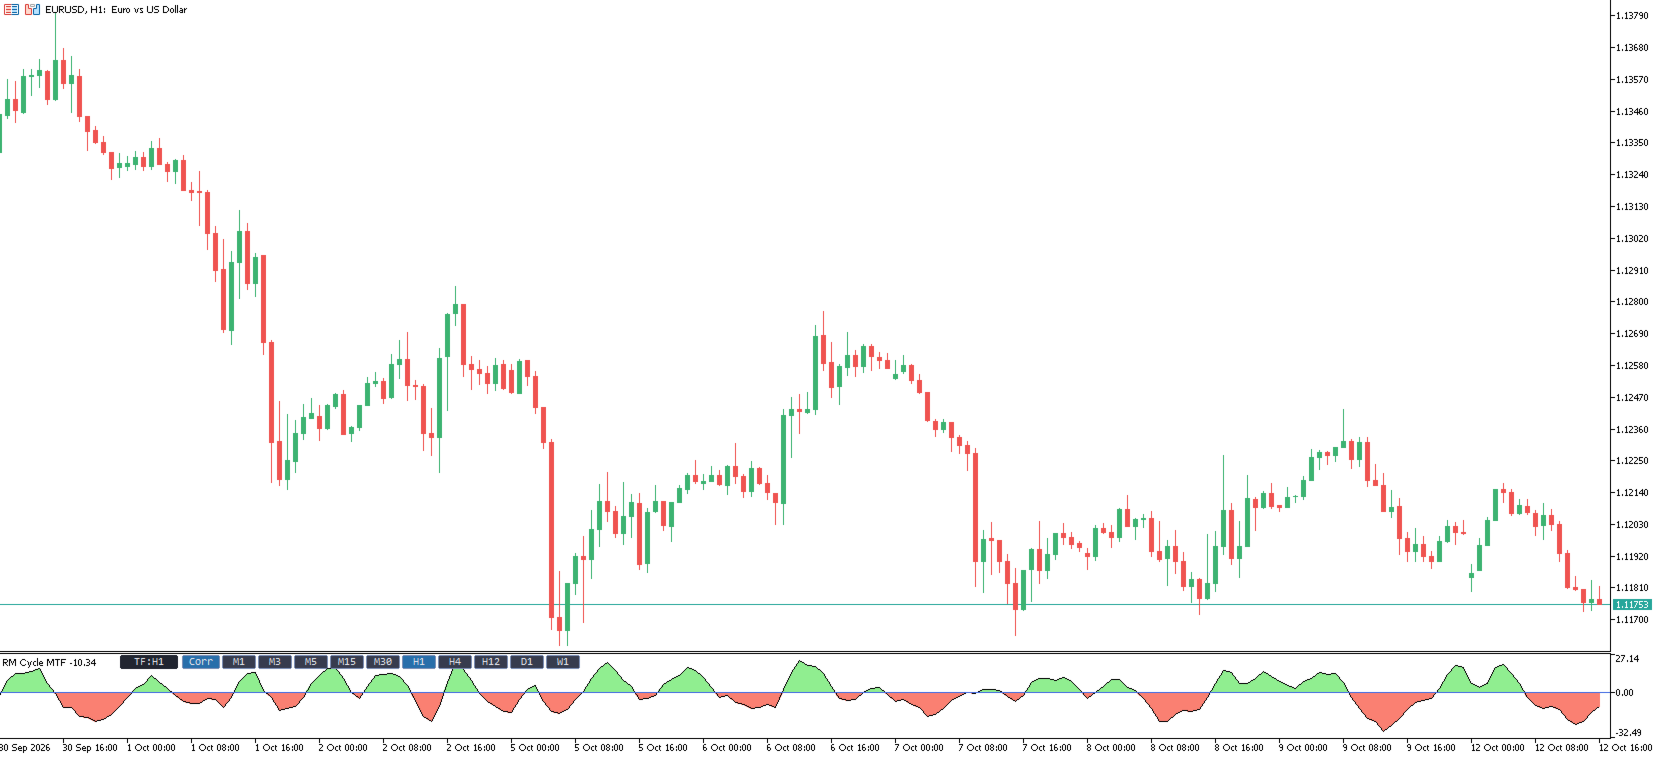
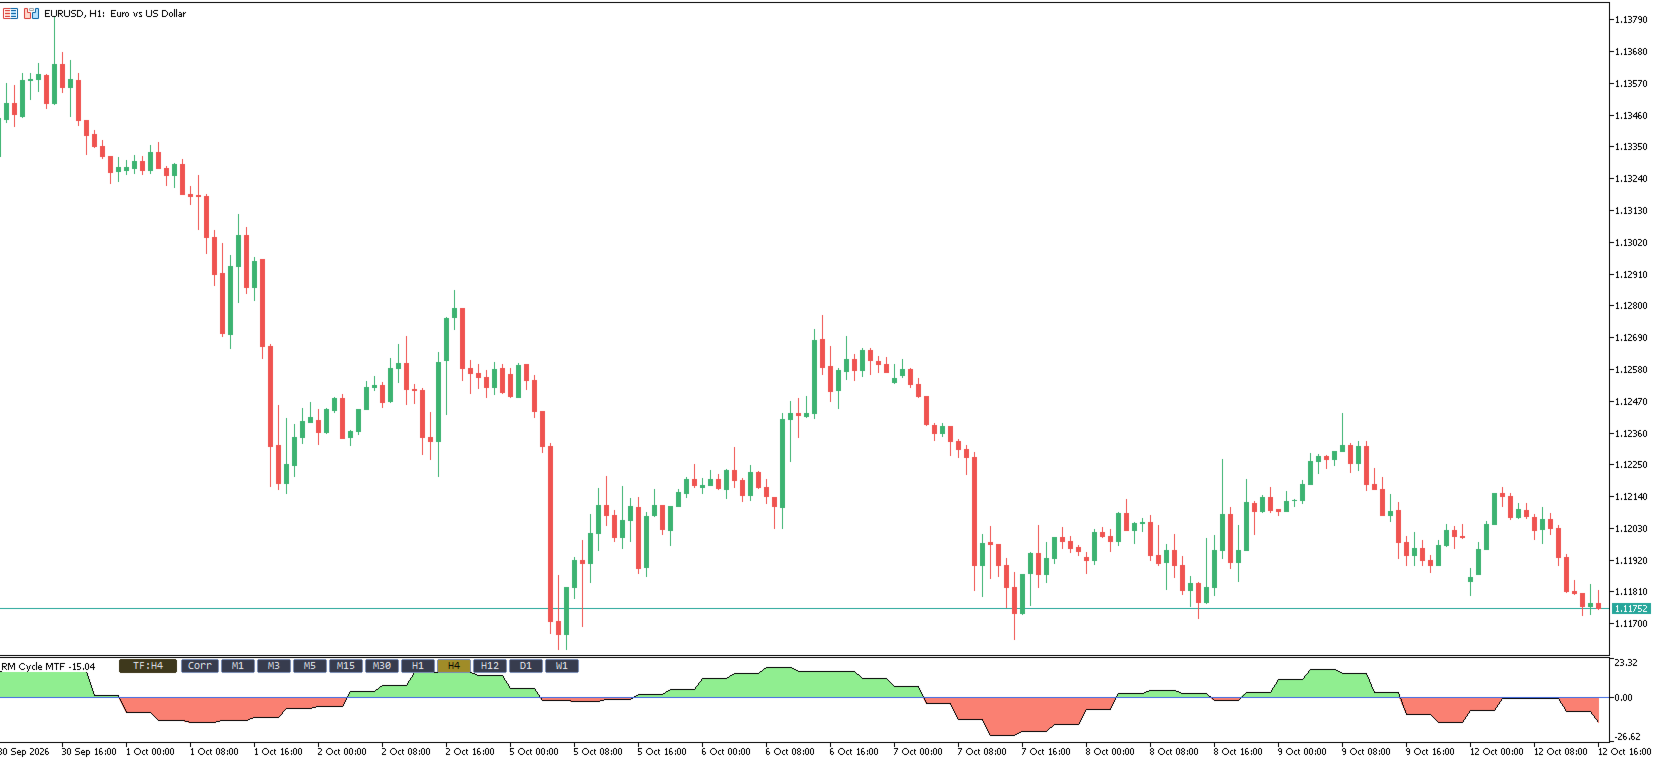
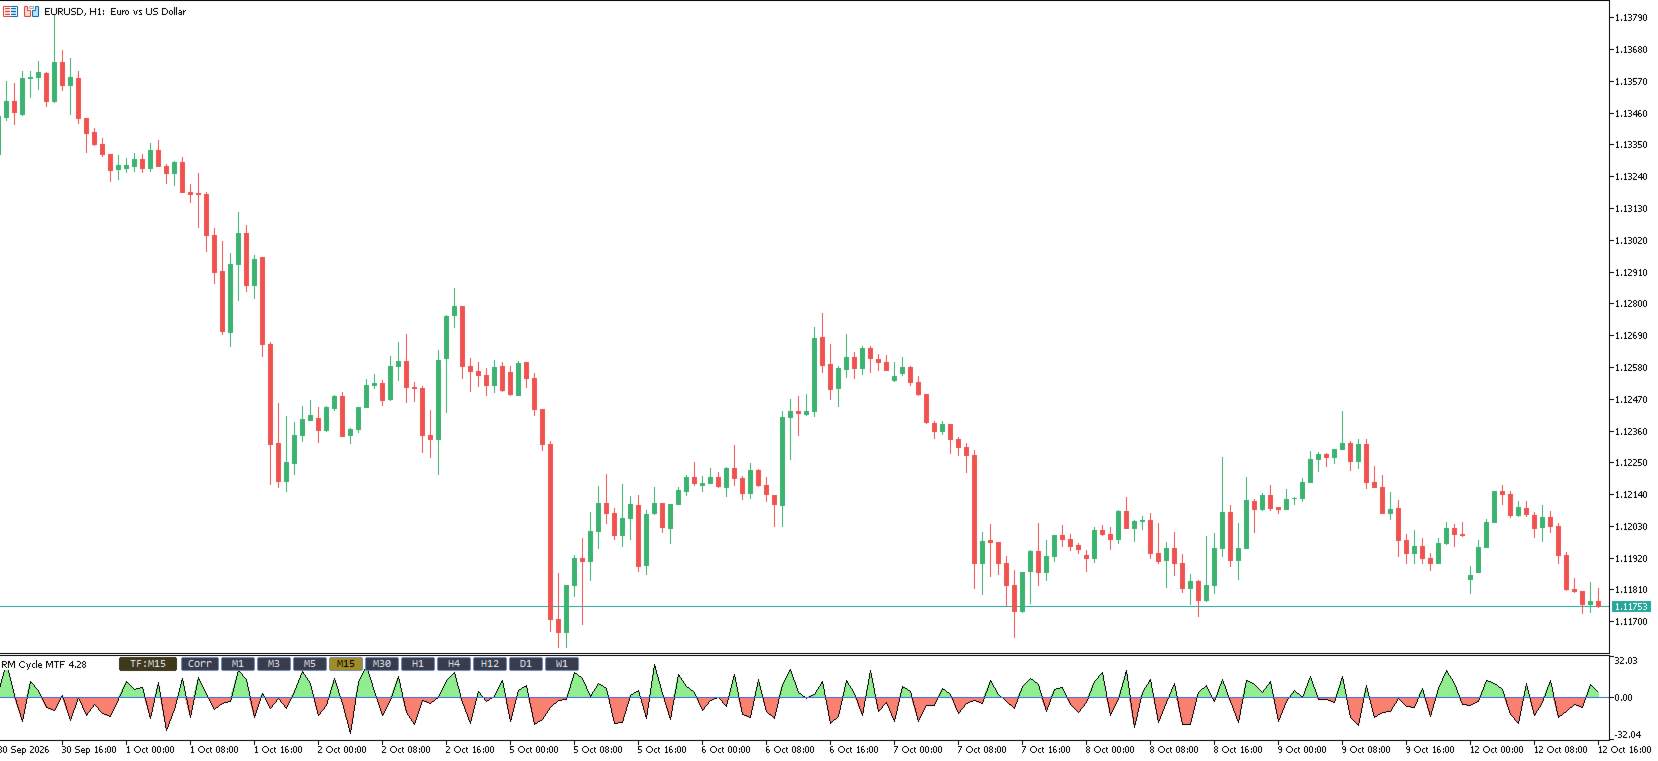
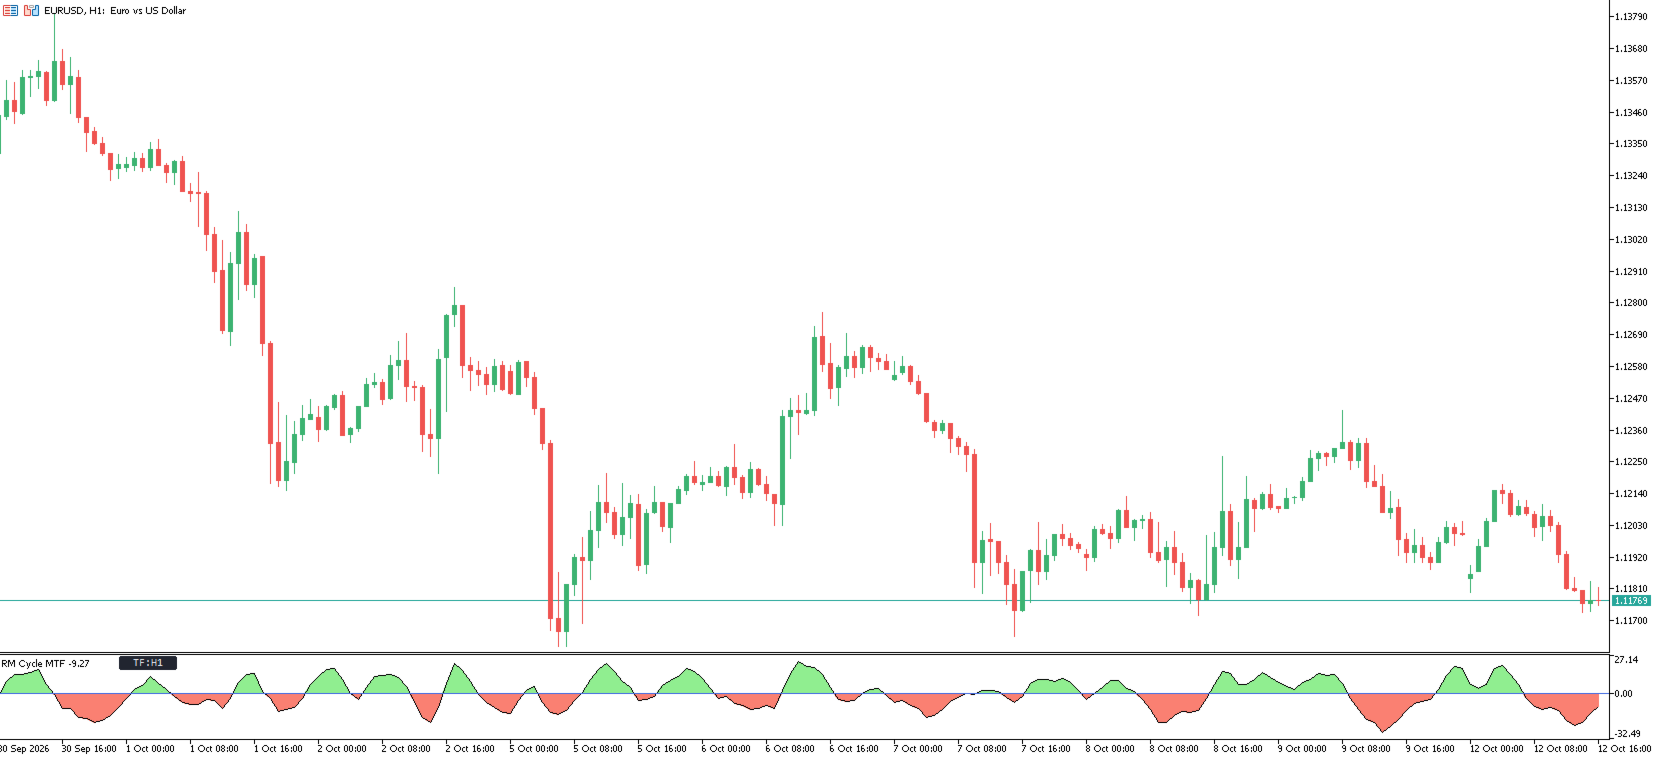
RM Cycle MTF plots a smoothed market-cycle oscillator in a sub-window and lets you display the cycle of ANY timeframe on your current chart — without switching chart. A compact, collapsible timeframe selector sits in the indicator window: pick a timeframe and the cycle re-computes instantly.
The oscillator swings around a zero line: a green filling above zero marks the up-phase of the cycle, a red filling below marks the down-phase. Use it to read the rhythm of the market, to time entries and exits in the direction of the cycle, and to compare a higher-timeframe cycle against your working timeframe.
KEY FEATURES
- Multi-timeframe: display the cycle of any timeframe on the current chart (built-in TF selector).
- Clean cycle line + zero-cross filling (up / down).
- Automatic cycle-line color (black on light background, white on dark), or set your own fixed color.
- Fully customizable colors and line width.
- Self-contained: no DLL, no external indicators, no file dependencies. Works on any symbol and timeframe.
- Lightweight; values on CLOSED bars do not repaint.
HOW TO USE
- Attach to any chart. Click the "TF:xx" label in the indicator window to open the timeframe selector, then choose the timeframe whose cycle you want to see.
- Trade with the cycle: look for turns of the cycle line through zero and alignment between your timeframe and a higher one.
PARAMETERS
- Automatic or fixed cycle-line color, filling color above / below zero, line width.
- Configurable timeframe list for the selector.
- Retina/scaling options for high-DPI / Mac displays.
NOTE
- This is a cycle/timing oscillator built from a blend of stochastic measures; it is a timing tool, not a signal/arrow system.
- On higher timeframes, the most recent bars reflect the still-forming higher-timeframe bar and update until it closes (standard multi-timeframe behavior); closed bars are fixed.