Streak Trader Pro
- Experts
- Version: 4.0
- Activations: 10

🚀 How to Grow Your Capital Fast — Without Overrisking or Blowing Up Trying
Every trader using fixed risk management knows the feeling: you recover from a loss, win again... and keep risking exactly the same amount as before, as if nothing happened. Streak Trader Pro changes that logic: it automatically capitalizes on your recoveries, without that meaning you take on more risk than you were already comfortable with. The result: a capital curve that grows faster, with the same risk profile as trading fixed percentage.
📈 Positive Streak Progression: How It Works
Unlike a traditional martingale (which increases risk after a loss, exposing you more and more), Streak Trader Pro uses the reverse approach: it rewards recovery, not drawdown.
The logic is simple:
- While trading in the normal state, risk is always the same (1% by default).
- When you come out of a loss with a win (the loss → win pattern), the system understands the account is recovering, and the next trade starts with reinforced risk (1.4% by default).
- If that reinforced trade also wins, risk scales one more step (1.96%). The Streak Cap defines how many steps the reinforcement can scale before returning to base risk — with StreakCap=3 , the maximum is 2 consecutive reinforced trades.
- Any loss, at any point in the reinforced cycle, immediately cuts the scaling and returns to NORMAL.
Example 1 — Streak Cap = 3 | When reinforced trades chain wins (Starting capital $100,000 · Base risk 1% · Multiplier 1.4 · Ratio 2:1)
| # | State | Result | Risk | P/L | Capital |
|---|---|---|---|---|---|
| 1 | NORMAL | Loss | 1% | -$1,000 | $99,000 |
| 2 | NORMAL | Win (recovers) | 1% | +$2,000 → activates reinforcement | $101,000 |
| 3 | REINFORCED (level 1) | Win | 1.4% | +$2,800 → scales | $103,800 |
| 4 | REINFORCED (level 2) | Win | 1.96% | +$3,920 → cap reached, returns to normal | $107,720 |
| 5 | NORMAL | Win | 1% | +$2,000 (no prior loss, stays NORMAL) | $109,720 |
| 6 | NORMAL | Loss | 1% | -$1,000 | $108,720 |
| 7 | NORMAL | Win (recovers) | 1% | +$2,000 → activates reinforcement | $110,720 |
| 8 | REINFORCED (level 1) | Win | 1.4% | +$2,800 → scales | $113,520 |
| 9 | REINFORCED (level 2) | Win | 1.96% | +$3,920 → cap reached, returns to normal | $117,440 |
| 10 | NORMAL | Win | 1% | +$2,000 | $119,440 |
Result with Progression: +$19,440 (+19.44%)
The same win history trading fixed 1% risk: +$14,000 (+14%)
➜ Same win history, nearly 39% more profit just from better capitalizing on the two recoveries.
Example 2 — Streak Cap = 3 | When the reinforced trade loses (worst case)
| # | State | Result | Risk | P/L | Capital |
|---|---|---|---|---|---|
| 1 | NORMAL | Win | 1% | +$2,000 | $102,000 |
| 2 | NORMAL | Loss | 1% | -$1,000 | $101,000 |
| 3 | NORMAL | Win (recovers) | 1% | +$2,000 → activates reinforcement | $103,000 |
| 4 | REINFORCED (level 1) | Loss | 1.4% | -$1,400 → cuts the cycle, returns to normal | $101,600 |
| 5 | NORMAL | Loss | 1% | -$1,000 | $100,600 |
| 6 | NORMAL | Win (recovers) | 1% | +$2,000 → activates reinforcement | $102,600 |
| 7 | REINFORCED (level 1) | Loss | 1.4% | -$1,400 → cuts the cycle, returns to normal | $101,200 |
| 8 | NORMAL | Win | 1% | +$2,000 | $103,200 |
| 9 | NORMAL | Loss | 1% | -$1,000 | $102,200 |
| 10 | NORMAL | Win (recovers) | 1% | +$2,000 → activates reinforcement | $104,200 |
Result with Progression: +$4,200 (+4.2%)
The same history at fixed 1% risk: +$5,000 (+5%)
➜ Even in the worst-case scenario (both reinforced trades lose as soon as they activate), the difference against fixed risk is minimal: $800 on $100,000. The extra risk never goes above 1.4% before cutting off — and capital never drops below the starting balance.
Example 3 — Streak Cap = 3 | Win, lose, then a long winning streak
| # | State | Result | Risk | P/L | Capital |
|---|---|---|---|---|---|
| 1 | NORMAL | Win | 1% | +$2,000 (no prior loss, stays NORMAL) | $102,000 |
| 2 | NORMAL | Loss | 1% | -$1,000 | $101,000 |
| 3 | NORMAL | Win (recovers) | 1% | +$2,000 → activates reinforcement | $103,000 |
| 4 | REINFORCED (level 1) | Win | 1.4% | +$2,800 → scales | $105,800 |
| 5 | REINFORCED (level 2) | Win | 1.96% | +$3,920 → cap reached, returns to normal | $109,720 |
| 6 | NORMAL | Win | 1% | +$2,000 (no prior loss, stays NORMAL) | $111,720 |
| 7 | NORMAL | Win | 1% | +$2,000 | $113,720 |
| 8 | NORMAL | Win | 1% | +$2,000 | $115,720 |
| 9 | NORMAL | Win | 1% | +$2,000 | $117,720 |
| 10 | NORMAL | Win | 1% | +$2,000 | $119,720 |
Result with Progression: +$19,720 (+19.72%)
The same history at fixed 1% risk: +$17,000 (+17%)
➜ Here's the key point: even with 9 winning trades out of 10, reinforcement only kicked in on trades 4 and 5 — the ones that closed the recovery cycle. The long winning streak from trades 6 through 10, impressive as it is, gets no extra risk because there was no new loss to recover from.
The advantage in one sentence: risk per trade is practically the same as managing fixed percentage — but when the account recovers from a loss, your capital grows faster, without taking on meaningful additional risk.
🎯 Getting the Most Out of Streak Trader Pro
Streak Trader Pro has a lot of parameters — and that's an advantage, not a problem: it means the EA can be fine-tuned to fit each instrument. But optimizing everything at once can take weeks of computation. That's why we put together a 2-step process that cuts that time down to hours, without giving up robustness.
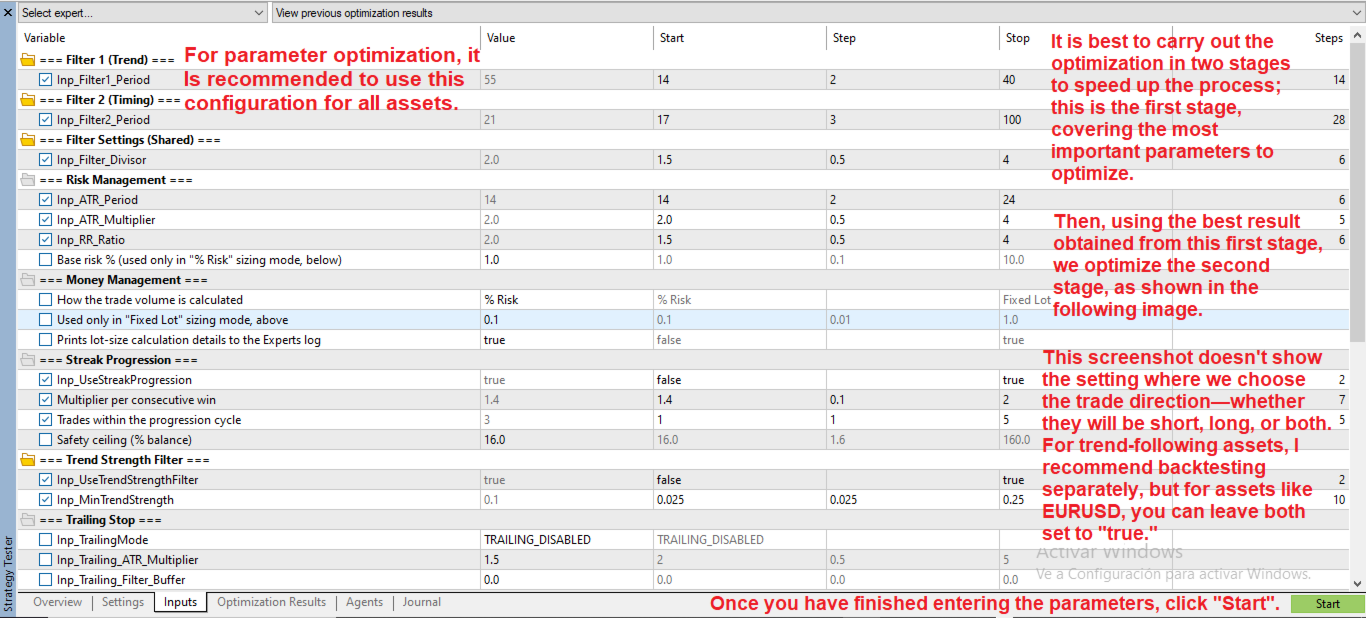
Step 1 — Filters and the risk engine
Start by optimizing what defines when and how the EA enters: the trend filters (Filter 1, Filter 2, Trend Strength), risk management (ATR, risk-reward ratio), and Streak Progression (multiplier, streak cap). (See screenshot 1)
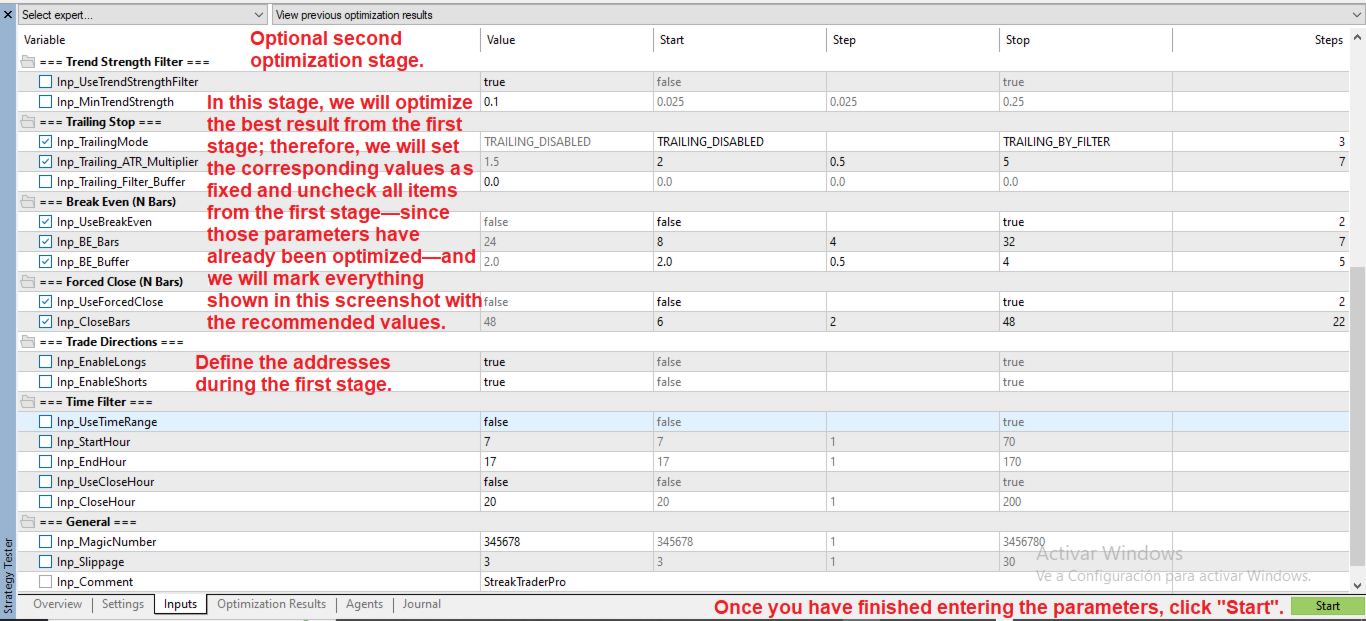
Step 2 — Fine-tuning management
With the best result from Step 1 already locked in, add Trailing Stop, Break Even, and Forced Close for a second pass that polishes the equity curve. (See screenshot 2)
🧭 Longs and Shorts: know your instrument
Does your instrument have a strong directional bias? Optimize Longs and Shorts separately — you'll find more precise configurations than leaving both mixed together. On more balanced pairs like EURUSD, you can leave both directions active without losing precision.
⚠️ The golden rule: the Forward period
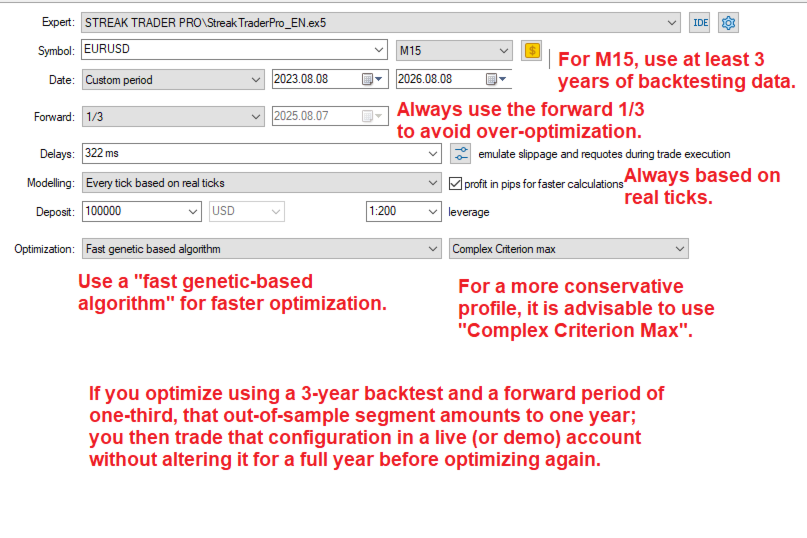
This is what separates an EA that looks like it works from one that actually works: never trust a backtest optimized on 100% of the historical data. In our own tests we used:
- 3 years of data (2023.08.08 – 2026.08.08)
- Forward of 1/3: the last stretch stays completely out of the optimization, like a pop quiz
- Modeling "Every tick based on real ticks" — the most demanding one MT5 offers
- "Complex Criterion max" criterion with fast genetic algorithm
If the result holds up in the Forward period, you have a robust configuration. If it collapses, it was just curve-fitting disguised as a good backtest — and you just saved yourself from losing real money finding that out. (See screenshot 3)
One last filter before going live: run the final configuration on a demo account for the same length of time as your Forward period, without touching a single parameter. It's the final proof separating a system that's ready to trade from one that only looks good on a chart.
⚠️ Trading carries real risk of capital loss. Streak Trader Pro is a management and execution tool, not a promise of guaranteed profits. Past results do not guarantee future results. It's recommended to trade on a demo account first.