Cosmo Range Estimator
- Indicators
- Version: 1.0

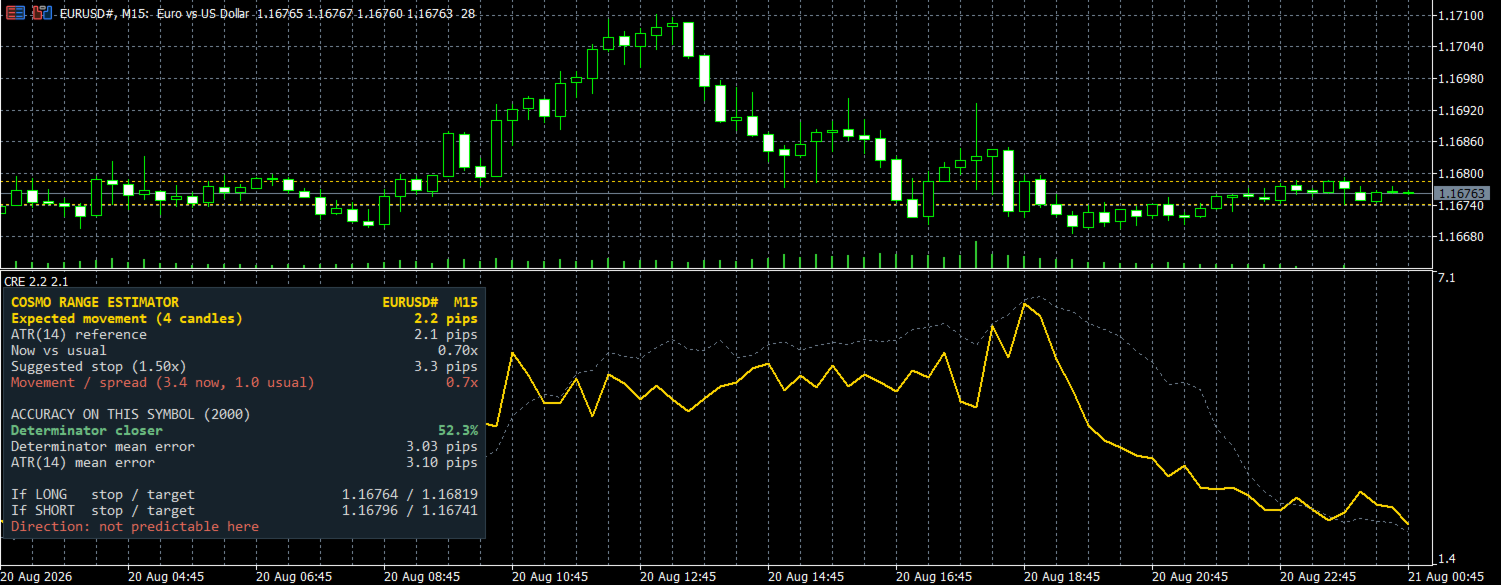
**Cosmo Range Estimator tells you how far price is likely to move. It does not tell you which way.**
Most traders size their stops and targets with ATR(14). That 14 was chosen by Welles Wilder in 1978, for daily charts. It was inherited into intraday trading without anyone re-measuring whether it still fits.
We measured it. On 634,970 EURUSD M15 candles, the **Cosmo Determinator** — our own volatility engine — predicts the size of the next move more accurately than ATR(14). We then applied the same coefficients, **without refitting them**, to eight other pairs that took no part in building the model. It improved on all eight.
**WHAT IT IS FOR**
- **Whether the trade is worth opening.** The panel shows expected movement ÷ spread. If movement does not clear your cost comfortably, the trade starts negative by arithmetic, not by bad luck.
- **Stop distance.** The usual rule is "1.5 × ATR(14)". The panel gives you that number from a better estimate: wider when volatility is about to rise, tighter when it is about to fall.
- **Target reachability.** Are 30 pips realistic in the next 4 candles? If the estimate says 8, they are not.
- **Position size.** If your stop comes from volatility and your lot comes from your stop, a better estimate makes your **actual** risk per trade closer to your **intended** risk.
**IT CHECKS ITSELF, ON YOUR CHART**
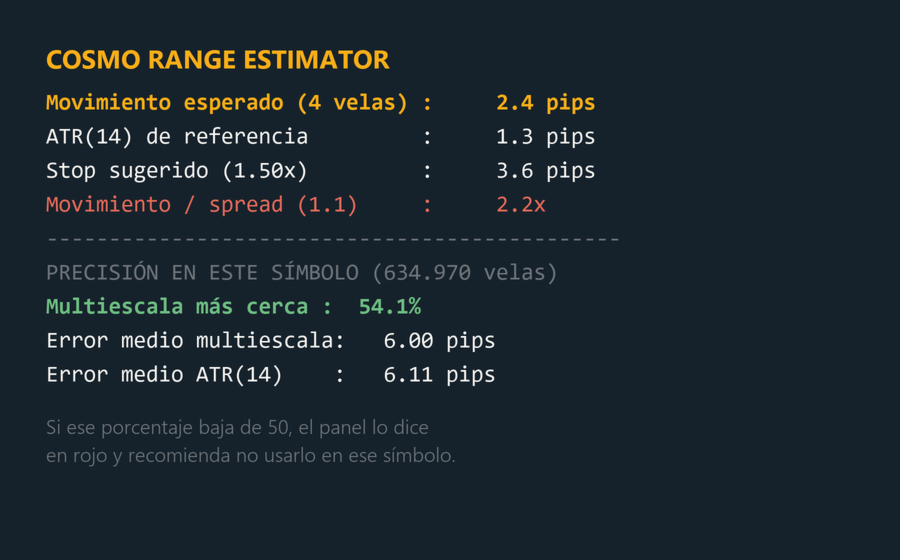
You do not have to take our EURUSD numbers on faith. The panel measures, on **your** symbol and **your** timeframe, how often the Determinator estimate landed closer to the real movement than ATR(14) did — and the average error of each, in pips.
**If that figure drops below 50%, the panel says so in red and tells you not to use it on that symbol.**
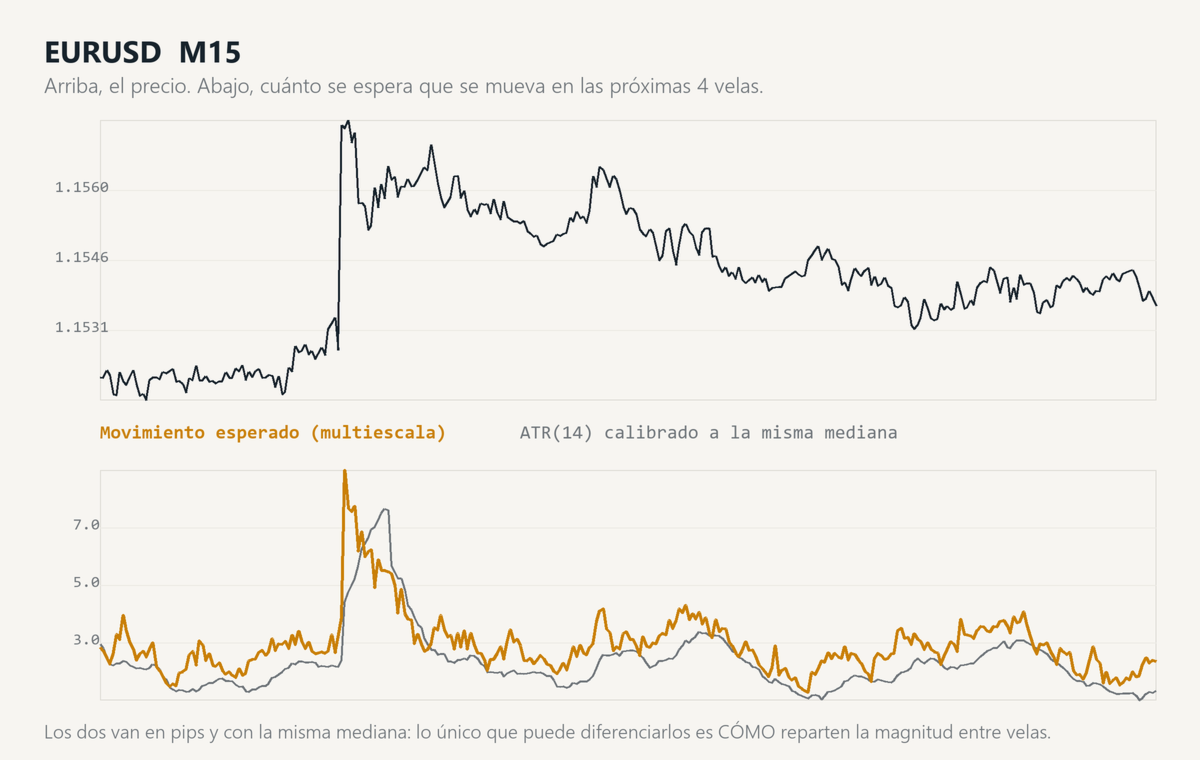
Both estimators are calibrated to the same median before being compared, so the difference cannot come from one simply being larger than the other. Only from how each distributes movement across candles.
**THE NUMBERS, HONESTLY**
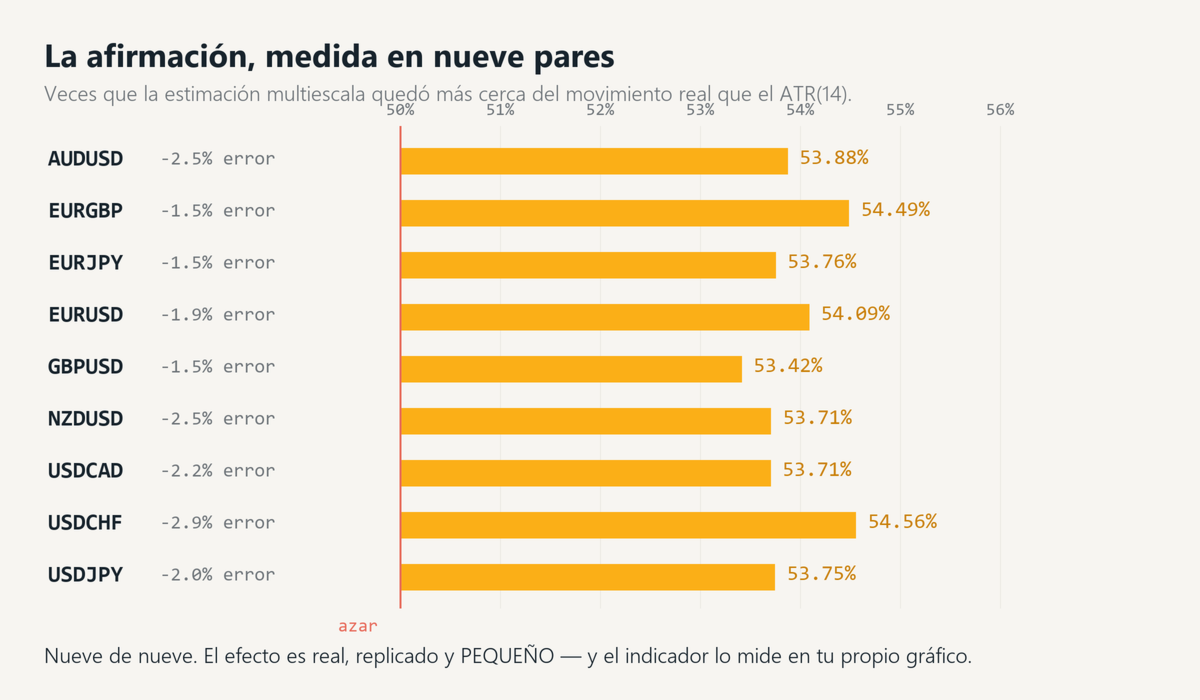
Across nine pairs, the Determinator estimate landed closer to the real movement than ATR(14) in **53.8%** of candles (median), with **2.0%** lower average error. Nine out of nine pairs improved.
And it is not tied to one horizon: it holds on 9 of 9 pairs at every horizon we tested, from 1 to 32 candles, and the advantage grows with it.
That is a real, replicated and **small** effect. In explained variance the improvement is +30%, but that ratio flatters it: measured in pips of actual error it is 2%. We prefer to state the smaller number, because it is the one you will experience.
**WHAT IT DOES NOT DO**
- **It does not give direction.** Magnitude has no sign. It cannot tell you to buy or sell, and using it as an entry signal is using it wrong.
- **It does not predict profit.** We tested this estimator four times inside our own trading system — as a target, as a position size, as an entry filter, as a breakout distance — and all four failed against pre-registered acceptance criteria. Measuring movement better does not by itself produce an edge. This product sells the ruler, not a promise.
- **It is a weak predictor in absolute terms.** It explains 13.5% of the variance in move size; ATR(14) explains 10.3%. Both are weak. This one is less so.
**PARAMETERS**
| Parameter | Default | What it does |
|---|---|---|
| Horizon | 4 | Candles ahead. 4 is the horizon the model was validated on; the panel warns you if you change it |
| Calibration window | 2000 | Candles used to calibrate the level and to measure accuracy |
| Stop multiple | 1.5 | Multiplier for the suggested stop distance |
| Show panel | true | Numeric panel on/off |
**NOTES**
Works on any symbol and any timeframe. The model's shape is fixed — those coefficients are the finding — but its **level** is calibrated on your symbol, because the estimator is not scale-invariant and shipping a fixed level would produce nonsense on instruments with a different pip scale.
No trading signals. No arrows. No alerts to buy or sell. It is a measuring instrument.