Multi Timeframe Moving Average Pro
- Indicators
-
Heiko Manfred Priebusch
 Hello and welcome! I’m glad you’re here.
Behind my programs is not an anonymous software developer, but someone who knows exactly what it feels like to sit in front of the charts, searching for that next well-founded, informed decision. - Version: 3.2
- Updated: 10 July 2026
See every timeframe's trend at a glance — without leaving your current chart.
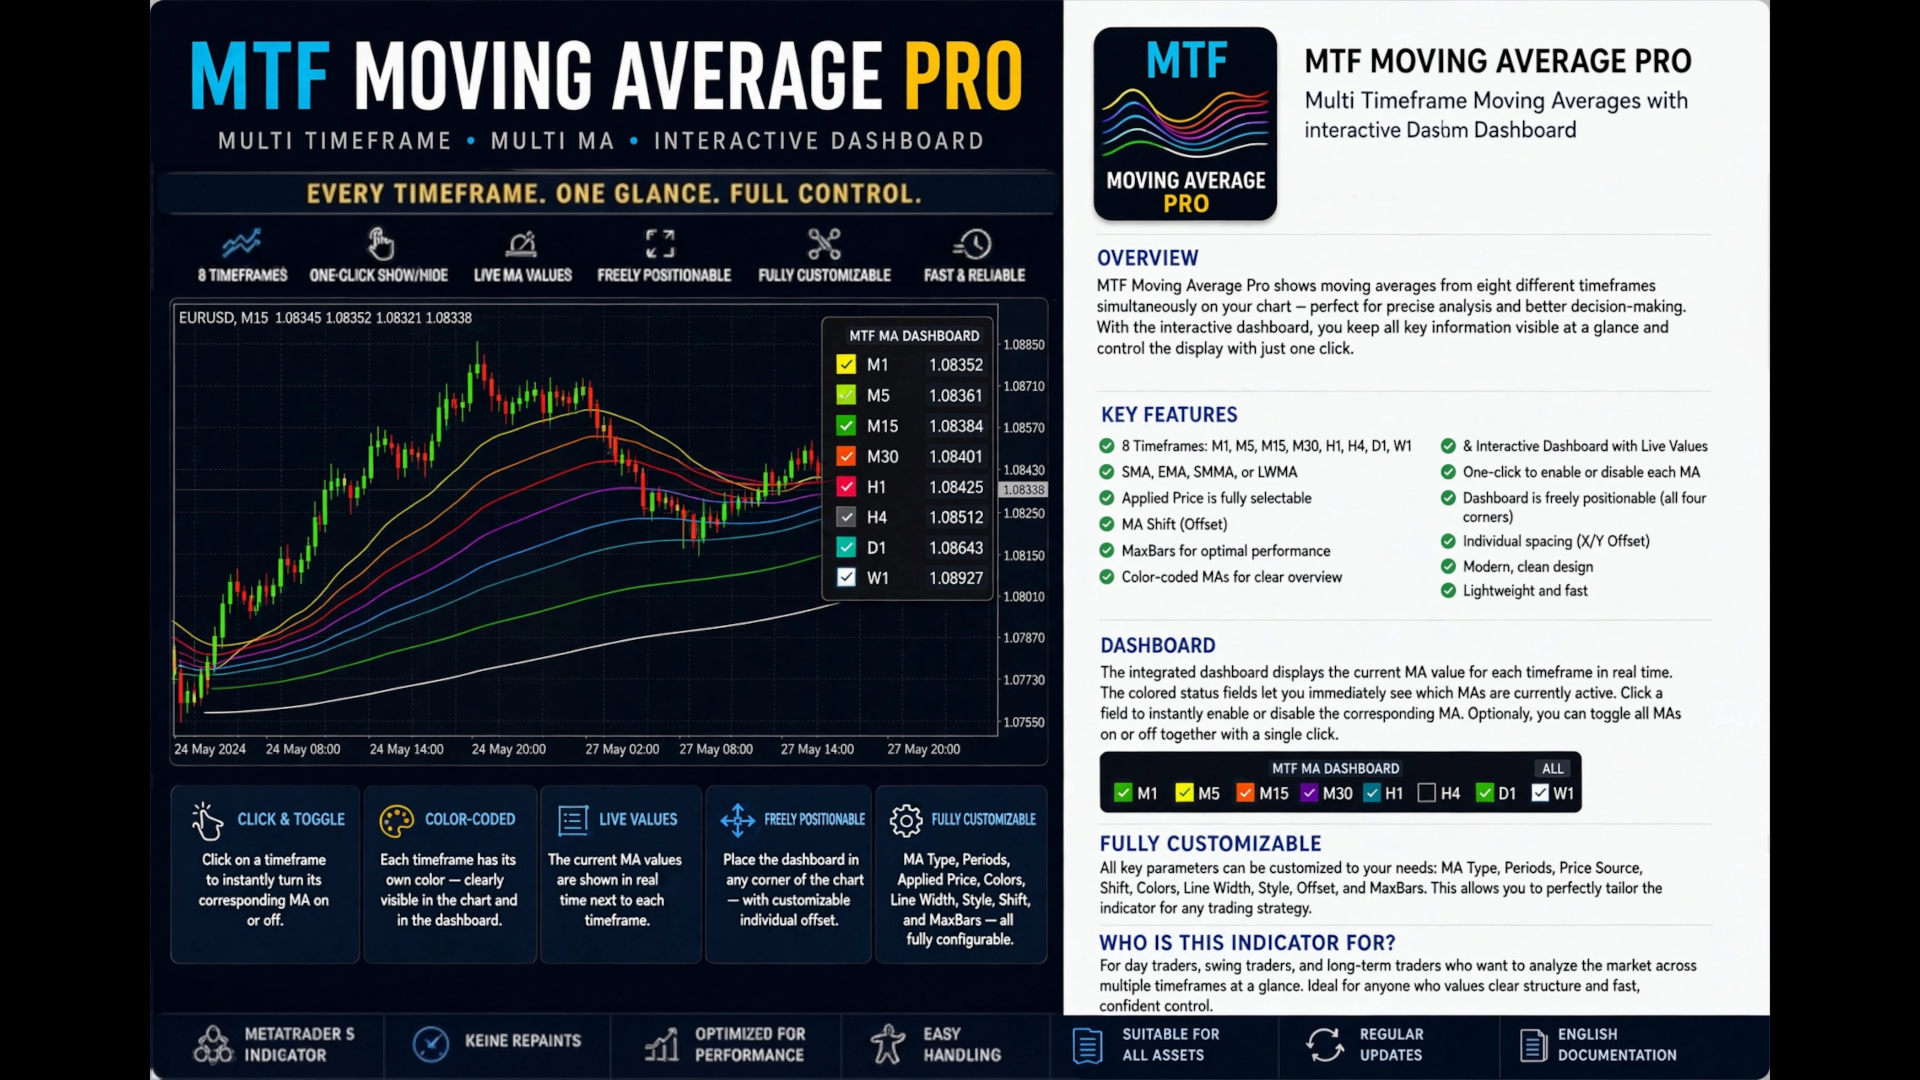
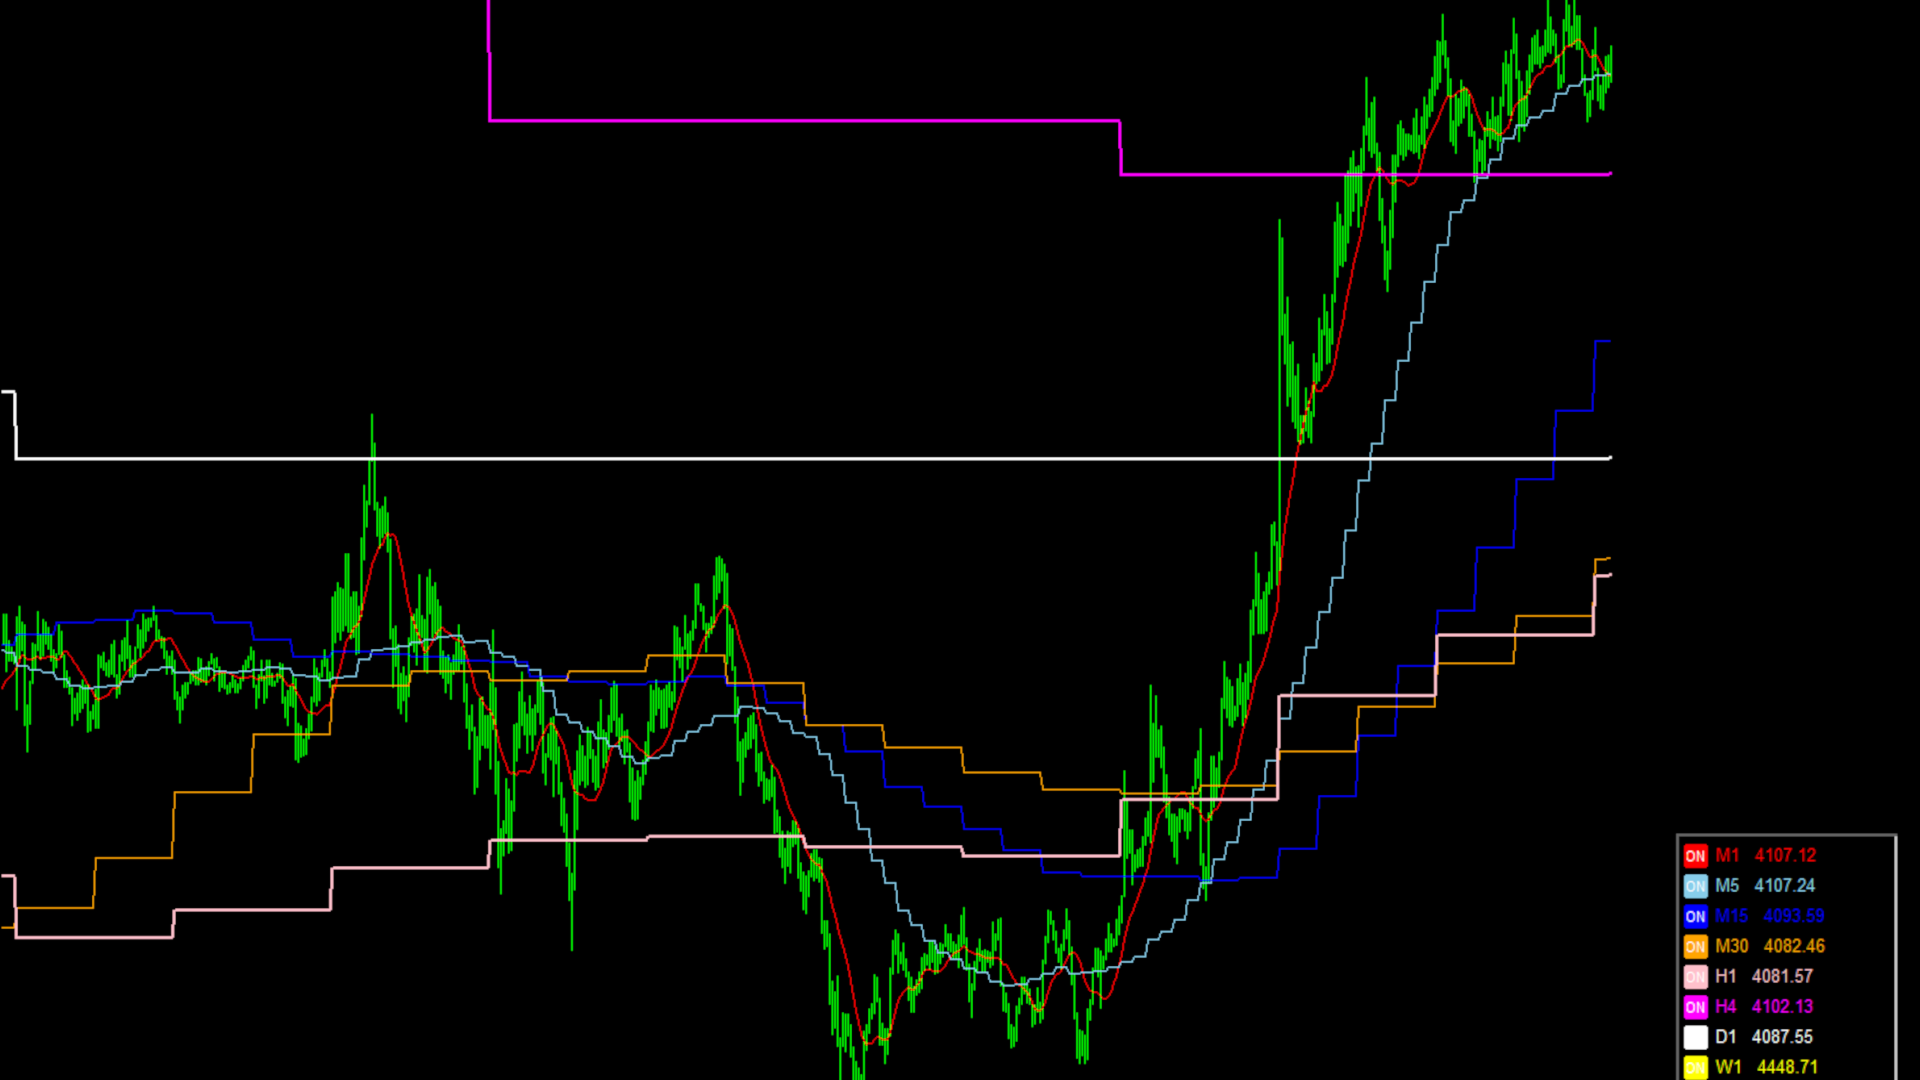
MTF Moving Average Pro plots Moving Averages from up to 8 timeframes simultaneously — from M1 to W1 — directly on your active chart, paired with a clean, fully interactive on-chart dashboard. Instantly see whether the short-term, medium-term, and long-term trend are aligned, without switching charts, opening a second window, or mentally recalculating higher-timeframe values yourself.
Why Multi-Timeframe Analysis Matters
Most experienced traders agree: a trade taken with the higher-timeframe trend has better odds than one taken against it. The problem has always been practical — checking eight different timeframes for one symbol means constantly switching charts, losing your place, and breaking your focus at exactly the moment price is moving.
MTF Moving Average Pro solves this by bringing all eight Moving Averages — M1, M5, M15, M30, H1, H4, D1, and W1 — onto one single chart, each clearly color-coded and individually labeled with its current value in a live dashboard.
Key Features
- 8 Timeframes on One Chart — M1, M5, M15, M30, H1, H4, D1, W1 Moving Averages, all plotted simultaneously.
- Live Interactive Dashboard — a clean on-chart panel showing every timeframe's current MA value, updated in real time.
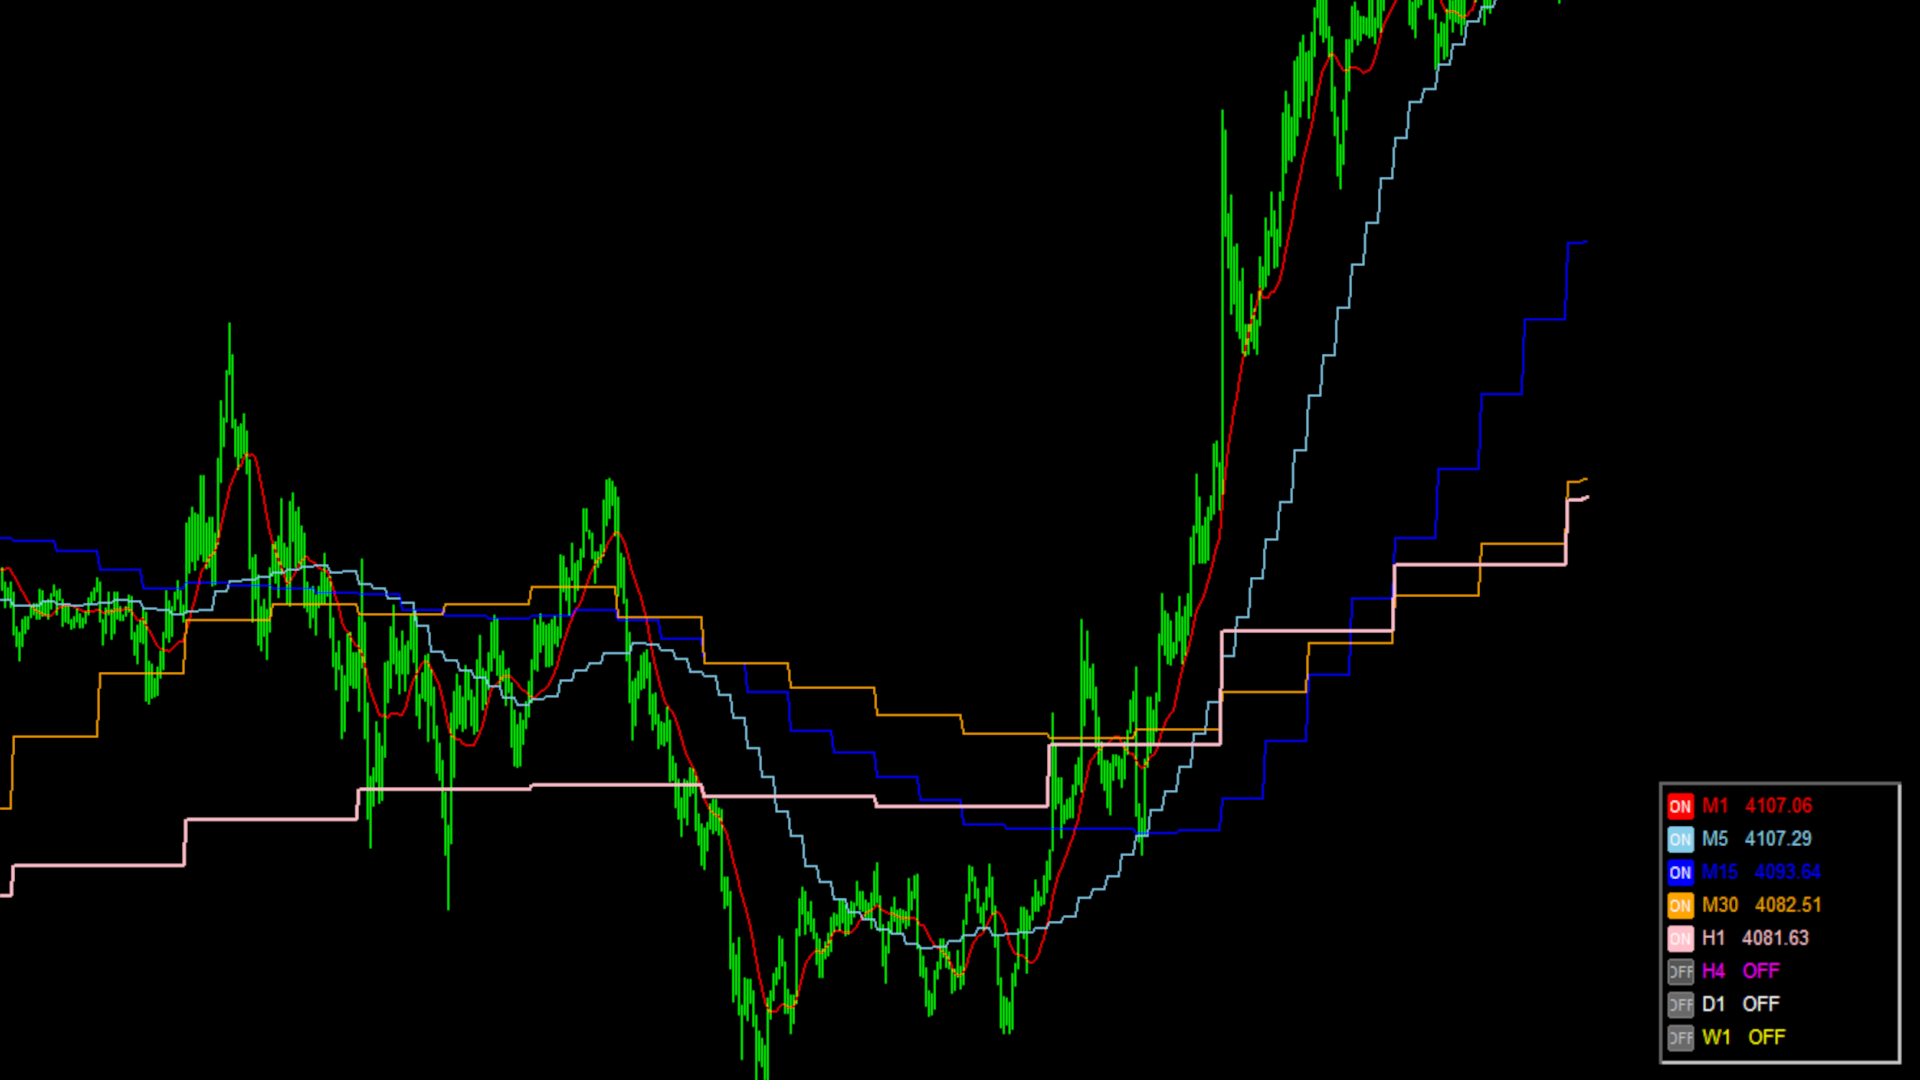
- One-Click ON/OFF Toggles — click to instantly show or hide any line — no need to touch the input settings.
- Fully Customizable Colors — assign a unique color to each timeframe's line.
- Flexible MA Settings — choose your preferred period, method (SMA, EMA, SMMA, LWMA), applied price, and shift.
- Freely Positionable Dashboard — place the dashboard in any of the four chart corners with custom offsets.
- Adjustable Font & Size — make the panel easy to read on any monitor.
- Optimized for Performance — light on CPU even on fast-moving M1 charts.
- Clear Status Feedback — visual indicators for "Loading..." or data issues.
- Works on Any Symbol — Forex, indices, commodities, crypto, or stocks.
Dashboard at a Glance
┌─────────────────────────────┐
│ [ON] M1 1.08452 │
│ [ON] M5 1.08447 │
│ [ON] M15 1.08430 │
│ [OFF] M30 OFF │
│ [ON] H1 1.08390 │
│ [ON] H4 1.08210 │
│ [ON] D1 1.07980 │
│ [OFF] W1 OFF │
└─────────────────────────────┘
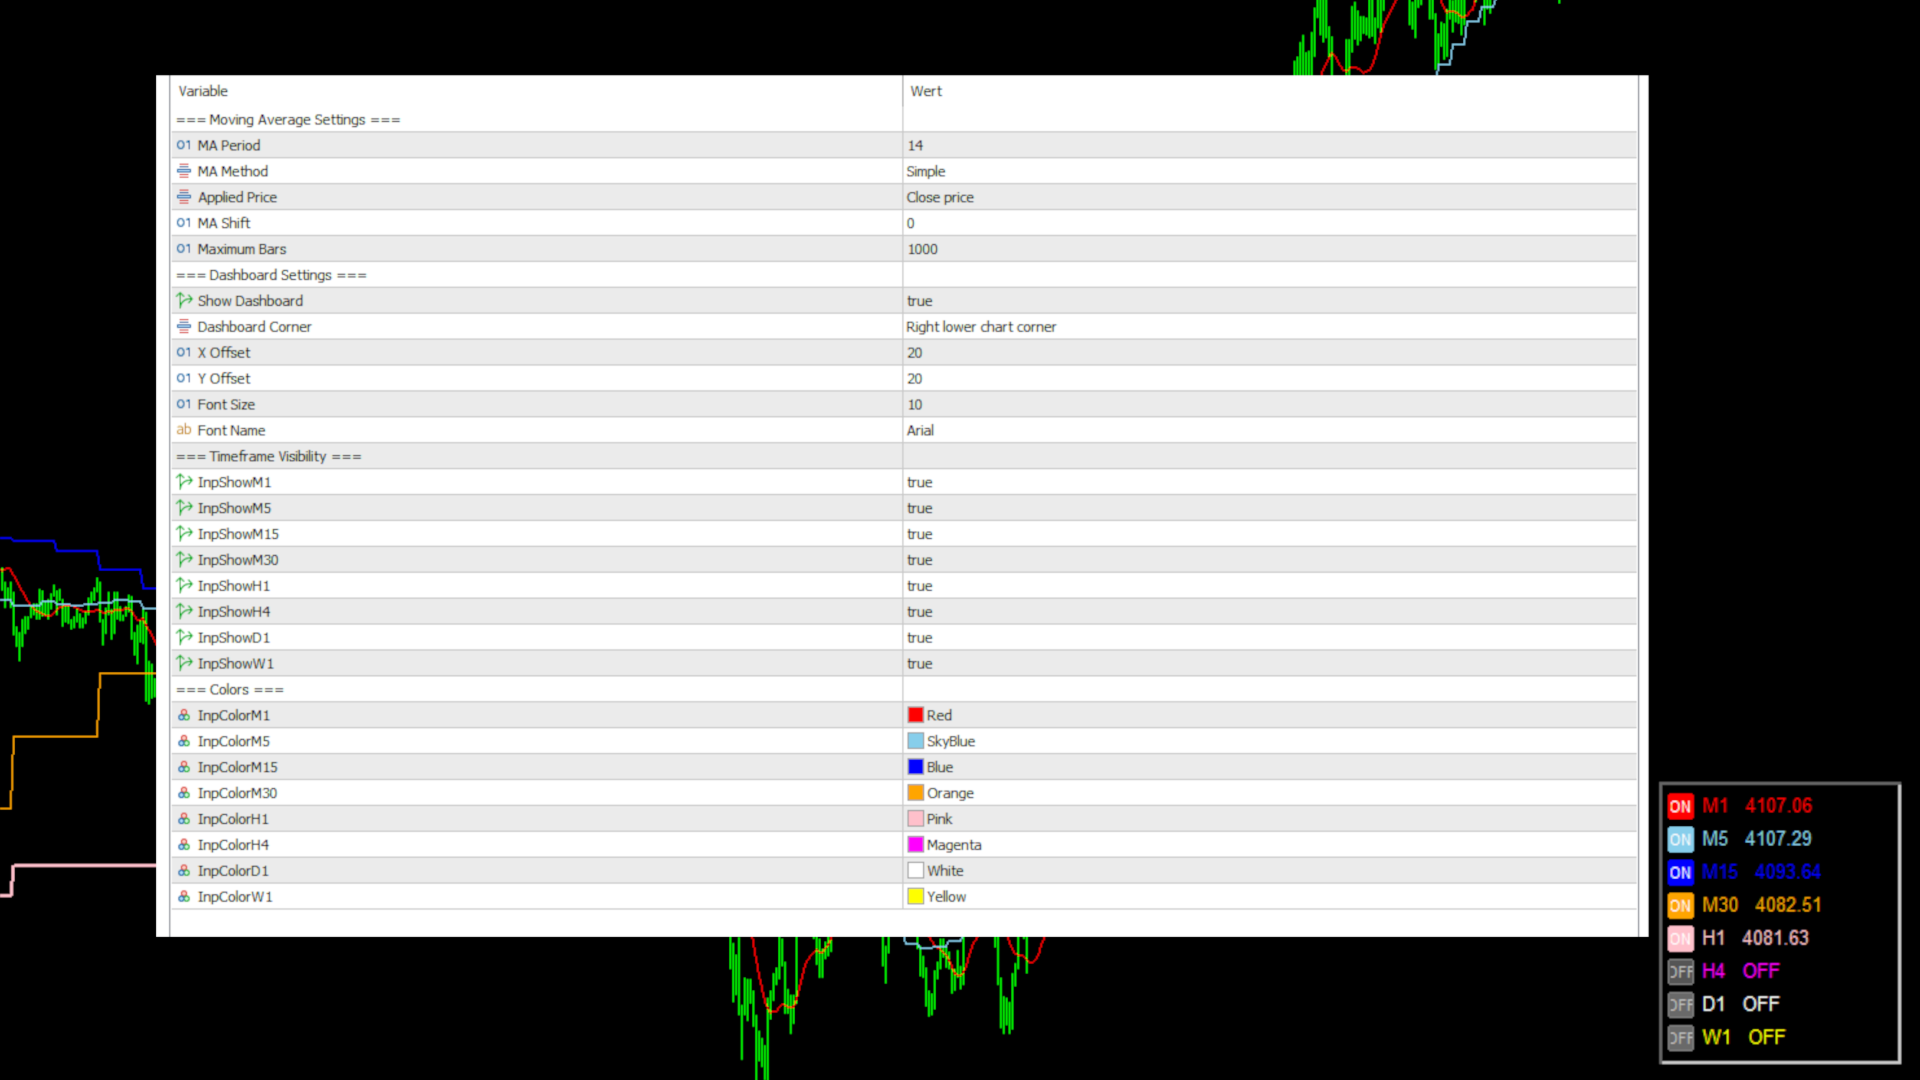
Input Parameters
| Parameter | Description |
|---|---|
| MA Period | Period used for the Moving Average calculation. |
| MA Method | Calculation method: Simple, Exponential, Smoothed, or Linear Weighted. |
| Applied Price | Price used for the calculation (Close, Open, High, Low, etc.). |
| MA Shift | Horizontal shift of the Moving Average, in bars. |
| Show Dashboard | Enable or disable the on-chart dashboard. |
| Dashboard Corner | Choose which chart corner the dashboard is anchored to. |
Who Is This For?
- Scalpers who need instant alignment confirmation.
- Day traders looking for a fast visual trend filter.
- Swing and position traders keeping an eye on H4/D1/W1 trends.
- System developers who want a clean visual reference.
Frequently Asked Questions
Does this repaint?
No. It uses native bar data.
Will it slow down my terminal?
No, it uses an incremental calculation engine to keep CPU usage minimal.
Important Notes
- This is a technical analysis tool. It does not generate trade signals or automated trading decisions.
- Always test on a demo account before live use.
Version History
v3.00
- Rebuilt calculation engine for improved performance.
- Dashboard layout engine reworked for all screen resolutions.
- Added input validation.