Oracle Harmonic Patterns
- Indicators
-
Ilia Makar
 Я Илья Макар — создатель нейробота Oracle Trading, финансовый эксперт, квалифицированный инвестор с 2013 года и практикующий инвестор с 2014 года.
13+ лет на финансовых рынках. $10+ млн в управлении. Обучил более 2140 трейдеров. - Version: 2.1
- Updated: 18 July 2026
- Activations: 20
Oracle Harmonic Patterns automatically detects the full family of Gartley harmonic patterns on any timeframe, equipped with a built-in quality filter. You only see setups that are validated by genuine confluence — not patterns that merely “look similar.”
Manually identifying harmonic patterns is extremely time-consuming: five reversal points, precise Fibonacci ratios, and a Potential Reversal Zone (PRZ) that only becomes meaningful when multiple independent signals converge at the same location. The indicator handles all measurements for you and generates a signal only after the pattern has passed a thorough validation process.
Recognized Patterns
- Gartley (222) — The classic reversal pattern
- Bat — Smaller point B, deeper point D, tighter stop-loss
- Butterfly — Extension beyond the starting point, ideal for reversals at extremes
- Crab — One of the most accurate patterns, featuring extreme Fibonacci extensions
- Shark — Modern 5-point reversal structure
- Cypher — Pattern that completes based on the XC ratio
- Gartley + Diamond — A variation of Gartley with an additional “expansion-contraction” structure between points B and D
Every signal is confirmed by real confluence, not just matching ratios:
- ✅ Support / Resistance — The reversal point must align with a real level that has been tested multiple times
- ✅ Trend Channel — The reversal point must occur at the statistical boundary of a regression channel
- ✅ Fibonacci Stack — Multiple independent Fibonacci projections (not just one) must converge in the same zone — exactly how professional traders validate a PRZ
- ✅ Full Indicator Confluence — ADX, EMA alignment, RSI, MACD, and Bollinger Bands volatility must all align
- ✅ RSI / MACD Divergence Check at the reversal point
- ✅ Volume Decline Check approaching point D (optional, informational)
- ✅ Classic Invalidation Rules (point C must not exceed point A, etc.)
Multi-Timeframe Scanner
The indicator continuously scans M5, M15, M30, H1, H4, D1, and W1 in the background and displays all active harmonic patterns in a single panel — even if the pattern is not visible on your current chart.
On-Chart Educational Tools
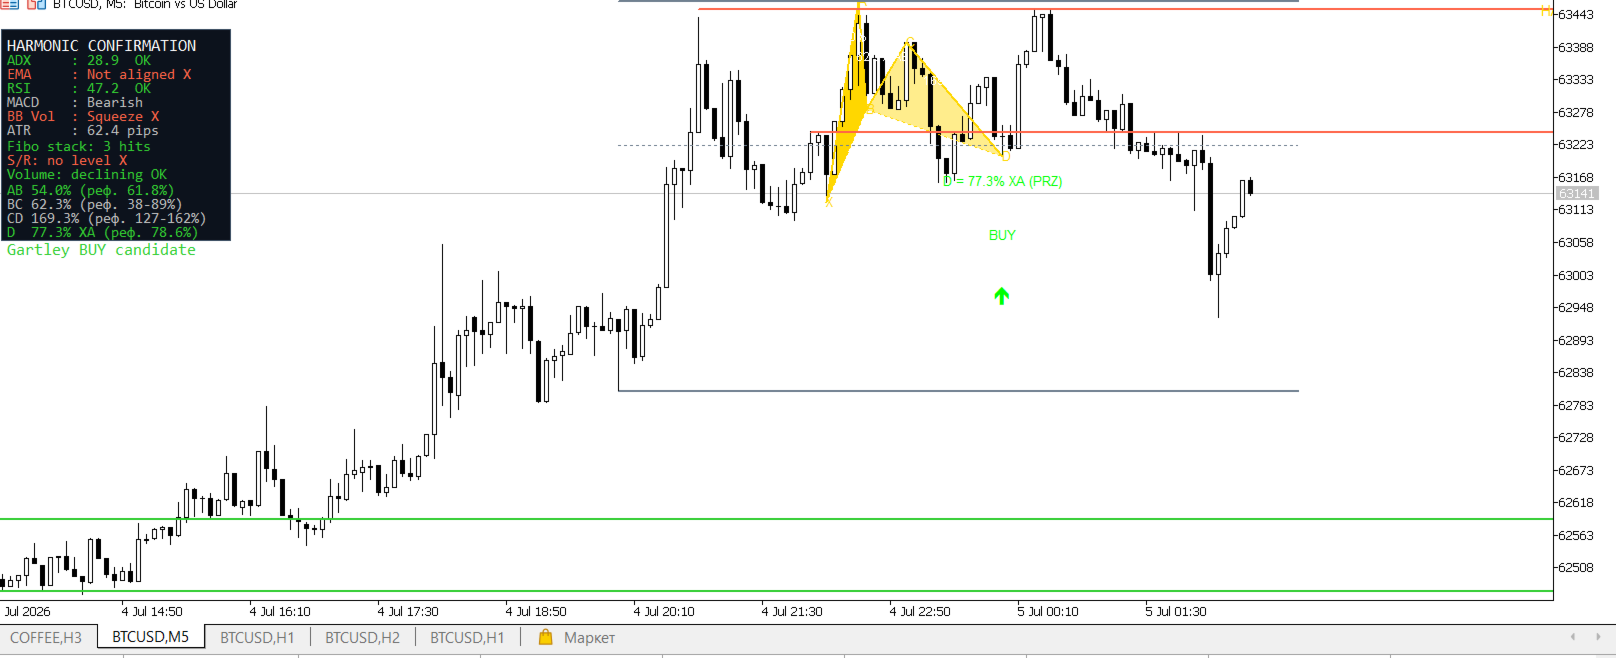
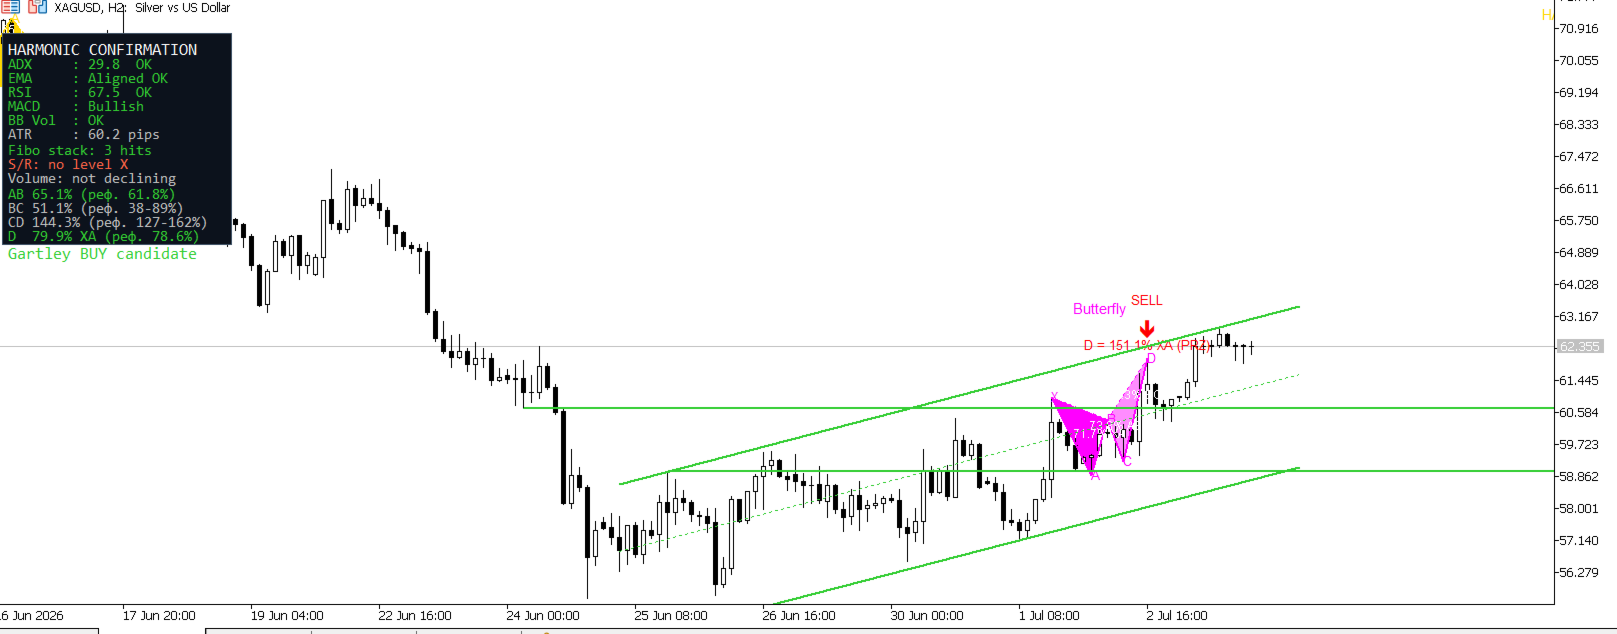
- The complete pattern is drawn with clearly labeled points X-A-B-C-D
- Every leg is marked with the actual measured Fibonacci percentage — instantly showing how closely the pattern matches the ideal model
- A properly anchored Fibonacci grid is drawn directly on the pattern (not decorative — the retracement levels genuinely land on points B and D)
- A live confirmation panel shows exactly which confluence factors are satisfied and which are not
Does Not Trade — By Design
This is an indicator, not an Expert Advisor. It never opens, modifies, or closes trades. It only draws signals and can send alerts (Alert / Push / Sound) so you can execute trades according to your own rules and risk management.
Fully Customizable
Any tolerance on ratios, any confluence requirements, and any pattern type can be enabled or disabled in the settings. Trade only Gartley patterns if you want a focused strategy, or activate the entire family for maximum coverage.
Important Note Harmonic patterns, like any technical analysis tool, do not guarantee future results. This indicator is a tool for analysis and education. Always combine it with your own risk management.