Momentum Switch
- Indicators
- Version: 2.0
- Activations: 5

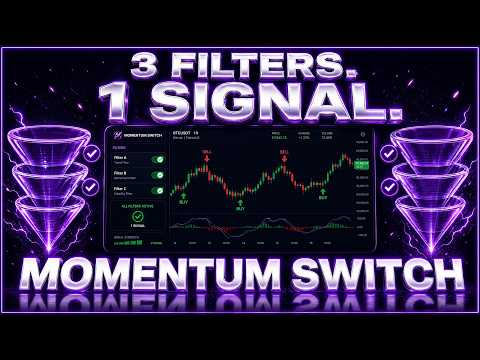
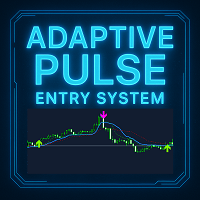
Momentum Switch - is a technical indicator designed to identify potential trend reversal points. The algorithm analyzes price movement dynamics and displays signals as arrows directly on the chart. The indicator uses mathematical smoothing to filter out market noise and provides the user with tools for additional signal confirmation.
The indicator does not repaint its values: signals are formed strictly on bar close.
Key Features
• Multi-level filtering: Three independent filters (A, B, and C) that can be used individually or in combination.
• Information panel: A built-in graphical panel displays signal performance statistics based on historical data. The panel can be moved around the chart and resized.
• Notification system: Support for standard alerts (pop-up windows), push notifications to mobile devices, and email messages.
• Flexible configuration: All key algorithm parameters are adjustable, allowing the indicator to be adapted to different financial instruments and timeframes.
Filter Description
To improve signal quality, the indicator includes three switchable filters:
• Filter A (Price Oscillator): Analyzes current momentum based on the ratio between fast and slow price smoothing.
• Filter B (Multi-Timeframe): Compares the direction of the current signal with the trend on a selected higher timeframe.
• Filter C (Adaptive Smoothing): Uses adaptive smoothing with adjustable sensitivity to assess trend direction.
Note: Enabling all filters simultaneously significantly reduces the total number of signals, leaving only those confirmed by all algorithms.
Information Panel
The panel analyzes a specified number of historical bars and calculates signal statistics based on a volatility measure (ATR). It displays:
• The total number of signals generated.
• The number of signals that reached their calculated target levels.
• Detailed statistics separately for buy and sell signals.
Main Parameters (Inputs)
Core Settings
• Core Period (5–100) — the base period for the main algorithm calculation.
• Volatility Window (7–21) — the period used for volatility calculation (used for arrow offset and panel calculations).
Filter A
• Filter A: Enable — turns Filter A on/off.
• Filter A: Fast Period (2–24) / Filter A: Slow Period (25–100) — the fast and slow periods for Filter A.
Filter B
• Filter B: Enable — turns Filter B on/off.
• Filter B: Timeframe — selection of the higher timeframe (recommended to choose a timeframe 4–8 times higher than the current one).
• Filter B: Period (5–100) — the calculation period for the higher timeframe.
Filter C
• Filter C: Enable — turns Filter C on/off.
• Filter C: Period (10–100) — the smoothing period.
• Filter C: Sensitivity (0.1–1.0) — the filter's sensitivity coefficient.
Arrow Settings
• Arrow Size (1–5) — the size of signal arrows on the chart.
Stats Panel
• Show Stats Panel — displays the information panel on the chart.
• Lookback Bars (100–10000) — the number of historical bars used for statistics analysis.
• Panel Font Size (10–25) — the font size of the text on the panel.
Usage Recommendations
1. Before using the indicator, it is recommended to test it on historical data of the selected instrument.
2. It is convenient to adjust parameters in the Strategy Tester's visual mode, evaluating changes in the statistics shown on the information panel.
3. When testing in visual mode, statistics at early stages may differ from the final result, since the panel only analyzes data available at the current point of the simulation.
Risk Disclaimer
Trading Forex and CFDs involves a high level of risk and may not be suitable for all investors. Past performance is not indicative of future results. This indicator is a supplementary analytical tool and does not guarantee profitable trading outcomes. Thorough testing is recommended before use on a live account. The author is not responsible for any financial losses arising from the use of this product.