Multidimensional Golden Pattern Indicator
- Indicators
- Version: 124.1
- Updated: 13 May 2026

Product Name: Golden Pattern Panel
Description:
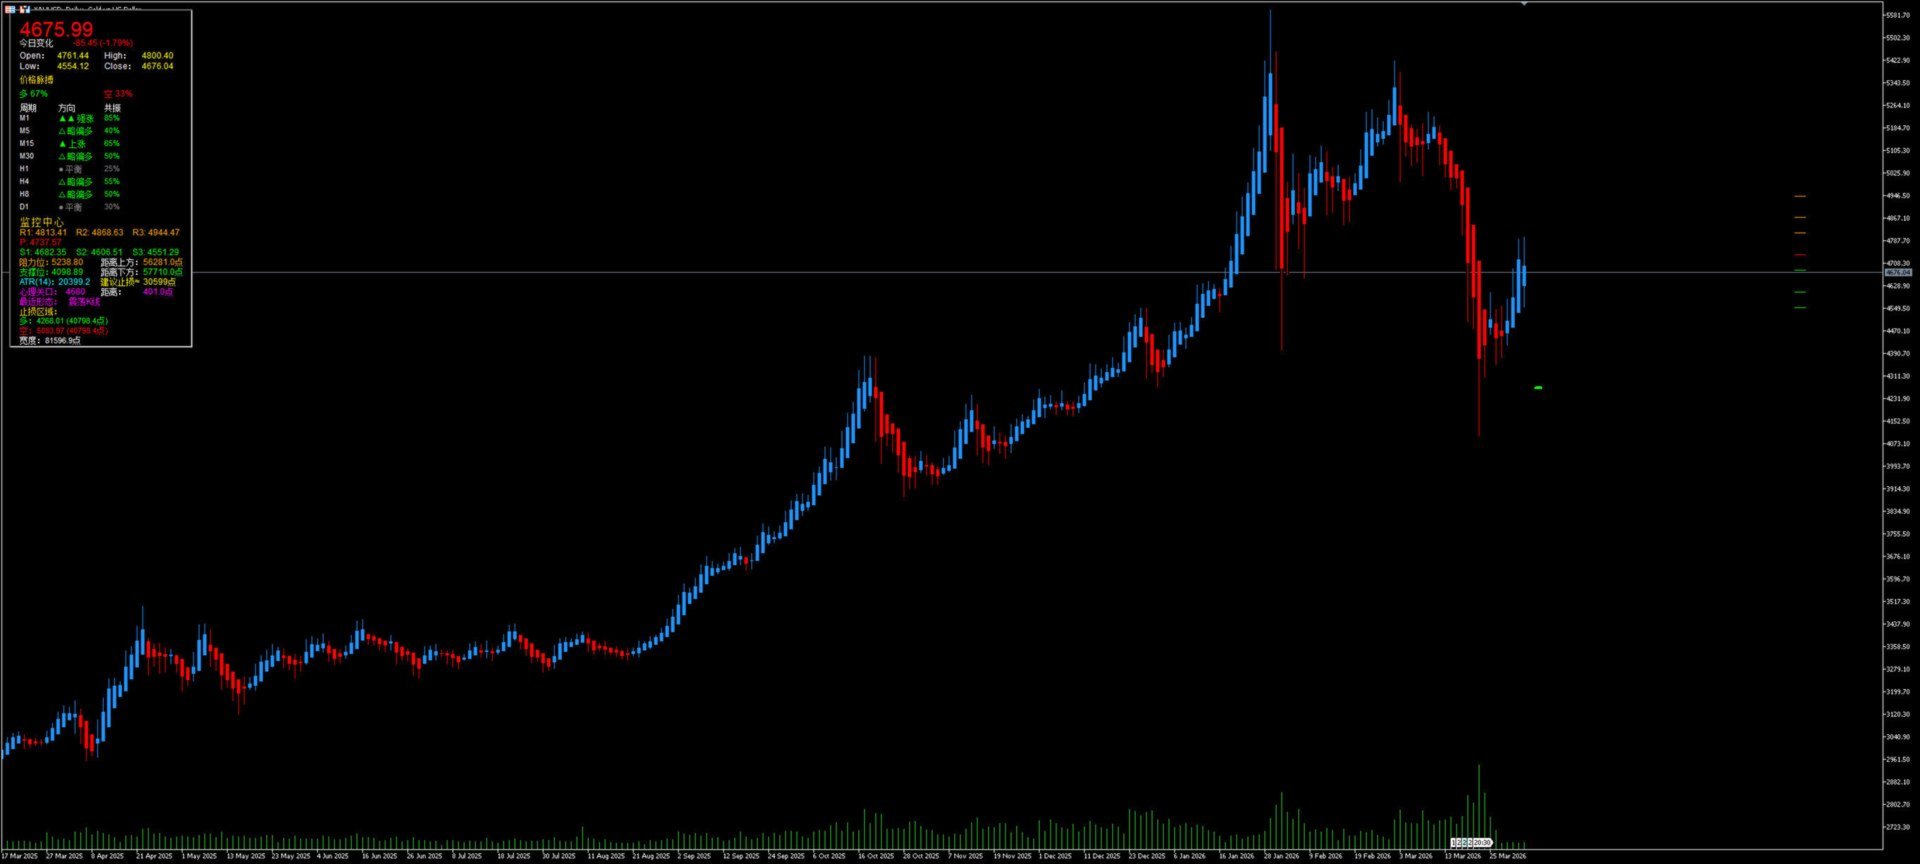
Golden Pattern Panel is a multi‑information display tool that shows trend strength across multiple timeframes, dynamic support/resistance levels, candlestick pattern recognition results, and market sentiment data in a compact interface.
Key Features:
-
Trend Strength Meter
Combines EMA20 and RSI to generate a 0–100% trend intensity value for each of six timeframes (M1, M5, M15, M30, H1, H4). An aggregated energy bar summarizes the overall directional bias. -
Dynamic Pivot System
Calculates pivot point (P) and support/resistance levels (S1–S3, R1–R3) based on historical high, low, and close prices. Displays horizontal segments on the right side of the chart with an adjustable offset, indicating potential price boundaries. -
Candlestick Pattern Scanner
Identifies common patterns (Doji, Hammer, Engulfing, Large Body) on the latest bars. Results are color‑coded (cool for bearish, warm for bullish) to help detect potential reversal signals. -
Sentiment Matrix
Uses ATR volatility and the distance from the current price to the nearest round number to generate a market sentiment heat map, and suggests a dynamic stop‑loss threshold based on ATR. -
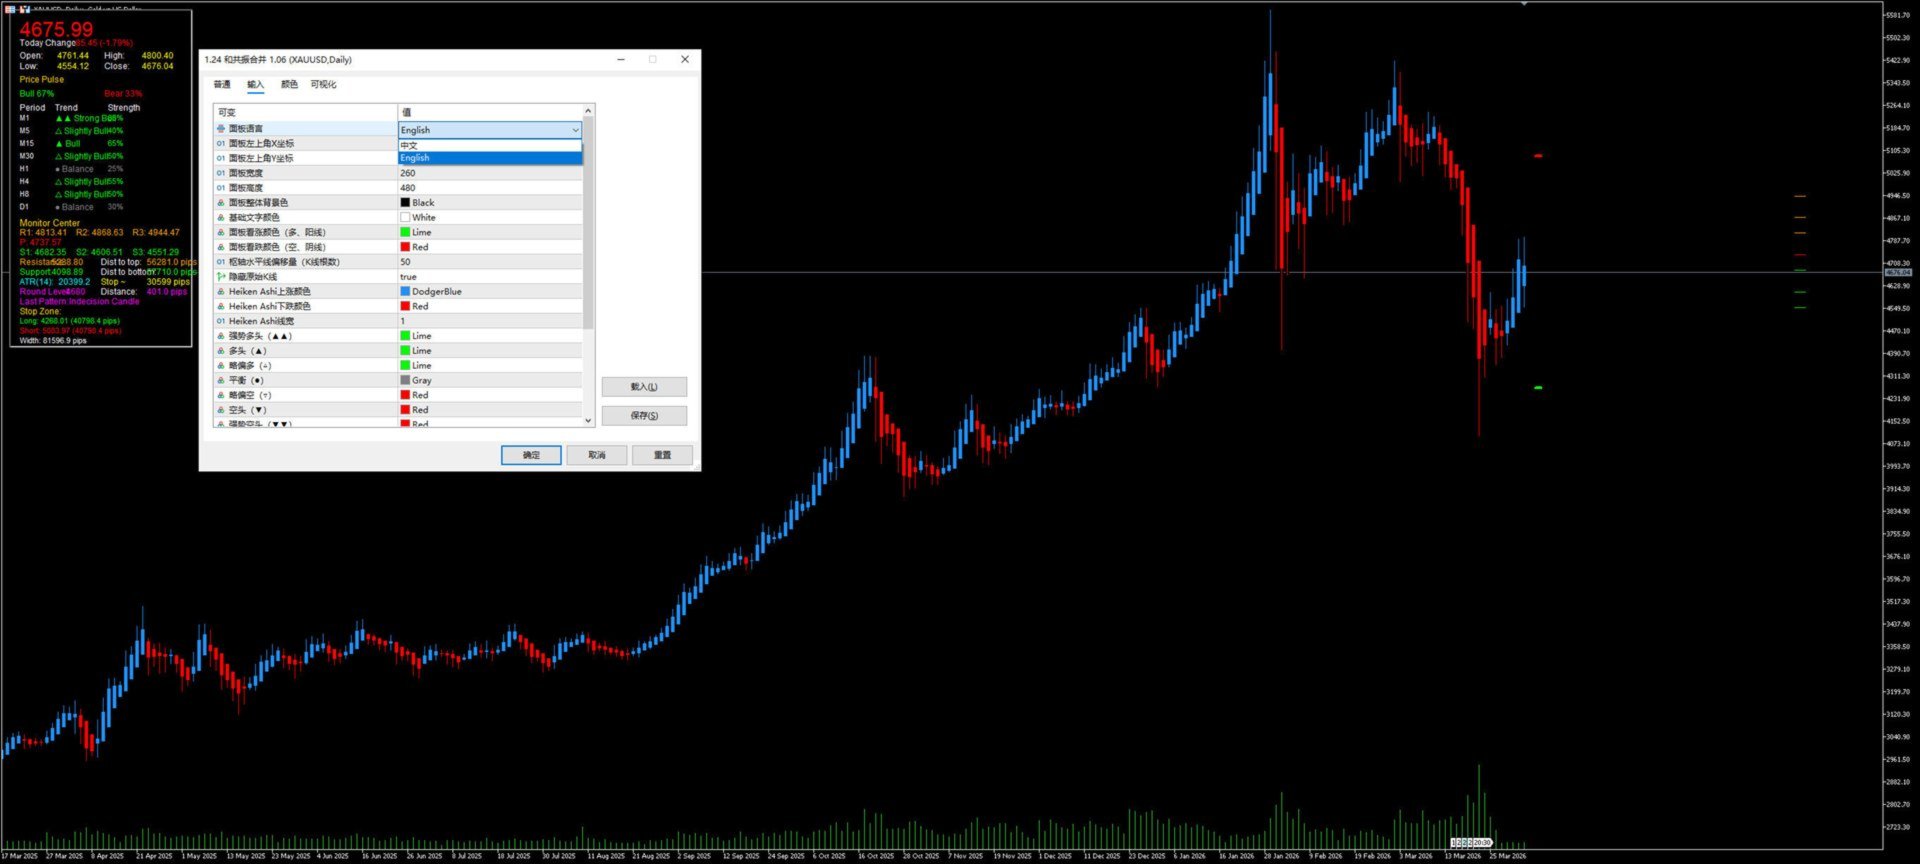
User Interface
Drag the panel anywhere on the chart with <1ms response latency. Adapts to different screen resolutions. Background, text, colors, and sizes are fully customizable.
Note: This tool provides analytical data only and does not constitute trading advice. Past performance does not guarantee future results.