ProTrade Multi Timeframe Dashboard
- Indicators
- Version: 1.0

ProTrade Multi-Timeframe Dashboard
Product Overview
ProTrade Multi-Timeframe Dashboard is a professional technical analysis indicator for MetaTrader 5 that provides instant, at-a-glance trend analysis across four key timeframes (M15, H1, H4, D1). By displaying RSI, MACD histogram, and Moving Average alignment for each timeframe in a clean, color-coded dashboard, this indicator helps traders identify high-probability trend continuations and potential reversal zones through multi-timeframe confluence—without switching charts or manually calculating alignments.
This indicator is designed for trend-following traders, swing traders, and anyone who wants to confirm trade direction across multiple timeframes before entering positions, while receiving timely alerts when strong timeframe alignment occurs.
Key Features
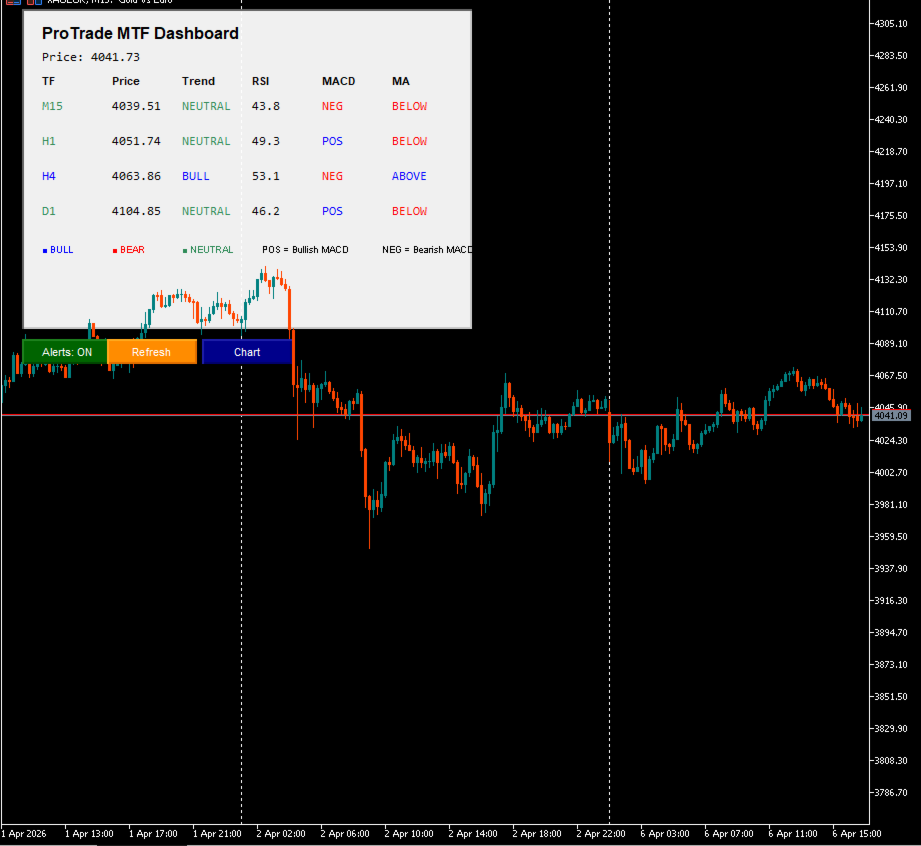
Four-Timeframe Trend Overview
- Simultaneously displays analysis for M15, H1, H4, and D1 timeframes on a single chart
- Each timeframe shows: current price, trend direction (BULL/BEAR/NEUTRAL), RSI value, MACD histogram polarity, and price position relative to Moving Average
- Color-coded cells provide instant visual recognition of bullish (blue), bearish (red), or neutral (sea green) conditions
- Configurable refresh interval ensures data stays current without excessive resource usage
Multi-Indicator Confluence Analysis
- RSI (Relative Strength Index): Shows momentum with overbought/oversold color coding (>70 bearish, <30 bullish)
- MACD Histogram: Displays momentum direction as POS (positive/bullish) or NEG (negative/bearish)
- Moving Average Alignment: Indicates whether price is trading ABOVE or BELOW the configurable MA
- Trend determination combines price vs. MA position with price momentum for robust signal confirmation
Smart Alignment Alerts
- Automatically detects when 3 or 4 timeframes align in the same directional bias
- Sends platform alerts for BULLISH ALIGNMENT or BEARISH ALIGNMENT when confluence threshold is met
- Configurable alert cooldown prevents notification spam during extended aligned periods
- One-click toggle to enable/disable alerts without reconfiguring the indicator
Professional Dashboard Design
- Clean, organized layout with clear headers: TF, Price, Trend, RSI, MACD, MA
- Legend section explains color coding and indicator interpretations
- Current price display at the top for quick reference
- Fully customizable colors for dashboard background, text, and trend indicators
Chart Integration & Controls
- One-click buttons: Alerts Toggle (ON/OFF), Refresh (force update), Chart (apply visual settings)
- Auto-apply chart settings option ensures consistent workspace appearance on initialization
- Non-intrusive design: indicator runs in background without plotting on price chart
- Efficient resource management: indicator handles released properly on deinitialization
How To Use
Step 1: Attach the indicator to any chart in MetaTrader 5. The dashboard will appear automatically, displaying real-time data for M15, H1, H4, and D1 timeframes.
Step 2: Configure indicator parameters. Adjust RSI period, MACD settings (fast/slow/signal), and Moving Average period/method to match your preferred analysis style.
Step 3: Set dashboard preferences. Customize colors for bullish/bearish/neutral states, dashboard background, and text to match your visual preferences.
Step 4: Configure alert settings. Enable EnableAlerts to receive notifications when 3+ timeframes align. Adjust RefreshSeconds to control update frequency.
Step 5: Monitor confluence. Use the dashboard to identify timeframes where RSI, MACD, and MA all confirm the same directional bias. Strongest signals occur when all four timeframes align.
Step 6: Trade with confirmation. Use multi-timeframe alignment as a filter for entries: only take long trades when multiple timeframes show BULL, or short trades when multiple show BEAR.
Step 7: Manage alerts. Use the Alerts button to toggle notifications on/off. Use Refresh to force an immediate data update. Use Chart to apply your visual settings instantly.
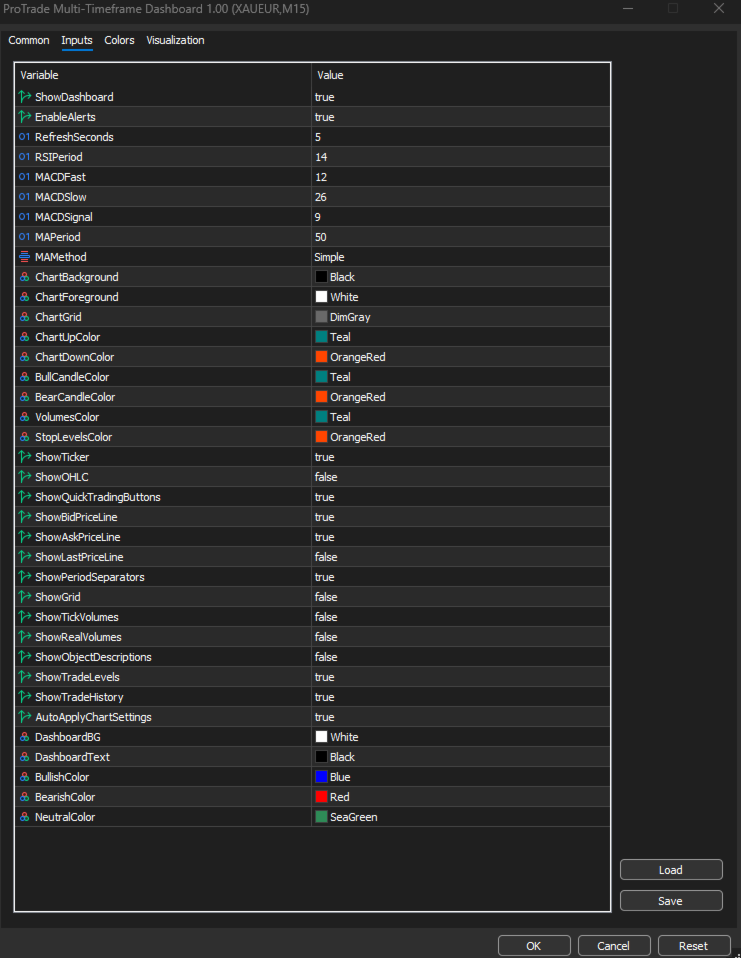
Input Parameters
Dashboard Settings
- ShowDashboard: Enable or disable the on-chart dashboard display
- EnableAlerts: Enable or disable alignment alert functionality
- RefreshSeconds: Interval (in seconds) for automatic dashboard data refresh
Indicator Settings
- RSIPeriod: Period for Relative Strength Index calculation (default: 14)
- MACDFast / MACDSlow / MACDSignal: Parameters for MACD indicator (default: 12/26/9)
- MAPeriod: Period for Moving Average calculation (default: 50)
- MAMethod: Type of Moving Average (SMA, EMA, SMMA, LWMA)
Chart Appearance Parameters
- ChartBackground, ChartForeground, ChartGrid: Colors for chart background, text, and grid
- ChartUpColor, ChartDownColor: Colors for upward/downward price elements
- BullCandleColor, BearCandleColor: Colors for bullish/bearish candles
- VolumesColor: Color for volume histogram
- StopLevelsColor: Color for stop level indicators
Chart Display Options
- ShowTicker, ShowOHLC, ShowGrid: Toggle display of ticker, OHLC values, and grid
- ShowBidPriceLine, ShowAskPriceLine, ShowLastPriceLine: Toggle price line visibility
- ShowPeriodSeparators, ShowTradeLevels, ShowTradeHistory: Toggle additional chart elements
- ShowTickVolumes, ShowRealVolumes: Toggle volume display type
- AutoApplyChartSettings: Apply chart settings automatically on initialization
Dashboard Color Settings
- DashboardBG, DashboardText: Colors for dashboard background and text
- BullishColor: Color for bullish indicators and aligned states (default: blue)
- BearishColor: Color for bearish indicators and aligned states (default: red)
- NeutralColor: Color for neutral/indeterminate states (default: sea green)
Important Information
Confluence Analysis Tool This indicator identifies trend alignment across multiple timeframes using RSI, MACD, and Moving Average confluence. It does not generate standalone buy/sell signals. Multi-timeframe alignment should be used as a confirmation filter within a broader trading strategy, not as a sole entry trigger.
Indicator Interpretation
- Trend (BULL/BEAR/NEUTRAL): Determined by price position relative to MA combined with price momentum (current close vs. previous close)
- RSI: Values >70 suggest overbought (bearish bias), <30 suggest oversold (bullish bias), color-coded accordingly
- MACD: POS = histogram positive (bullish momentum), NEG = histogram negative (bearish momentum)
- MA: ABOVE = price trading above moving average (bullish structure), BELOW = price below MA (bearish structure)
Alert Configuration Alignment alerts trigger when 3 or 4 of the 4 monitored timeframes show the same directional bias. Alerts include the symbol name and number of aligned timeframes (e.g., "BULLISH ALIGNMENT on EURUSD (3/4 TFs)"). Ensure your MetaTrader terminal is configured for alerts if you wish to receive notifications.
No Profit Promise This indicator is a technical analysis and confluence identification tool. It does not guarantee profits or improved trading performance. Trading foreign exchange and CFDs carries a high level of risk and may not be suitable for all investors. Past performance is not indicative of future results.
Performance Considerations The indicator creates indicator handles for RSI, MACD, and MA across four timeframes. While optimized for efficiency, using very short refresh intervals on lower-spec systems may increase resource usage. Adjust RefreshSeconds based on your system capabilities.
Testing Recommendation Always test this indicator on a demo account before using in live trading. Verify that timeframe data, indicator calculations, trend determination, and alerts function as expected on your preferred symbols. Forward-test across various market conditions before integrating into your live workflow.
Compatibility Designed exclusively for MetaTrader 5. Not compatible with MetaTrader 4. Requires a broker feed with reliable price data across multiple timeframes for accurate confluence analysis.
Data and Logging All dashboard updates and alert triggers are logged in the MetaTrader Experts tab. Users should review logs to confirm the indicator is functioning as configured. The indicator does not store or transmit personal trading data externally.
Chart Customization Note Price line colors (Bid, Ask, Last) are controlled by MetaTrader terminal settings, not by this indicator. Users must set these colors manually in Tools → Options → Charts if they wish to customize line colors. This indicator controls line visibility only.
System Requirements
- MetaTrader 5 build 2244 or higher
- Windows 7 or later operating system
- Stable price feed with adequate data across M15, H1, H4, and D1 timeframes
- Sufficient system resources for maintaining multiple indicator handles across timeframes
Support
For questions regarding functionality, settings, or usage, please refer to the information printed in the Experts tab when the indicator initializes. Additional documentation is available in this product description.
Final Notes
ProTrade Multi-Timeframe Dashboard is designed to assist disciplined traders with systematic multi-timeframe trend confirmation and timely alerts for strong confluence setups. It is not a substitute for trading knowledge, market analysis, or sound risk management principles. Users should ensure they understand indicator interpretations and all dashboard features before relying on it for trading decisions.
This indicator does not provide financial advice, trading signals, or market predictions. All trading decisions remain the sole responsibility of the user. Always trade responsibly and within your risk tolerance. Use multi-timeframe confluence as part of a comprehensive trading approach, not in isolation.