HotZone

🔥 HotZone

Visualize Where Price Wants to Go.
  1. "Why does price keep bouncing at this level?"
  2. "Why does it always consolidate in this zone?"
  3. "Where is the next support or resistance?"
If you've ever stared at a chart asking these questions, the answer often lies in Price Density.
Price zones where market participants repeatedly buy and sell naturally accumulate "density."
HotZone is an MT5-exclusive Price Density Analysis Indicator that visualizes this density in real time.

MT5 OnlyM1 to MNCustom Indicator

⚠️ HotZone is a custom indicator for MT5. It is NOT an Expert Advisor (EA) and does not trade automatically.

Who is this for?

✅ Perfect For Traders Who...

  • Draw support & resistance "by feel" and want more precision
  • Need to quickly identify key price zones for day trading
  • Want to track weekly/monthly key zones for swing trading
  • Need to instantly check how price relates to their MAs
  • Want a clean chart without sacrificing information density
  • Want to eliminate the tedious manual work of multi-TF analysis

Section 01

Product Overview

What Is HotZone?

HotZone is a custom indicator exclusively for MetaTrader 5 (MT5).

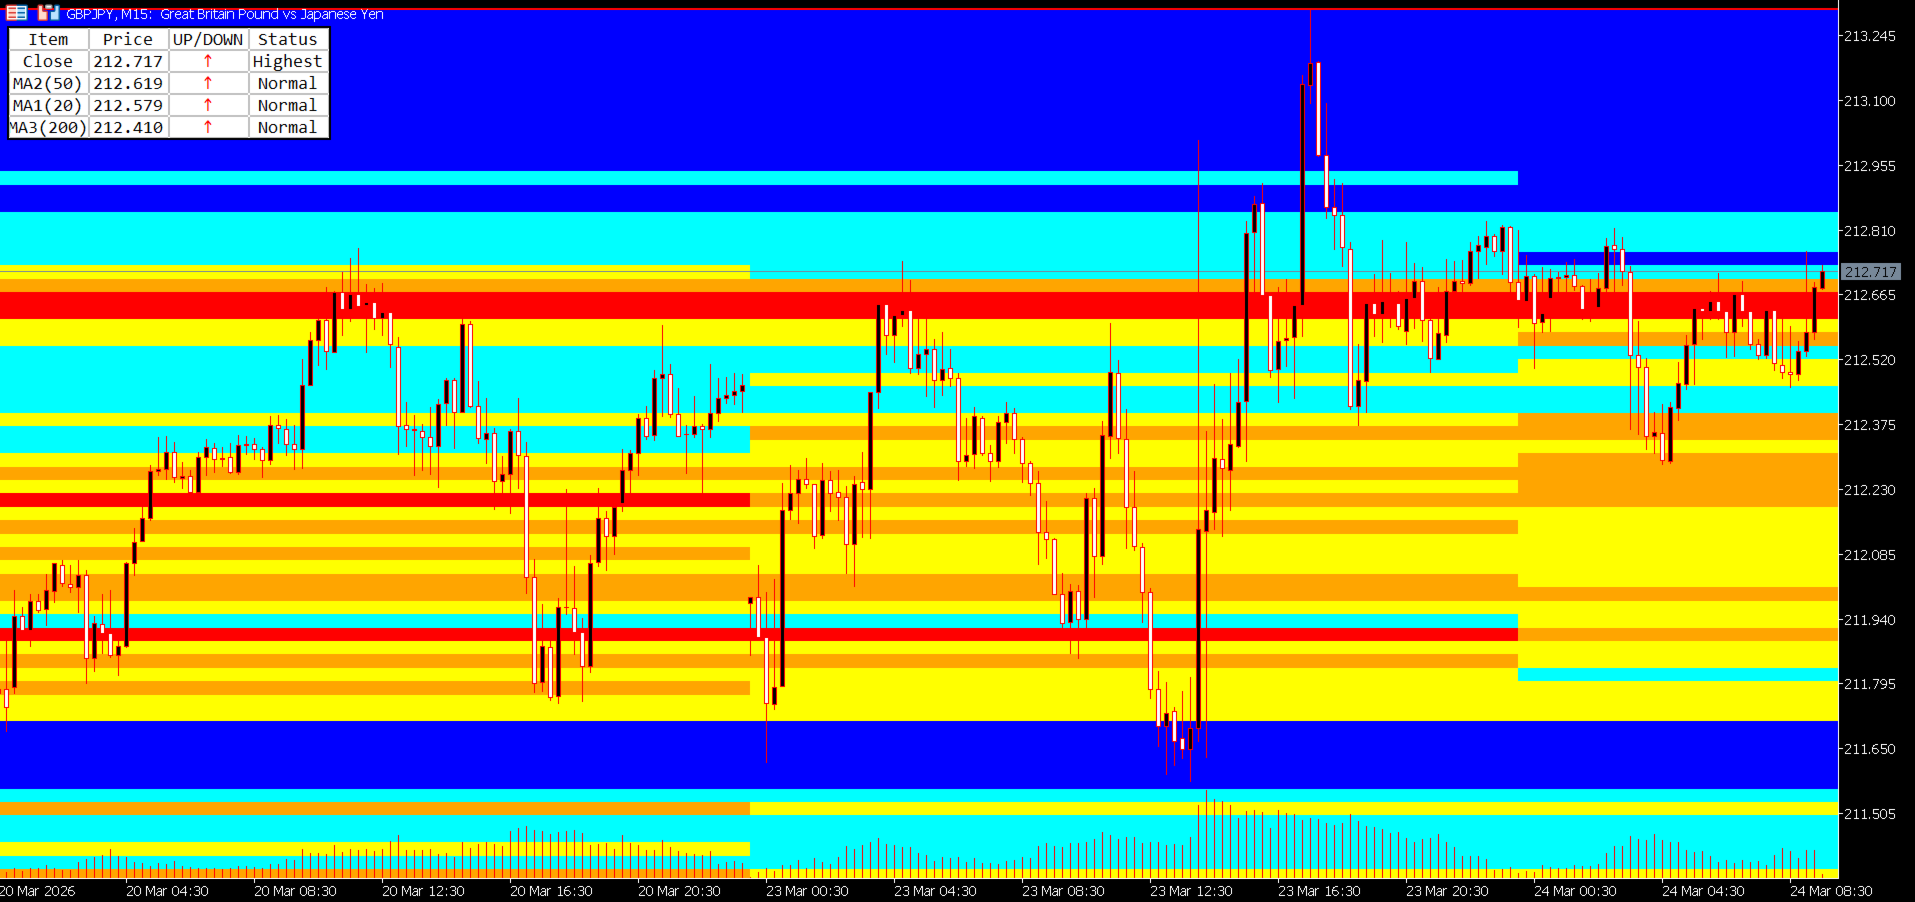
It goes far beyond simple lines or oscillators. HotZone analyzes historical price data — counting how many times price visited each price band — and visualizes that density as a color heatmap directly on your chart.

What Is Price Density Analysis?

Price density analysis is a quantitative method of evaluating how frequently price visited a given price band within a specific time period.

|

| Density Level | Meaning | Chart Behavior

| High Density (Hot Zone) | A zone where many traders have historically bought and sold | Likely to act as strong support or resistance in the future

| Low Density (Cold Zone) | A zone where very little trading activity occurred | Price tends to pass through smoothly — breakouts are more likely

This concept is well-established as the Value Area and Congestion Zone analysis used by professional traders and institutional investors. HotZone automates and visualizes this analysis directly on your MT5 chart.

Problems HotZone Solves

|

| Common Pain Point | HotZone's Solution

| Hard to identify reliable support/resistance | Density heatmap instantly shows price concentration zones

| Multi-TF analysis is time-consuming | All TFs from M1 to MN switch and display automatically

| Confusing MA relationships at a glance | MA Table ranks price and MAs in order at all times

| Charts become cluttered with too many tools | Clean heatmap visualization keeps charts readable

| Drawing high/low lines manually is tedious | High and low lines are drawn automatically per period block

Section 02

Features & Strengths

🔬

Quantitative & Objective Analysis

Instead of "gut-feel" support/resistance, HotZone uses numerical price density data. Two traders looking at the same chart will reach the same conclusions.

🕐

Optimized for Every Timeframe

From M1 to MN, each timeframe has its own optimized period block for density calculation. Just switch TFs — the density map adapts automatically.

📊

Information-Rich Yet Clean

The combination of heatmap + MA Table gives you everything you need while keeping the chart uncluttered. No need to stack multiple indicators.

High-Performance Design

The MaxPeriods limit keeps rendering fast. All parameters switch automatically on TF change — no manual reconfiguration needed.

🎨

Fully Customizable

Color scheme, band width, analysis depth, MA type, and table size — everything is adjustable. Works on both dark and light chart themes.

Section 03

Key Features

■ Feature 1: 5-Level Color Price Density Heatmap

The core of HotZone. For each period block, it analyzes price data and counts how many times price (close) visited each pip-width band. That density is then displayed as a 5-level color heatmap.

Level 5 (Red)Highest density zone — 80% or more of peak density

Level 4 (Orange)High density zone — 60–79%

Level 3 (Yellow)Medium density zone — 40–59%

Level 2 (Aqua)Low density zone — 20–39%

Level 1 (Blue)Lowest density zone — below 20%

All colors are fully customizable to match your chart style.


■ Feature 2: Multi-Timeframe Support with Auto Period Blocks

HotZone supports all timeframes from M1 to MN (Monthly). Simply change the timeframe and the optimal period blocks are automatically configured.

|

| Timeframe | Period Block Boundary | Density Unit

| M1 (1-minute) | Every 2 hours | 2-hour block density

| M5 (5-minute) | Every 12 hours (00:00 / 12:00) | Half-day block density

| M15 (15-minute) | Daily (00:00) | Daily block density

| M30 (30-minute) | Half-week (Mon 00:00 / Wed 12:00) | Half-week block density

| H1 (1-hour) | Weekly (from Monday) | Weekly block density

| H4 (4-hour) | Half-month (1st / 16th) | Half-month block density

| D1 (Daily) | Every 6 months (Jan / Jul) | Semi-annual block density

| W1 (Weekly) | Annually (January) | Annual block density

| MN (Monthly) | Annually (January) | Annual block density


■ Feature 3: Automatic High/Low Line Drawing

HotZone automatically draws High and Low lines for each period block, marking the highest and lowest price reached within that block. These lines serve as dynamic support/resistance references. Colors are customizable, and lines update automatically at each period boundary.


■ Feature 4: Band Grid Lines (Optional)

Set IsDrawBandLine = true to display the underlying band grid used for density calculation directly on the chart.

|

| Timeframe | Default Band Width

| M1 | 1 pip

| M5 | 2 pips

| M15 | 3 pips

| M30 | 5 pips

| H1 | 10 pips

| H4 | 25 pips

| D1 | 50 pips

| W1 | 100 pips

| MN | 250 pips


■ Feature 5: MA Table (Moving Average Analysis Table)

A compact table in the top-left of your chart displays the current price alongside 3 moving averages, sorted by price in real time.

|

| Item | Price | Direction | Status

| Close | Current price | ↑↓ | Normal / Highest / Lowest

| MA1 (20) | MA1 value | ↑↓ | Normal / Highest / Lowest

| MA2 (50) | MA2 value | ↑↓ | Normal / Highest / Lowest

| MA3 (200) | MA3 value | ↑↓ | Normal / Highest / Lowest

↑ (red): price rose from previous bar  /  ↓ (blue): price fell  /  - (black): unchanged

Highest: highest value within the lookback period  /  Lowest: lowest value  /  Normal: standard


■ Additional Smart Features

Auto Timeframe Switching: All parameters auto-adjust when you change the TF — no manual reconfiguration needed

DPI Scaling Support: The MA Table renders correctly on high-resolution and 4K displays

Performance Optimization: MaxPeriods limits rendering to only the range you need

Universal Symbol Support: Works with any MT5 symbol — FX pairs, Gold, Oil, Indices, and more


Section 04

How to Use HotZone in Your Trading

▶ Day Traders

Recommended Timeframes: M1, M5, M15

Example scenario: Trading USD/JPY during the Tokyo session on M5

  • Review the previous day's M5 heatmap → Identify the red and orange zones from yesterday's morning (00:00–12:00) and afternoon (12:00–24:00) blocks
  • At the Tokyo open (09:00), check current price position → Is price near yesterday's high-density zone (red)?
  • Price approaches a red zone → Consider a mean-reversion entry anticipating a bounce
  • Confirm MA20 direction in the MA Table → ↑ favors long, ↓ favors short
  • Target the next high-density zone as take profit → Use the distance between red zones as your TP guideline

💡 M1/M5 heatmaps use 2-hour and half-day blocks, making it easy to pinpoint hot zones within the current session. Effective for scalpers too.

▶ Swing Traders

Recommended Timeframes: H1, H4, D1

Example scenario: Swing trading EUR/USD on the H4 chart

  • Switch to D1 → Identify the red zones (highest density) from the last 6-month block — these are your key medium-term support/resistance candidates
  • Switch to H4 → Check if the half-month block's red zones overlap with D1 zones (confluence check)
  • Confirm MA50 and MA200 positions in the MA Table → Use the price-vs-MA arrangement to determine medium-term trend direction
  • Use H1 to time your entry → Check the weekly block heatmap on Monday to identify the week's key zones
  • Set stop-loss just below the auto-drawn Low Line of the most recent period block

💡 Overlapping D1 (6-month blocks) and H4 (half-month blocks) makes it easy to spot multi-timeframe confluence zones with high conviction.

▶ Professional Traders

Recommended Approach: Multi-TF confluence analysis

Professional traders focus on "confluence zones" — areas where density is high across multiple timeframes simultaneously.

  • W1 heatmap: Identify annual-level key zones (red) → establish the long-term value area baseline
  • D1 heatmap: Confirm whether those zones are also high-density in the 6-month block → validate with medium-term data
  • H4 heatmap: Check if the same zone is still high-density in the half-month block → confirm short-term market interest
  • H1 heatmap: Confirm weekly block density → narrow down your entry window
  • MA Table: Review the arrangement of Close, MA20, MA50, MA200 → gauge trend strength and direction
  • A zone where 2–3 TFs show high density → Maximum Confluence Zone → Highest-confidence entry point

【Long Setup Example】✓ Price approaches the lower edge of W1 red zone✓ D1 red / orange zone also present at the same level✓ MA Table: MA200 < MA50 < MA20 < Close (bullish alignment)✓ MA Table: MA20 direction arrow = ↑ (rising)→ Strong support confluence → Long entry candidate【Short Setup Example】✓ Price approaches the upper edge of H4 red zone✓ D1 red zone also aligns at the same level✓ MA Table: Close < MA20 < MA50 (bearish alignment)✓ MA Table: MA20 direction arrow just flipped to ↓→ High-density zone rejection → Short entry candidate

▶ Entry & Exit Summary

|

| Use Case | Market Condition | Action

| Counter-trend entry | Price approaching a high-density zone (red/orange) | Bounce entry candidate

| Breakout entry | Price breaking through a high-density zone | Breakout entry (confirm momentum first)

| Trend following | Price passing through a low-density zone (blue) | Hold / continue in trend direction

| Take Profit (TP) | Next high-density zone ahead | Use as TP price target

| Stop Loss (SL) | Break of high/low auto-drawn line | Use as SL reference

| Position scaling | MA direction reverses in MA Table | Consider partial close


Section 05

Parameter Reference

─ General Display Settings ─

|

| Parameter | Default | Description

| MaxPeriods | 10 | Maximum number of period blocks to process and display. 0 = all periods. Lower values reduce chart processing load.

| HighLineColor | Red | Color of the high line for each period block

| LowLineColor | Red | Color of the low line for each period block

| IsDrawBandLine | false | Set to true to display the band grid lines on the chart

| BandLineColor | Silver | Color of band grid lines. Light colors (Silver, LightGray) recommended.


─ Heatmap Color Settings ─

|

| Parameter | Default | Density Level

| BandBgColor5 | Red | Level 5 — Highest density (≥ 80% of peak)

| BandBgColor4 | Orange | Level 4 — High density (60–79%)

| BandBgColor3 | Yellow | Level 3 — Medium density (40–59%)

| BandBgColor2 | Aqua | Level 2 — Low density (20–39%)

| BandBgColor1 | Blue | Level 1 — Lowest density (< 20%)


─ Per-TF Analysis Period (Number of Bars) ─

More bars = wider historical lookback. Fewer bars = density based on more recent data.

|

| Parameter | Default | Approximate Coverage

| AnalysisPeriodM1 | 1440 bars | ≈ 1 day

| AnalysisPeriodM5 | 1440 bars | ≈ 5 days

| AnalysisPeriodM15 | 1440 bars | ≈ 15 days

| AnalysisPeriodM30 | 1440 bars | ≈ 30 days

| AnalysisPeriodH1 | 1440 bars | ≈ 60 days

| AnalysisPeriodH4 | 1440 bars | ≈ 240 days

| AnalysisPeriodD1 | 1200 bars | ≈ 5 years

| AnalysisPeriodW1 | 520 bars | ≈ 10 years

| AnalysisPeriodMN | 240 bars | ≈ 20 years


─ Per-TF Band Width (pips) ─

|

| Parameter | Default | Notes

| BandWidthPipsM1 | 1 pip | Fine granularity for scalping

| BandWidthPipsM5 | 2 pips |

| BandWidthPipsM15 | 3 pips |

| BandWidthPipsM30 | 5 pips |

| BandWidthPipsH1 | 10 pips |

| BandWidthPipsH4 | 25 pips |

| BandWidthPipsD1 | 50 pips |

| BandWidthPipsW1 | 100 pips |

| BandWidthPipsMN | 250 pips | Coarse granularity for monthly

💡 Default values work well for major FX pairs (USD/JPY, EUR/USD, etc.). For high-volatility instruments (XAU/USD, exotic crosses), consider widening band widths by 1.5–2×.


─ MA Table Settings ─

|

| Parameter | Default | Description

| ShowMATable | true | Set to false to hide the MA Table

| MA1Period | 20 | Calculation period for MA1 (short-term MA)

| MA2Period | 50 | Calculation period for MA2 (medium-term MA)

| MA3Period | 200 | Calculation period for MA3 (long-term / trend MA)

| MA1Method / MA2Method / MA3Method | SMA | Choose from: SMA / EMA / SMMA / LWMA

| LookbackBars | 20 | Number of bars used for Highest / Lowest status detection

| HighestColor | Red | Text color for "Highest" status in MA Table

| LowestColor | Blue | Text color for "Lowest" status in MA Table

| UpArrowColor | Red | Color of the up arrow (↑) in MA Table

| DownArrowColor | Blue | Color of the down arrow (↓) in MA Table

| TableFontSize | 8 | Font size of the MA Table (pt)

| TableScale | 1.0 | Display scale of the MA Table. Recommended: 1.5–2.0 for 4K/WQHD displays.


Section 06

Installation & Setup Guide

Installation Steps

  • Purchase & Download: After purchasing on MQL5 Market, download HotZone from the "Market" tab inside MetaTrader 5.
  • Apply to Chart: In the MT5 Navigator panel → "Indicators" → drag and drop HotZone onto your desired chart.
  • Settings Dialog: A configuration dialog will appear. Click OK with the default settings to get started immediately.
  • Verify Display: Once the heatmap, high/low lines, and MA Table appear on the chart, setup is complete.

Recommended Settings by Use Case

|

| Scenario | Recommended Settings

| Major FX pairs (USD/JPY, EUR/USD, GBP/USD, etc.) | Band widths: default values / MaxPeriods: 10 / MA: 20, 50, 200 (SMA)

| High-volatility instruments (XAU/USD, exotic crosses, etc.) | Widen band widths 1.5–2× per TF (e.g. H1: 10 → 20 pips)

| High-resolution displays (4K / WQHD) | TableScale = 1.5–2.0 / TableFontSize = 10–12


Important Notes

⚠️ HotZone is MT5 only. It does not work on MT4.

⚠️ On first load, processing a large amount of historical data may take a few seconds to tens of seconds.

⚠️ If AnalysisPeriod is set very high, some brokers may not have sufficient historical data. A warning will appear in the console if data is insufficient.

⚠️ HotZone is an analysis tool. It does not generate trade signals automatically. All trading decisions remain your responsibility.


Section 07

Frequently Asked Questions


Does it work on MT4?

No. HotZone is MT5 only and is not compatible with MT4.


Which symbols does it support?

HotZone works with any symbol available in MT5 — FX pairs (major, minor, and exotic), precious metals (XAU/USD, XAG/USD), oil (USOIL), stock indices (US30, DAX40), and more.


Will it slow down my chart?

The MaxPeriods parameter limits the number of rendered period blocks to control performance. The default value of 10 runs smoothly on typical hardware (Core i5+, 8GB RAM). Reduce to 5 on lower-spec machines if needed.


Can I use it alongside other indicators?

Yes. HotZone renders in the chart window but does not conflict with other indicators. That said, too many overlapping indicators can reduce readability — manage the number of active indicators accordingly.


Do I need to reconfigure it every time I change the timeframe?

No. HotZone automatically switches to the optimal parameters when you change the timeframe. Band widths and analysis periods are all pre-optimized per TF and applied automatically.


Does it work with any broker?

It works with any MT5-compatible broker. However, the amount of available historical data varies by broker. On brokers with limited data history, longer-term TFs (W1, MN) may not produce fully accurate density calculations.


Will I receive updates after purchase?

Yes. When updates are released through MQL5 Market, your copy will be updated automatically at no additional cost.


Is there a refund policy?

Refund policy follows MQL5 Market terms. Please refer to the MQL5 help page for details.


Section 08

Version Information & Changelog

Version: 1.00

Last Updated: January 22, 2026

Developer: CAPS LLC

Website: https://traders.tokyo/

Platform: MetaTrader 5 (MT5)

Changelog

|

| Version | Date | Changes

| v1.00 | 2026-01-22 | Initial Release

  • 5-level color price density heatmap (M1 to MN, all timeframes)
  • Per-TF optimized period block auto-segmentation
  • MA Table (3 MAs + current price, direction arrows, DPI scaling support)
  • Automatic high/low line drawing per period block
  • Customizable band widths and analysis periods per TF

Disclaimer

HotZone is provided for informational and analytical purposes only. The developer and distributor accept no responsibility for any trading results arising from the use of this indicator. All trading and investment decisions are made at your own risk. Past price data and density patterns do not guarantee future performance.

© 2026 CAPS LLC. All rights reserved.  /  https://traders.tokyo/

Recommended products
Product Overview Global Session Zones System is a chart indicator designed for both   MT4 and MT5   platforms. It visualizes the four major global trading sessions (New York, London, Tokyo, Sydney) by drawing session background boxes, key price levels, and a statistical panel. It helps traders identify market volatility and trend strength, providing reliable breakout signals. Core Features Session Visualization : Customizable start/end times and colors for the four major sessions. Technical Anal
To review our products, please click the link: LINK This Classic Pivot Point Indicator accurately calculates and displays 7 essential pivot levels , including the Pivot Point , 3 Support levels (S1–S3) , and 3 Resistance levels (R1–R3) based on the standard classic pivot formula . Designed for Forex, indices, commodities, and crypto trading , it supports multi-currency and multi-timeframe analysis in a clean, professional dashboard interface . With the built-in interactive dashboard , traders c
Market Structure Fractals The structure layer MetaTrader 5 was missing Most traders stare at candles and draw structure manually — imprecisely, inconsistently, and always too late. You know what a fractal high and low look like. The question is whether you can spot every one, mark it cleanly, and track it the moment price breaks through. You can't. Market Structure Fractals can. MetaTrader 5 shows you price. It doesn't show you structure. That gap — between a candle pattern and a confirmed bre
FREE
CosmiCLab SMC FIBO CosmiCLab SMC FIBO is a professional trading indicator designed for traders who use Smart Money Concepts (SMC), market structure analysis and Fibonacci retracement levels. The indicator automatically detects market swings and builds Fibonacci levels based on the latest impulse movement. It also identifies market structure changes such as BOS (Break of Structure) and CHOCH (Change of Character), helping traders understand the current market direction. CosmiCLab SMC FIBO also pr
A clean MT5 structure-based trend detector with visual trend arrows, valid pivot markers, and optional structure areas. STS Structure Trend Detector is a clean MetaTrader 5 indicator for detecting market trend direction from price structure. STS Structure Trend Detector is designed for traders who want a simple visual tool to follow the current market structure directly on the chart. The indicator analyzes valid highs and lows, detects structural trend changes, and displays the result with clear
RBreaker
Zhong Long Wu
RBreaker Gold Indicators is a short-term intraday trading strategy for gold futures that combines trend following and intraday reversal approaches. It not only captures profits during trending markets but also enables timely profit-taking and counter-trend trading during market reversals. This strategy has been ranked among the top ten most profitable trading strategies by the American magazine   Futures Truth   for 15 consecutive years. It boasts a long lifecycle and remains widely used and st
Session Time Monitor shows the Sydney, Tokyo, London and New York trading sessions directly on your chart. The GMT offset of your trade server is detected automatically, so there is no offset parameter to configure. Each region is handled with its own daylight saving rule: European, United States and Southern Hemisphere schedules all change on different dates, and the display follows each of them independently. The panel shows the server time, GMT, your local time, the detected server offset,
FREE
PRISM TRAIL SURGE SuperTrend Direction + Stochastic Recovery for XAUUSD Prism Trail Surge is a professional Gold trading indicator designed to identify trend-aligned recovery opportunities supported by directional structure, momentum recovery, and volatility-based trade levels. The indicator combines SuperTrend direction analysis with Stochastic recovery confirmation, an internal Gann and Fibonacci price-alignment engine, confirmed-can
Caicai L&S Yield Histogram Important Notice: This indicator is an integral tool of the automated EA Caicai Long and Short Pair Trading . This indicator visually displays the percentage deviation (Yield %) of a pair's current spread relative to its own historical mean. It is an excellent tool for quickly visualizing the gross financial potential of a market distortion in Long & Short operations. Main Features: Percentage Visualization: Understand the size of the distortion in palpable percentage
Pivot Points MT5 is a universal color multicurrency/multisymbol indicator of the Pivot Points levels systems. You can select one of its three versions: Standard Old, Standard New and Fibo . It plots pivot levels for financial instruments in a separate window . The system will automatically calculate the Pivot Point on the basis of market data for the previous day ( PERIOD_D1 ) and the system of support and resistance levels, three in each. A user can choose colors for the indicator lines. The on
Gold Trader Pro is an advanced analytical tool specifically engineered for professional trading on XAUUSD (Gold). It provides an immediate comprehensive overview of market structure across 7 different timeframes, allowing traders to identify flow direction and signal strength through a modern, draggable, and interactive interface. Key Features Multi-Timeframe Analysis: Real-time monitoring of M1, M5, M15, M30, H1, H4, and D1. Two Operational Modes: MODE_SCALPING: Optimized for fast-paced analys
FREE
Price Magnet — Price Density and Attraction Levels Indicator Price Magnet is a professional analytical tool designed to identify key support and resistance levels based on statistical Price Density. The indicator analyzes a specified historical period and detects price levels where the market spent the most time. These zones act as “magnets,” attracting price action or forming a structural base for potential reversals. Unlike traditional Volume Profile tools, Price Magnet focuses on price-time d
Key level wedge MT5
Presley Annais Tatenda Meck
The   Key level wedge MT5   indicator automatically draws rising wedge pattern and falling wedge pattern for you on the chart. This pattern is really good when used as a confirmation entry at key support & resistance, supply & demand and reversal zones. Advantages  The   Key level wedge MT5   block DOES NOT RE-PAINT, giving you confidence when a signal appears and also helps when looking back.  The   Key level wedge MT5   includes an on/off button on the chart to easily keep the charts clean
This script provides basic pivot point Support and Resistance Levels to the user whilst displaying Break signal tags. It also has the ability to let the user display more significant breaks by filtering using the Volume Oscillator. Only more significant breaks of these basic levels are displayed to the user when optimized which avoids noise and messy signals. It will also display breaks with candles it deems to be bullish (e.g. having a longer upper or lower wick). Notation The notation
HAS RSI Signal — Professional Trend Indicator with SL/TP Calculation HAS RSI Signal is a powerful trading tool that combines time-tested classics with modern noise-filtering algorithms. The indicator analyzes the market through the prism of Heiken Ashi Smoothed candles and the RSI oscillator, providing clear entry signals at trend reversals or when exiting overbought/oversold zones. Key Advantages: Double Filtration: Using Heiken Ashi Smoothed eliminates market "noise," while RSI confirms the mo
Pivot Confluence Zones   is a   technical analysis indicator for MT4 and MT5   designed to identify   retracement zones ,   reversal areas , and   support and resistance levels   by combining   Pivot Points ,   Fibonacci Retracement ,   ATR , and   ADR   into a single trading workspace. Instead of relying on a single technical tool, the indicator searches for   confluence zones   where multiple trading levels overlap, helping traders evaluate areas that may attract increased market attention. To
Advanced Support and Resistance Support and resistance levels are widely used in trading. They are important as they show some key price levels. Before applying any strategy, one may consider it necessary to draw support and resistance. However, this process can take much time especially if one is to analyse a lot of currency pairs, commodities or indices. This Advanced Support and Resistance tool was designed for traders at any level, amateur to professional. It plots key support and resistance
FarOne Engine Gann Magnet MTF MT5 - Multi Timeframe Institutional Levels OVERVIEW FarOne Engine Gann Magnet is a professional Multi-Timeframe indicator that shows key institutional levels based on Gann 50% theory. It helps traders identify strong Buy Zones and Sell Zones across 7 timeframes: M1 to D1. KEY FEATURES Multi Timeframe Analysis: M1, M5, M15, M30, H1, H4, D1 in one chart Automatic Levels: High, Low, Buy Zone, Sell Zone Smart Dashboard: Real-time status for each timeframe - MAG
Official BlueDigitsFx Ecosystem Access Get infrastructure updates, workflow resources, product releases, and ecosystem access through the official BlueDigitsFx ecosystem. Telegram Ecosystem Website MT4 Version BlueDigitsFx Spike And Strike Reversal MT5 — Mixed Oscillator for Market Reversal & Momentum Analysis BlueDigitsFx Spike And Strike Reversal is a composite oscillator that combines multiple indicator signals to help traders identify possible market reversals, momentum shifts, and exhau
Smart Trendlines MT5
Suvashish Halder
5 (3)
Smart Trendlines – No.1 Trendlines Indicator Smart Trendlines is a precision tool that automatically draws trendlines based on every valid pivot point, helping traders identify key support and resistance zones. It continuously adjusts as new market pivots form, providing a live and accurate reflection of price structure. Whether you’re tracking trends, preparing for reversals, or anticipating breakouts — this indicator keeps you one step ahead. It works seamlessly across all assets including For
Support & Resistance MT5 Description Support & Resistance MT5 is a MetaTrader 5 indicator that automatically identifies and draws support and resistance levels on the chart. The indicator helps traders quickly locate important price levels that may act as areas of buying or selling interest, reducing the need to draw levels manually. It is suitable for traders who use support and resistance as part of their technical analysis. Features Automatic support level detection Automatic resistance level
Heiken Ashi Supertrend Combine
Tri Yasin Satrio Adji Pranoto
Headline: Stop Guessing, Start Winning. Unleash the Power of the Heiken Ashi Supertrend Indicator. Body: Are you tired of market noise, confusing charts, and missed opportunities? The Heiken Ashi Supertrend Indicator is the ultimate tool designed to bring clarity and confidence to your trading, once and for all. We've combined two of the most powerful concepts in technical analysis into one seamless, easy-to-use indicator: Crystal-Clear Trends with Heiken Ashi: Say goodbye to choppy price action
Smc Session Killzone and Breakout The Smc Session Killzone and Breakout indicator automates the institutional session trading model for MetaTrader 5. It draws the Asian, London, and New York session ranges as labelled boxes on the chart, detects when price sweeps beyond the Asian session high or low, and fires a non-repainting entry signal after a Market Structure Shift is confirmed. All signals are based on closed bars and do not repaint. The underlying model follows the sequence that institut
FREE
SMC Alpha Engine SMC Alpha Engine is a Smart Money Concepts indicator for MetaTrader 5 designed to identify Order Blocks, Fair Value Gaps, Liquidity Sweeps, and market structure changes directly on the chart. The indicator focuses on displaying the most recent valid Order Block together with automatically calculated TP and SL levels for simplified chart analysis. Main Features Automatic Order Block detection Buy and Sell zone visualization Automatic TP and SL calculation Fair Value Gap (FVG) det
"Adjustable Fractals" - is an advanced version of fractal indicator, very useful trading tool! As we know   Standard fractals MT5 indicator does not have settings at all   - this is very inconvenient for traders. Adjustable Fractals has resolved that issue - it has all necessary settings: Adjustable period   of indicator (recommended values - above 7). Adjustable distance   from Highs/Lows of price. Adjustable design  o f fractal arrows. Indicator has built-in Mobile and PC alerts. Click here
Footprint is an indicator for order flow and volume analysis. It helps identify market structure at the cluster level, find key zones with increased activity, and work with filters directly on the chart without constantly opening the settings window. Footprint Indicator Features cluster-based Bid x Ask and Delta charts; on-chart control panel; sliders for filter adjustments; Absorption; Initiative; Stacked Imbalances; Big Trades; dPOC / Dynamic Point of Control; Delta; side market profile; cumul
Trade smarter, not harder: Empower your trading with Harmonacci Patterns This is arguably the most complete harmonic price formation auto-recognition indicator you can find for the MetaTrader Platform. It detects 19 different patterns, takes fibonacci projections as seriously as you do, displays the Potential Reversal Zone (PRZ) and finds suitable stop-loss and take-profit levels. [ Installation Guide | Update Guide | Troubleshooting | FAQ | All Products  ] It detects 19 different harmonic pric
MTF MA Color Candles Alert helps traders read moving-average context faster by replacing regular candles with four customizable candle colors. The indicator can use the current timeframe or a selected higher timeframe moving average. For example, a trader can view M5 price action while coloring the candles from an H1 or H4 moving average condition. Main features: - Multi-timeframe MA source: current, M5, M15, M30, H1, H4, D1, and W1 - Moving average period, method, and applied price are adjus
Multi-Timeframe PO3 Projection Multi-Timeframe PO3 Projection is a clean and practical MetaTrader 5 indicator designed to project multiple higher-timeframe candles directly on your active chart. Instead of switching between H1, H4, D1, and other higher timeframes, this indicator lets you view their live candle structure side by side. It helps traders track the current higher-timeframe open, high, low, close, and candle direction while staying on the chart timeframe they are actively trading. The
Balance of Power (BOP) indicator with multi-timeframe support, customizable visual signals, and configurable alert system. Freelance programming services, updates, and other TrueTL products are available on my MQL5 profile . Feedback and reviews are highly appreciated! What is BOP? Balance of Power (BOP) is an oscillator that measures the strength of buyers versus sellers by comparing the change in price to the range of the bar. The indicator is calculated as (Close - Open) / (High - Low), th
FREE
Buyers of this product also purchase
This product was updated for the 2026 market and optimized for the latest MT5 builds . PRICE UPDATE NOTICE:   Smart Trend Trading System is currently available for $99. The price will increase to $199 after the next 30 purchases. SPECIAL OFFER:  After purchasing Smart Trend Trading System, send me a private message to claim the Smart Universal EA for FREE and turn your Smart Trend signals into automated trades.   [User Manual]   ,  [PDF]  ,   [Installation manual]   and  [Online course] Smart T
Trend Sniper X
Sarvarbek Abduvoxobov
5 (10)
Trend Sniper X is a multi-timeframe trend-following indicator for MetaTrader 5 that helps traders identify trend direction and potential reversal points with clarity and precision. Price Information: The current price is promotional and is subject to change as upcoming updates and new features are released. Code2Profit Channel Master the Market with Multi-Timeframe Analysis! Technical Specifications Platform MetaTrader 5 Indicator Type Multi-Timeframe Trend Indicator Operating Timeframe Any char
Welcome to ENTRY IN THE ZONE AND SMC MULTI TIMEFRAME Entry In The Zone and SMC Multi Timeframe is a real-time market analysis tool based on Smart Money Concepts (SMC), designed to analyze market structure, price direction, and key trading zones. It supports both Single-Timeframe Analysis and Multi-Timeframe Analysis, providing a clearer view of the overall market structure across multiple timeframes, with real-time BUY / SELL signals that do not repaint. It is designed to help filter trading opp
Divergence Bomber
Ihor Otkydach
4.89 (93)
From time to time, I trade using this system myself. Check out my manual BOMBER trading on a live account— LIVE SIGNAL Each buyer of this indicator also receives the following for free: The custom utility "Bomber Utility", which automatically manages every trade, sets Stop Loss and Take Profit levels, and closes trades according to the rules of this strategy Set files for configuring the indicator for various assets Set files for configuring Bomber Utility in the following modes: "Minimum Risk"
Neuro Poseidon MT5
Daria Rezueva
4.85 (54)
Neuro Poseidon is a new indicator by Daria Rezueva. It combines precise trading signals with adaptive TP/SL levels - creating best possible trades as a result! Message me and get  Neuro Poseidon Assistant  as a gift to automize your trading process! What makes it stand out? 1. Proven profitability on all assets and timeframes 2. Only confirmed BUY and SELL signals present on the chart 3. Adaptive TP & SL levels generated by the software for each trade 4. Easy to understand - suitable for al
SuperScalp Pro
Van Minh Nguyen
4.61 (31)
SuperScalp Pro –  Professional Multi-Layer Confluence Scalping System SuperScalp Pro is a professional multi-layer confluence scalping system designed to help traders identify higher-probability opportunities with clearer entry confirmation, ATR-based Stop Loss and Take Profit levels, and flexible signal filtering across XAUUSD, BTCUSD, and major Forex pairs. Full documentation available in the product blog:   [User Guide] Auto trading available via SuperScalp Pro Auto Trader EA:   [Auto Trader
The legend is back! Entry Points Pro 10. A relaunch of the legendary indicator that held a Top-3 spot on the MQL5 Market for 3 years. Hundreds of rave reviews (589 across two versions), thousands of traders use it every day, 31,000+ demo downloads  across   MT4   +   MT5 . I have read every one of your reviews from the past five years — and instead of promises, I built the answers into version 10. From an author who has been in the market since 1999 and values honesty, his reputation and his cli
Secure the Lowest Price Today. After purchase, contact via   MQL5 inbox   to receive your buyer kit and bonus. Let's be honest first. No indicator will make you profitable on its own. If someone tells you otherwise, they're selling you a dream. Every indicator that shows perfect buy/sell arrows can be made to look flawless — just zoom into the right window of history and screenshot the winners. We won't do that. SMC Intraday Formula is a tool. It reads the market structure for you, maps the hig
GoldenX Entry MT5
Kareem Abbas
5 (15)
Price will increase by $20 every 10 buyers to maintain premium value. After purchase, contact via   MQL5 inbox   to receive your buyer kit and bonus. You have probably tested dozens of indicators before. But we are not here to be “just another signals indicator.” Behind GoldenX Entry is intensive research & development focused on building sophisticated algorithms designed to adapt to the real behavior of every instrument — not generic signals recycled everywhere else. From advanced Auto Optim
Superhero
Ihor Otkydach
5 (3)
The SUPERHERO indicator is a multi-currency trading system designed on an "all-inclusive" basis. The indicator independently analyzes the market and provides signals on when to open and close trades. It uses Stop Loss and Take Profit orders. The R:R ratio is 1:1. From time to time, I personally trade based on this system's signals, and here are the results I get—   LIVE SIGNAL This system can send push notifications to your smartphone, so you can place trades "on the go" without needing to be ti
The  UZFX {SSS} Scalping Smart Signals v4.0 MT5  is a Non Repaint high-performance trading indicator designed for Scalpers, Day Traders, and Swing Traders  who demand accurate, real-time signals in fast-moving markets. Developed by  (UZFX-LABS) , this indicator combines price action analysis, trend confirmation, and smart filtering to generate high-probability  buy and sell signals, Warning Signals, and Trend Continuation Opportunities across all currency pairs and timeframes.  Stop second-guess
M1 Sniper MT5
Oleg Rodin
5 (5)
M1 SNIPER  is an easy to use trading indicator system. It is an arrow indicator which is designed for M1 time frame. The indicator can be used as a standalone system for scalping on M1 time frame and it can be used as a part of your existing trading system. Though this trading system was designed specifically for trading on M1, it still can be used with other time frames too. Originally I designed this method for trading XAUUSD and BTCUSD. But I find this method helpful in trading other markets
Atomic Analyst MT5
Issam Kassas
4.43 (53)
This product was updated for the 2026 market and optimized for the latest MT5 builds. PRICE UPDATE NOTICE: Atomic Analyst is currently available for $99. The price will increase to $199 after the next 30 purchases . SPECIAL OFFER:  After purchasing Atomic Analyst, send me a private message to claim the Smart Universal EA for FREE and turn your Atomic Analyst signals into automated trades. [Online Course] ,  [How to use] , [User Manual] ,  [PDF]  And [DEMO] Atomic Analyst is a non-repainting, n
Zoryk Gold
Reda El Koutbane
5 (6)
discount ends SOON next price 69 $ ZORYK — Advanced XAUUSD Signal System for MetaTrader 5 You know the feeling. You spend time analyzing gold. You wait for the entry. You finally open the trade, and price immediately moves against you. You close too early, move the Stop Loss or hesitate for a few seconds. Then the market reaches the exact destination you originally expected without you. The direction was not always the problem. The real problem was uncertainty. You did not know exactly where th
Gann Made Easy   is a professional and easy to use Forex trading system which is based on the best principles of trading using the theory of W.D. Gann. The indicator provides accurate BUY and SELL signals including Stop Loss and Take Profit levels. You can trade even on the go using PUSH notifications. PLEASE CONTACT ME AFTER PURCHASE TO GET TRADING  INSTRUCTIONS   AND GREAT EXTRA INDICATORS  FOR FREE! Probably you already heard about the Gann trading methods before. Usually the Gann theory is a
SR Liquidity   is a trading indicator designed to reveal the hidden zones where market liquidity concentrates and price reacts most strongly. These special liquidity areas act as powerful support and resistance levels, giving you a clear map of where the market is most likely to reverse. Instead of drawing ordinary Support/Resistance lines, SR Liquidity analyzes real price behavior to detect the zones where buying and selling pressure accumulate. These are actually the pools of liquidity that dr
Trend Catcher ind mt5
Ramil Minniakhmetov
5 (18)
TREND CATCHER INDICATOR Trend Catcher Indicator analyzes market price movements, using a combination of the author’s proprietary and customized adaptive trend-analysis indicators.  It identifies the true market direction by filtering out short-term noise and focusing on underlying momentum strength, volatility expansion, and price structure behavior.  It also uses a combination of smoothing and trend-filtering customized indicators such as moving averages, RSI, and volatility filters.   Real ope
Crystal Heikin Ashi Signals
Muhammad Jawad Shabir
5 (3)
Crystal Heikin Ashi Signals - Professional Trend & Signal Detection Indicator Advanced Heikin Ashi Visualization with Intelligent Signal System for Manual & Automated Trading Final Price: $149 ---------> Price goes up $10 after every 10 sales . Limited slots available — act fast . Overview Crystal Heikin Ashi Signals is a professional-grade MetaTrader 5 indicator that combines pure Heikin Ashi candle visualization with an advanced momentum-shift detection system. Designed for both manual traders
Power Candles MT5
Daniel Stein
5 (9)
Power Candles V3 - Self-Optimizing Strength Indicator Power Candles V3 turns currency and instrument strength into an actionable trade plan on every chart it is attached to. Instead of just coloring candles, it runs a live auto-optimization in the background and hands you the best Stop Loss, Take Profit and signal threshold for the symbol in front of you. One click adopts it for live trading - entry, Stop Loss and Take Profit rays appear on the chart at the exact prices, and alerts fire with dir
M1 Quantum MT5
Hamed Dehgani
4.27 (11)
Live Trading Signals Using M1 Quantum : Signal  (Trade executed automatically by the Quantum Trade Assistant , included free with this product.) Latest News : Version 1.64 has been released, All trades now have a Stop Loss placed behind the relevant Support/Resistance zones. The Smart Close function has also been improved to increase the EA’s performance in this version. Since August 9, the live signal has been running on Version 1.64. Price Plan: Current Price: $169 (Early Adopter Offer) Next
This product was   updated   for the   2026 market   and   optimized   for the   latest MT5 builds . PRICE UPDATEe NOTICE: Smart Price Action Concepts   is currently available for $200. The price will   increase to $299   after the next   30 purchases. SPECIAL OFFER:  After purchasing , send me a private message to claim FREE Bonus + Gift. First of all Its worth emphasizing here that this Trading Tool is Non Repainting , Non Redrawing and Non Lagging Indicator , Which makes it ideal for profe
Axiom Matrix
Issam Kassas
5 (5)
LAUNCH PRICE: $99 Axiom Matrix is available at the launch price of $99. The price will increase to $199 after the first 30 purchases. SPECIAL OFFER:  After purchasing Axiom Matrix, send me a private message to claim the Smart Universal EA for FREE and turn your Smart Trend signals into automated trades. [User Manual] , [Online Course] , [PDF]  And [DEMO] Axiom Matrix is a professional multi-symbol, multi-timeframe market scanner and decision dashboard for MetaTrader 5. It scans your Market Watc
Smc Pro ToolKit
Talal N Z Aljarusha
5 (6)
SMC PRO TOOLKIT — SMART MONEY ANALYSIS & STRUCTURED TRADE PLANNING SMC Pro ToolKit is a professional Smart Money Concepts analysis workspace for MetaTrader 5. It combines market structure, multi-timeframe analysis, institutional price zones, setup evaluation, confirmation tools, volume context, alerts, and risk planning inside one organized chart environment. One workspace. Multiple layers of confirmation. One structured trading plan. OPEN COMPLETE USER GUIDE MULTI-CONDITION SETUP ENGINE At
FX Trend MT5 NG
Daniel Stein
5 (6)
FX Trend NG: The Next Generation Multi-Market Trend Intelligence Overview FX Trend NG is a professional multi-timeframe trend and market monitoring tool designed to give you a complete structural overview of the market in seconds. Instead of switching between dozens of charts, you instantly see which symbols are trending, where momentum is fading, and where strong alignment exists across timeframes. This tool is part of the Stein Investments ecosystem - 18+ tools plus Max, your 1-on-1 AI tradi
Btmm state engine pro
Garry James Goodchild
5 (4)
BTMM State Engine Pro by G-Labs — Beat The Market Maker indicator for MetaTrader 5. Asian session range, London and New York kill zones, level progression (L1/L2/L3), peak formation detection (PFH/PFL), entry signals, and a multi-pair scanner from one chart. Stop scanning charts one pair at a time. The State Engine tracks the BTMM daily cycle automatically — Asian box, room boundaries, level blocks, peak formations, and filtered entries — while the scanner dashboard shows level, peak status, d
Reversion King Indicator
Eugen-alexandru Zibileanu
5 (6)
A new King in town - Indicator + Order management indications(tp1+tp2+tp3) + Optional Telegram Signal sender   INCLUDED (FREE) ( FULL TRADING  and SIGNAL SYSTEM ) Our best EA for Gold: Gold Slayer  This indicator includes an advanced Strategy, a trading system with customisable order management and a mean reversion system that combines envelope extensions, backed by multiple intelligent confirmation filters like RSI to catch high probability reversal entries with BUY and SELL signals . The indi
Market Structure Order Block Dashboard MT5 is an MT5 indicator designed for traders who want to read market structure and the main price reaction zones directly on the chart. It combines BOS, ChoCH, Order Blocks, Fair Value Gaps (FVG), Liquidity, Kill Zones, Volume Profile, and a compact dashboard for quick analysis. This indicator targets traders who use market structure, ICT and Smart Money concepts as a decision framework. It can help spot trend continuations, possible reversals, price imbala
The Oracle Pro
Ottaviano De Cicco
5 (1)
The Oracle Pro: Synthetic Multi-Timeframe Bias Engine for MT5 ️ Summer Launch Offer — Get The Oracle Pro for USD 199 (early buyers). Price rises with traction; final price USD 399. The Oracle Pro is a premium multi-timeframe bias engine for MetaTrader 5, built for demanding and professional traders. It answers one question with discipline: what is the directional bias on each timeframe right now, how strong is it, and how much do the timeframes agree? Everything is computed on closed bars only
FX Power MT5 NG
Daniel Stein
5 (33)
FX Power: Analyze Currency Strength for Smarter Trading Decisions Overview FX Power is your go-to tool for understanding the real strength of currencies and Gold in any market condition. By identifying strong currencies to buy and weak ones to sell, FX Power simplifies trading decisions and uncovers high-probability opportunities. Whether you’re looking to follow trends or anticipate reversals using extreme delta values, this tool adapts seamlessly to your trading style. Don’t just trade—trade
Currency Strength Wizard   is a very powerful indicator that provides you with all-in-one solution for successful trading. The indicator calculates the power of this or that forex pair using the data of all currencies on multiple time frames. This data is represented in a form of easy to use currency index and currency power lines which you can use to see the power of this or that currency. All you need is attach the indicator to the chart you want to trade and the indicator will show you real s
Filter:
No reviews
Reply to review