HotZone

🔥 HotZone

Visualize Where Price Wants to Go.
  1. "Why does price keep bouncing at this level?"
  2. "Why does it always consolidate in this zone?"
  3. "Where is the next support or resistance?"
If you've ever stared at a chart asking these questions, the answer often lies in Price Density.
Price zones where market participants repeatedly buy and sell naturally accumulate "density."
HotZone is an MT5-exclusive Price Density Analysis Indicator that visualizes this density in real time.

MT5 OnlyM1 to MNCustom Indicator

⚠️ HotZone is a custom indicator for MT5. It is NOT an Expert Advisor (EA) and does not trade automatically.

Who is this for?

✅ Perfect For Traders Who...

  • Draw support & resistance "by feel" and want more precision
  • Need to quickly identify key price zones for day trading
  • Want to track weekly/monthly key zones for swing trading
  • Need to instantly check how price relates to their MAs
  • Want a clean chart without sacrificing information density
  • Want to eliminate the tedious manual work of multi-TF analysis

Section 01

Product Overview

What Is HotZone?

HotZone is a custom indicator exclusively for MetaTrader 5 (MT5).

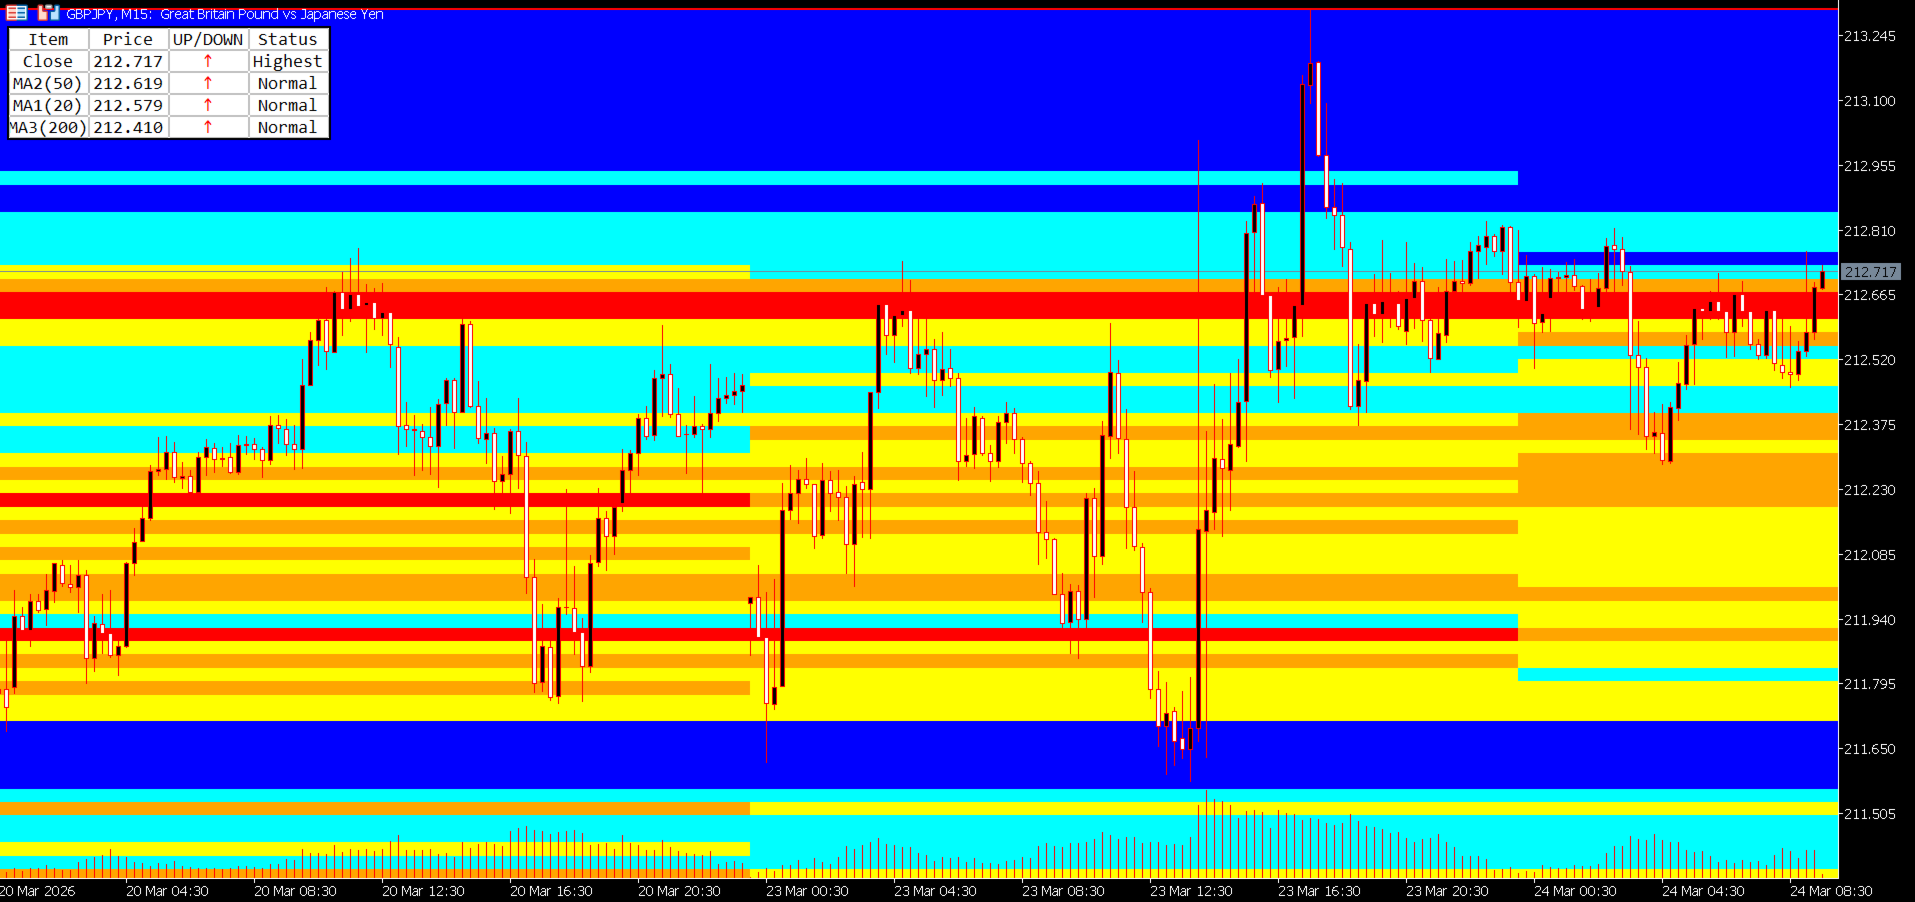
It goes far beyond simple lines or oscillators. HotZone analyzes historical price data — counting how many times price visited each price band — and visualizes that density as a color heatmap directly on your chart.

What Is Price Density Analysis?

Price density analysis is a quantitative method of evaluating how frequently price visited a given price band within a specific time period.

|

| Density Level | Meaning | Chart Behavior

| High Density (Hot Zone) | A zone where many traders have historically bought and sold | Likely to act as strong support or resistance in the future

| Low Density (Cold Zone) | A zone where very little trading activity occurred | Price tends to pass through smoothly — breakouts are more likely

This concept is well-established as the Value Area and Congestion Zone analysis used by professional traders and institutional investors. HotZone automates and visualizes this analysis directly on your MT5 chart.

Problems HotZone Solves

|

| Common Pain Point | HotZone's Solution

| Hard to identify reliable support/resistance | Density heatmap instantly shows price concentration zones

| Multi-TF analysis is time-consuming | All TFs from M1 to MN switch and display automatically

| Confusing MA relationships at a glance | MA Table ranks price and MAs in order at all times

| Charts become cluttered with too many tools | Clean heatmap visualization keeps charts readable

| Drawing high/low lines manually is tedious | High and low lines are drawn automatically per period block

Section 02

Features & Strengths

🔬

Quantitative & Objective Analysis

Instead of "gut-feel" support/resistance, HotZone uses numerical price density data. Two traders looking at the same chart will reach the same conclusions.

🕐

Optimized for Every Timeframe

From M1 to MN, each timeframe has its own optimized period block for density calculation. Just switch TFs — the density map adapts automatically.

📊

Information-Rich Yet Clean

The combination of heatmap + MA Table gives you everything you need while keeping the chart uncluttered. No need to stack multiple indicators.

High-Performance Design

The MaxPeriods limit keeps rendering fast. All parameters switch automatically on TF change — no manual reconfiguration needed.

🎨

Fully Customizable

Color scheme, band width, analysis depth, MA type, and table size — everything is adjustable. Works on both dark and light chart themes.

Section 03

Key Features

■ Feature 1: 5-Level Color Price Density Heatmap

The core of HotZone. For each period block, it analyzes price data and counts how many times price (close) visited each pip-width band. That density is then displayed as a 5-level color heatmap.

Level 5 (Red)Highest density zone — 80% or more of peak density

Level 4 (Orange)High density zone — 60–79%

Level 3 (Yellow)Medium density zone — 40–59%

Level 2 (Aqua)Low density zone — 20–39%

Level 1 (Blue)Lowest density zone — below 20%

All colors are fully customizable to match your chart style.


■ Feature 2: Multi-Timeframe Support with Auto Period Blocks

HotZone supports all timeframes from M1 to MN (Monthly). Simply change the timeframe and the optimal period blocks are automatically configured.

|

| Timeframe | Period Block Boundary | Density Unit

| M1 (1-minute) | Every 2 hours | 2-hour block density

| M5 (5-minute) | Every 12 hours (00:00 / 12:00) | Half-day block density

| M15 (15-minute) | Daily (00:00) | Daily block density

| M30 (30-minute) | Half-week (Mon 00:00 / Wed 12:00) | Half-week block density

| H1 (1-hour) | Weekly (from Monday) | Weekly block density

| H4 (4-hour) | Half-month (1st / 16th) | Half-month block density

| D1 (Daily) | Every 6 months (Jan / Jul) | Semi-annual block density

| W1 (Weekly) | Annually (January) | Annual block density

| MN (Monthly) | Annually (January) | Annual block density


■ Feature 3: Automatic High/Low Line Drawing

HotZone automatically draws High and Low lines for each period block, marking the highest and lowest price reached within that block. These lines serve as dynamic support/resistance references. Colors are customizable, and lines update automatically at each period boundary.


■ Feature 4: Band Grid Lines (Optional)

Set IsDrawBandLine = true to display the underlying band grid used for density calculation directly on the chart.

|

| Timeframe | Default Band Width

| M1 | 1 pip

| M5 | 2 pips

| M15 | 3 pips

| M30 | 5 pips

| H1 | 10 pips

| H4 | 25 pips

| D1 | 50 pips

| W1 | 100 pips

| MN | 250 pips


■ Feature 5: MA Table (Moving Average Analysis Table)

A compact table in the top-left of your chart displays the current price alongside 3 moving averages, sorted by price in real time.

|

| Item | Price | Direction | Status

| Close | Current price | ↑↓ | Normal / Highest / Lowest

| MA1 (20) | MA1 value | ↑↓ | Normal / Highest / Lowest

| MA2 (50) | MA2 value | ↑↓ | Normal / Highest / Lowest

| MA3 (200) | MA3 value | ↑↓ | Normal / Highest / Lowest

↑ (red): price rose from previous bar  /  ↓ (blue): price fell  /  - (black): unchanged

Highest: highest value within the lookback period  /  Lowest: lowest value  /  Normal: standard


■ Additional Smart Features

Auto Timeframe Switching: All parameters auto-adjust when you change the TF — no manual reconfiguration needed

DPI Scaling Support: The MA Table renders correctly on high-resolution and 4K displays

Performance Optimization: MaxPeriods limits rendering to only the range you need

Universal Symbol Support: Works with any MT5 symbol — FX pairs, Gold, Oil, Indices, and more


Section 04

How to Use HotZone in Your Trading

▶ Day Traders

Recommended Timeframes: M1, M5, M15

Example scenario: Trading USD/JPY during the Tokyo session on M5

  • Review the previous day's M5 heatmap → Identify the red and orange zones from yesterday's morning (00:00–12:00) and afternoon (12:00–24:00) blocks
  • At the Tokyo open (09:00), check current price position → Is price near yesterday's high-density zone (red)?
  • Price approaches a red zone → Consider a mean-reversion entry anticipating a bounce
  • Confirm MA20 direction in the MA Table → ↑ favors long, ↓ favors short
  • Target the next high-density zone as take profit → Use the distance between red zones as your TP guideline

💡 M1/M5 heatmaps use 2-hour and half-day blocks, making it easy to pinpoint hot zones within the current session. Effective for scalpers too.

▶ Swing Traders

Recommended Timeframes: H1, H4, D1

Example scenario: Swing trading EUR/USD on the H4 chart

  • Switch to D1 → Identify the red zones (highest density) from the last 6-month block — these are your key medium-term support/resistance candidates
  • Switch to H4 → Check if the half-month block's red zones overlap with D1 zones (confluence check)
  • Confirm MA50 and MA200 positions in the MA Table → Use the price-vs-MA arrangement to determine medium-term trend direction
  • Use H1 to time your entry → Check the weekly block heatmap on Monday to identify the week's key zones
  • Set stop-loss just below the auto-drawn Low Line of the most recent period block

💡 Overlapping D1 (6-month blocks) and H4 (half-month blocks) makes it easy to spot multi-timeframe confluence zones with high conviction.

▶ Professional Traders

Recommended Approach: Multi-TF confluence analysis

Professional traders focus on "confluence zones" — areas where density is high across multiple timeframes simultaneously.

  • W1 heatmap: Identify annual-level key zones (red) → establish the long-term value area baseline
  • D1 heatmap: Confirm whether those zones are also high-density in the 6-month block → validate with medium-term data
  • H4 heatmap: Check if the same zone is still high-density in the half-month block → confirm short-term market interest
  • H1 heatmap: Confirm weekly block density → narrow down your entry window
  • MA Table: Review the arrangement of Close, MA20, MA50, MA200 → gauge trend strength and direction
  • A zone where 2–3 TFs show high density → Maximum Confluence Zone → Highest-confidence entry point

【Long Setup Example】✓ Price approaches the lower edge of W1 red zone✓ D1 red / orange zone also present at the same level✓ MA Table: MA200 < MA50 < MA20 < Close (bullish alignment)✓ MA Table: MA20 direction arrow = ↑ (rising)→ Strong support confluence → Long entry candidate【Short Setup Example】✓ Price approaches the upper edge of H4 red zone✓ D1 red zone also aligns at the same level✓ MA Table: Close < MA20 < MA50 (bearish alignment)✓ MA Table: MA20 direction arrow just flipped to ↓→ High-density zone rejection → Short entry candidate

▶ Entry & Exit Summary

|

| Use Case | Market Condition | Action

| Counter-trend entry | Price approaching a high-density zone (red/orange) | Bounce entry candidate

| Breakout entry | Price breaking through a high-density zone | Breakout entry (confirm momentum first)

| Trend following | Price passing through a low-density zone (blue) | Hold / continue in trend direction

| Take Profit (TP) | Next high-density zone ahead | Use as TP price target

| Stop Loss (SL) | Break of high/low auto-drawn line | Use as SL reference

| Position scaling | MA direction reverses in MA Table | Consider partial close


Section 05

Parameter Reference

─ General Display Settings ─

|

| Parameter | Default | Description

| MaxPeriods | 10 | Maximum number of period blocks to process and display. 0 = all periods. Lower values reduce chart processing load.

| HighLineColor | Red | Color of the high line for each period block

| LowLineColor | Red | Color of the low line for each period block

| IsDrawBandLine | false | Set to true to display the band grid lines on the chart

| BandLineColor | Silver | Color of band grid lines. Light colors (Silver, LightGray) recommended.


─ Heatmap Color Settings ─

|

| Parameter | Default | Density Level

| BandBgColor5 | Red | Level 5 — Highest density (≥ 80% of peak)

| BandBgColor4 | Orange | Level 4 — High density (60–79%)

| BandBgColor3 | Yellow | Level 3 — Medium density (40–59%)

| BandBgColor2 | Aqua | Level 2 — Low density (20–39%)

| BandBgColor1 | Blue | Level 1 — Lowest density (< 20%)


─ Per-TF Analysis Period (Number of Bars) ─

More bars = wider historical lookback. Fewer bars = density based on more recent data.

|

| Parameter | Default | Approximate Coverage

| AnalysisPeriodM1 | 1440 bars | ≈ 1 day

| AnalysisPeriodM5 | 1440 bars | ≈ 5 days

| AnalysisPeriodM15 | 1440 bars | ≈ 15 days

| AnalysisPeriodM30 | 1440 bars | ≈ 30 days

| AnalysisPeriodH1 | 1440 bars | ≈ 60 days

| AnalysisPeriodH4 | 1440 bars | ≈ 240 days

| AnalysisPeriodD1 | 1200 bars | ≈ 5 years

| AnalysisPeriodW1 | 520 bars | ≈ 10 years

| AnalysisPeriodMN | 240 bars | ≈ 20 years


─ Per-TF Band Width (pips) ─

|

| Parameter | Default | Notes

| BandWidthPipsM1 | 1 pip | Fine granularity for scalping

| BandWidthPipsM5 | 2 pips |

| BandWidthPipsM15 | 3 pips |

| BandWidthPipsM30 | 5 pips |

| BandWidthPipsH1 | 10 pips |

| BandWidthPipsH4 | 25 pips |

| BandWidthPipsD1 | 50 pips |

| BandWidthPipsW1 | 100 pips |

| BandWidthPipsMN | 250 pips | Coarse granularity for monthly

💡 Default values work well for major FX pairs (USD/JPY, EUR/USD, etc.). For high-volatility instruments (XAU/USD, exotic crosses), consider widening band widths by 1.5–2×.


─ MA Table Settings ─

|

| Parameter | Default | Description

| ShowMATable | true | Set to false to hide the MA Table

| MA1Period | 20 | Calculation period for MA1 (short-term MA)

| MA2Period | 50 | Calculation period for MA2 (medium-term MA)

| MA3Period | 200 | Calculation period for MA3 (long-term / trend MA)

| MA1Method / MA2Method / MA3Method | SMA | Choose from: SMA / EMA / SMMA / LWMA

| LookbackBars | 20 | Number of bars used for Highest / Lowest status detection

| HighestColor | Red | Text color for "Highest" status in MA Table

| LowestColor | Blue | Text color for "Lowest" status in MA Table

| UpArrowColor | Red | Color of the up arrow (↑) in MA Table

| DownArrowColor | Blue | Color of the down arrow (↓) in MA Table

| TableFontSize | 8 | Font size of the MA Table (pt)

| TableScale | 1.0 | Display scale of the MA Table. Recommended: 1.5–2.0 for 4K/WQHD displays.


Section 06

Installation & Setup Guide

Installation Steps

  • Purchase & Download: After purchasing on MQL5 Market, download HotZone from the "Market" tab inside MetaTrader 5.
  • Apply to Chart: In the MT5 Navigator panel → "Indicators" → drag and drop HotZone onto your desired chart.
  • Settings Dialog: A configuration dialog will appear. Click OK with the default settings to get started immediately.
  • Verify Display: Once the heatmap, high/low lines, and MA Table appear on the chart, setup is complete.

Recommended Settings by Use Case

|

| Scenario | Recommended Settings

| Major FX pairs (USD/JPY, EUR/USD, GBP/USD, etc.) | Band widths: default values / MaxPeriods: 10 / MA: 20, 50, 200 (SMA)

| High-volatility instruments (XAU/USD, exotic crosses, etc.) | Widen band widths 1.5–2× per TF (e.g. H1: 10 → 20 pips)

| High-resolution displays (4K / WQHD) | TableScale = 1.5–2.0 / TableFontSize = 10–12


Important Notes

⚠️ HotZone is MT5 only. It does not work on MT4.

⚠️ On first load, processing a large amount of historical data may take a few seconds to tens of seconds.

⚠️ If AnalysisPeriod is set very high, some brokers may not have sufficient historical data. A warning will appear in the console if data is insufficient.

⚠️ HotZone is an analysis tool. It does not generate trade signals automatically. All trading decisions remain your responsibility.


Section 07

Frequently Asked Questions


Does it work on MT4?

No. HotZone is MT5 only and is not compatible with MT4.


Which symbols does it support?

HotZone works with any symbol available in MT5 — FX pairs (major, minor, and exotic), precious metals (XAU/USD, XAG/USD), oil (USOIL), stock indices (US30, DAX40), and more.


Will it slow down my chart?

The MaxPeriods parameter limits the number of rendered period blocks to control performance. The default value of 10 runs smoothly on typical hardware (Core i5+, 8GB RAM). Reduce to 5 on lower-spec machines if needed.


Can I use it alongside other indicators?

Yes. HotZone renders in the chart window but does not conflict with other indicators. That said, too many overlapping indicators can reduce readability — manage the number of active indicators accordingly.


Do I need to reconfigure it every time I change the timeframe?

No. HotZone automatically switches to the optimal parameters when you change the timeframe. Band widths and analysis periods are all pre-optimized per TF and applied automatically.


Does it work with any broker?

It works with any MT5-compatible broker. However, the amount of available historical data varies by broker. On brokers with limited data history, longer-term TFs (W1, MN) may not produce fully accurate density calculations.


Will I receive updates after purchase?

Yes. When updates are released through MQL5 Market, your copy will be updated automatically at no additional cost.


Is there a refund policy?

Refund policy follows MQL5 Market terms. Please refer to the MQL5 help page for details.


Section 08

Version Information & Changelog

Version: 1.00

Last Updated: January 22, 2026

Developer: CAPS LLC

Website: https://traders.tokyo/

Platform: MetaTrader 5 (MT5)

Changelog

|

| Version | Date | Changes

| v1.00 | 2026-01-22 | Initial Release

  • 5-level color price density heatmap (M1 to MN, all timeframes)
  • Per-TF optimized period block auto-segmentation
  • MA Table (3 MAs + current price, direction arrows, DPI scaling support)
  • Automatic high/low line drawing per period block
  • Customizable band widths and analysis periods per TF

Disclaimer

HotZone is provided for informational and analytical purposes only. The developer and distributor accept no responsibility for any trading results arising from the use of this indicator. All trading and investment decisions are made at your own risk. Past price data and density patterns do not guarantee future performance.

© 2026 CAPS LLC. All rights reserved.  /  https://traders.tokyo/

Рекомендуем также
The FVG Sessions indicator highlights the first fair value gap of the trading session as well as the session range. Detected fair value gaps extend to the end of the trading session. Alerts are included on the formation of a session fair value gap, price being within a session fair value gap, mitigations, and price crossing session fair value gaps average. Trader ICT states that the first fair value gap of the trading session can attract the most significant reaction. Having only one FVG per
To review our products, please click the link: LINK This Classic Pivot Point Indicator accurately calculates and displays 7 essential pivot levels , including the Pivot Point , 3 Support levels (S1–S3) , and 3 Resistance levels (R1–R3) based on the standard classic pivot formula . Designed for Forex, indices, commodities, and crypto trading , it supports multi-currency and multi-timeframe analysis in a clean, professional dashboard interface . With the built-in interactive dashboard , traders c
Market Structure Fractals The structure layer MetaTrader 5 was missing Most traders stare at candles and draw structure manually — imprecisely, inconsistently, and always too late. You know what a fractal high and low look like. The question is whether you can spot every one, mark it cleanly, and track it the moment price breaks through. You can't. Market Structure Fractals can. MetaTrader 5 shows you price. It doesn't show you structure. That gap — between a candle pattern and a confirmed bre
FREE
CosmiCLab SMC FIBO CosmiCLab SMC FIBO — это профессиональный торговый индикатор, основанный на концепциях Smart Money Concepts (SMC), анализе структуры рынка и уровнях Fibonacci. Индикатор автоматически определяет свинги рынка и строит уровни Fibonacci по последнему импульсному движению. Также индикатор определяет ключевые изменения структуры рынка: BOS — Break Of Structure CHOCH — Change Of Character Дополнительно отображаются сигнальные стрелки BUY / SELL при пробое структуры. Индикатор подход
Чистый индикатор определения тренда на основе структуры рынка для MT5 с визуальными стрелками тренда, маркерами действительных пивотов и дополнительными структурными областями. STS Structure Trend Detector — это чистый индикатор для MetaTrader 5, предназначенный для определения направления рыночного тренда на основе ценовой структуры. STS Structure Trend Detector разработан для трейдеров, которым нужен простой визуальный инструмент для отслеживания текущей рыночной структуры прямо на графике. Ин
RBreaker Gold Indicators — это краткосрочная внутридневная торговая стратегия для фьючерсов на золото, которая сочетает в себе два подхода: трендовое следование и внутридневные развороты. Она позволяет не только получать прибыль при трендовом движении, но и своевременно фиксировать прибыль при развороте рынка, открывая позиции в новом направлении. Данная стратегия на протяжении 15 лет подряд входила в десятку самых прибыльных торговых стратегий по версии американского журнала Futures Truth. Она
Caicai L&S Yield Histogram Important Notice: This indicator is an integral tool of the automated EA Caicai Long and Short Pair Trading . This indicator visually displays the percentage deviation (Yield %) of a pair's current spread relative to its own historical mean. It is an excellent tool for quickly visualizing the gross financial potential of a market distortion in Long & Short operations. Main Features: Percentage Visualization: Understand the size of the distortion in palpable percentage
Pivot Points MT5 - цветной, универсальный, мультивалютный/мультиинструментальный индикатор системы уровней Pivot Points , состоящий из трех версий: Standard Old, Standard New и Fibo , выбираемых пользователем по желанию. Построение идет для финансовых инструментов в отдельном окне . По выбору пользователя система автоматически рассчитывает точку разворота Pivot Point на основе рыночных данных за истекший день ( PERIOD_D1 ) и систему уровней сопротивления и поддержки по три в каждом. Пользователю
Gold Trader Pro is an advanced analytical tool specifically engineered for professional trading on XAUUSD (Gold). It provides an immediate comprehensive overview of market structure across 7 different timeframes, allowing traders to identify flow direction and signal strength through a modern, draggable, and interactive interface. Key Features Multi-Timeframe Analysis: Real-time monitoring of M1, M5, M15, M30, H1, H4, and D1. Two Operational Modes: MODE_SCALPING: Optimized for fast-paced analys
FREE
Price Magnet — Индикатор зон плотности цены и уровней притяжения Price Magnet — это профессиональный аналитический инструмент, который определяет ключевые уровни поддержки и сопротивления на основе статистической плотности распределения цены (Price Density). Индикатор анализирует заданный исторический период и находит ценовые значения, на которых рынок находился дольше всего. Эти зоны выступают в роли «магнитов» — они притягивают цену или служат фундаментом для разворота. В отличие от стандартны
This script provides basic pivot point Support and Resistance Levels to the user whilst displaying Break signal tags. It also has the ability to let the user display more significant breaks by filtering using the Volume Oscillator. Only more significant breaks of these basic levels are displayed to the user when optimized which avoids noise and messy signals. It will also display breaks with candles it deems to be bullish (e.g. having a longer upper or lower wick). Notation The notation
Key level wedge MT5
Presley Annais Tatenda Meck
The   Key level wedge MT5   indicator automatically draws rising wedge pattern and falling wedge pattern for you on the chart. This pattern is really good when used as a confirmation entry at key support & resistance, supply & demand and reversal zones. Advantages  The   Key level wedge MT5   block DOES NOT RE-PAINT, giving you confidence when a signal appears and also helps when looking back.  The   Key level wedge MT5   includes an on/off button on the chart to easily keep the charts clean
Quarterly Theory Indicator: A Comprehensive Guide for SMC and ICT Traders The Quarterly Theory indicator is an advanced time-based analytical tool designed for MetaTrader platforms. Rooted in the core principles of Smart Money Concepts and the Inner Circle Trader methodology, this indicator visualizes the fractal nature of time and price delivery in financial markets. The indicator operates on the algorithmic premise that markets do not move randomly, but rather follow strict mechanical time cyc
HAS RSI Signal — Профессиональный трендовый индикатор с расчетом SL/TP HAS RSI Signal — это мощный торговый инструмент, объединяющий проверенную классику и современные алгоритмы фильтрации шума. Индикатор анализирует рынок через призму сглаженных свечей Heiken Ashi и осциллятора RSI, предоставляя трейдеру четкие сигналы на вход в моменты разворота тренда или выхода из зон перекупленности/перепроданности. Основные преимущества: Двойная фильтрация: Использование Heiken Ashi Smoothed позволяет искл
Advanced Support and Resistance Support and resistance levels are widely used in trading. They are important as they show some key price levels. Before applying any strategy, one may consider it necessary to draw support and resistance. However, this process can take much time especially if one is to analyse a lot of currency pairs, commodities or indices. This Advanced Support and Resistance tool was designed for traders at any level, amateur to professional. It plots key support and resistance
FarOne Engine Gann Magnet MTF MT5– Мультитаймфреймовые Институциональные Уровни ОБЗОР FarOne Engine Gann Magnet — это профессиональный мультитаймфреймовый индикатор, отображающий ключевые институциональные уровни на основе теории Ганна 50%. Он помогает трейдерам определять сильные зоны покупки (Buy Zone) и продажи (Sell Zone) на 7 таймфреймах: от M1 до D1. КЛЮЧЕВЫЕ ОСОБЕННОСТИ Мультитаймфреймовый анализ: M1, M5, M15, M30, H1, H4, D1 на одном графике Автоматические уровни: High, Low, Buy Zone
Официальный доступ к экосистеме BlueDigitsFx Получайте обновления инфраструктуры, рабочие материалы, новые продукты и доступ к официальной экосистеме BlueDigitsFx. Экосистема Telegram Веб-сайт Версия MT4 BlueDigitsFx Spike And Strike Reversal MT5 — Комбинированный осциллятор для анализа рыночных разворотов и импульса BlueDigitsFx Spike And Strike Reversal — это комбинированный осциллятор, объединяющий несколько индикаторных сигналов, чтобы помочь трейдерам выявлять возможные развороты рынка,
Smart Trendlines – No.1 Trendlines Indicator Smart Trendlines is a precision tool that automatically draws trendlines based on every valid pivot point, helping traders identify key support and resistance zones. It continuously adjusts as new market pivots form, providing a live and accurate reflection of price structure. Whether you’re tracking trends, preparing for reversals, or anticipating breakouts — this indicator keeps you one step ahead. It works seamlessly across all assets including For
Headline: Stop Guessing, Start Winning. Unleash the Power of the Heiken Ashi Supertrend Indicator. Body: Are you tired of market noise, confusing charts, and missed opportunities? The Heiken Ashi Supertrend Indicator is the ultimate tool designed to bring clarity and confidence to your trading, once and for all. We've combined two of the most powerful concepts in technical analysis into one seamless, easy-to-use indicator: Crystal-Clear Trends with Heiken Ashi: Say goodbye to choppy price action
Smc Session Killzone and Breakout The Smc Session Killzone and Breakout indicator automates the institutional session trading model for MetaTrader 5. It draws the Asian, London, and New York session ranges as labelled boxes on the chart, detects when price sweeps beyond the Asian session high or low, and fires a non-repainting entry signal after a Market Structure Shift is confirmed. All signals are based on closed bars and do not repaint. The underlying model follows the sequence that institut
FREE
SMC Alpha Engine SMC Alpha Engine is a Smart Money Concepts indicator for MetaTrader 5 designed to identify Order Blocks, Fair Value Gaps, Liquidity Sweeps, and market structure changes directly on the chart. The indicator focuses on displaying the most recent valid Order Block together with automatically calculated TP and SL levels for simplified chart analysis. Main Features Automatic Order Block detection Buy and Sell zone visualization Automatic TP and SL calculation Fair Value Gap (FVG) det
"Adjustable Fractals" - это расширенная версия индикатора фракталов, очень полезный инструмент для торговли! - Как мы знаем, стандартный индикатор fractals MT5 вообще не имеет настроек - это очень неудобно для трейдеров. - Adjustable Fractals решил эту проблему - в нем есть все необходимые настройки: - Настраиваемый период индикатора (рекомендуемые значения - выше 7). - Настраиваемое расстояние от максимумов/минимумов цены. - Настраиваемый дизайн фрактальных стрелок. - Индикатор имеет встроенны
Footprint — индикатор для анализа order flow и объёма. Он помогает определять структуру рынка на уровне кластеров, находить ключевые зоны с повышенной активностью и работать с фильтрами прямо на графике, без постоянного открытия окна настроек. Возможности индикатора Footprint кластерный график Bid x Ask, Delta; панель управления на графике; слайдеры для настройки фильтров; Absorption; Initiative; Stacked Imbalances; Big Trades; dPOC / Dynamic Point of Control; Delta; боковой профиль рынка; кумул
Это, пожалуй, самый полный индикатор автоматического распознавания гармонического ценообразования, который вы можете найти для платформы MetaTrader. Он обнаруживает 19 различных паттернов, воспринимает проекции Фибоначчи так же серьезно, как и вы, отображает зону потенциального разворота (PRZ) и находит подходящие уровни стоп-лосс и тейк-профит. [ Руководство по установке | Руководство по обновлению | Устранение неполадок | FAQ | Все продукты ] Он обнаруживает 19 различных гармонических ценов
MTF MA Color Candles Alert helps traders read moving-average context faster by replacing regular candles with four customizable candle colors. The indicator can use the current timeframe or a selected higher timeframe moving average. For example, a trader can view M5 price action while coloring the candles from an H1 or H4 moving average condition. Main features: - Multi-timeframe MA source: current, M5, M15, M30, H1, H4, D1, and W1 - Moving average period, method, and applied price are adjus
Multi-Timeframe PO3 Projection Multi-Timeframe PO3 Projection is a clean and practical MetaTrader 5 indicator designed to project multiple higher-timeframe candles directly on your active chart. Instead of switching between H1, H4, D1, and other higher timeframes, this indicator lets you view their live candle structure side by side. It helps traders track the current higher-timeframe open, high, low, close, and candle direction while staying on the chart timeframe they are actively trading. The
Индикатор Balance of Power (BOP) с поддержкой мультитаймфрейма, настраиваемыми визуальными сигналами и конфигурируемой системой оповещений. Услуги фриланс-программирования, обновления и другие продукты TrueTL доступны в моём профиле MQL5 . Отзывы и рецензии очень приветствуются! Что такое BOP? Balance of Power (BOP) — это осциллятор, который измеряет силу покупателей по сравнению с продавцами, сравнивая изменение цены с диапазоном бара. Индикатор рассчитывается как (Закрытие - Открытие) / (Ма
FREE
This is FVG PRO with our Indication Panel. The FVG LITE is available for free without the side panel. Watch the FVG Indicator v2 work live on the chart. This tool automatically detects Fair Value Gaps,  price imbalances where the market moved too fast and left unfinished business, and flags them as potential support and resistance zones. The panel on the left shows the trend direction across four timeframes simultaneously, so you can see at a glance whether the big picture agrees with what pr
CRT Candle Range Theory HTF MT5.   Ultimate CRT Indicator: Advanced ICT Concepts and Malaysian SnR Trading System Master the Market Maker's Footprints with the Most Advanced Candle Range Theory Indicator Discounted   Price $50  !!     Secure your lifetime access now before it switches to subscription-only ! Unlock the true power of Smart Money Concepts (SMC) and trade precisely like the institutions with the Ultimate CRT Indicator . Built exclusively for serious traders, this indicator automate
BTFX Pivot Points
Bradley Thomas Farrington
BTFX Pivot Points - это индикатор, который рассчитывает уровни поддержки и сопротивления на каждый день. Используя этот индикатор, уровни разворота указывают на четкие цели, к которым нужно стремиться.   Уровни сопротивления показаны фиолетовым цветом над серебряной разворотной линией.   Уровни поддержки   приведены в Orange   и могут быть найдены   ниже   серебро   поворот   линии .   Эти индикаторы очень хорошо работают при использовании с индикатором рассвета BTFX.   Для более подробного объя
С этим продуктом покупают
SuperScalp Pro
Van Minh Nguyen
4.69 (29)
SuperScalp Pro – Профессиональная многослойная скальпинговая система с подтверждением сигналов SuperScalp Pro — это профессиональная многослойная скальпинговая система с подтверждением сигналов по нескольким факторам, разработанная для поиска торговых возможностей с более высокой вероятностью успеха. Она предоставляет более точные подтверждения входа, уровни Stop Loss и Take Profit на основе ATR, а также гибкую систему фильтрации сигналов для XAUUSD, BTCUSD и основных валютных пар Forex. Полная
Этот продукт был обновлен для рынка 2026 года и оптимизирован для последних сборок MT5. УВЕДОМЛЕНИЕ ОБ ИЗМЕНЕНИИ ЦЕНЫ: Smart Trend Trading System сейчас доступен за $99 . Цена увеличится до $199 после следующих 30 покупок . СПЕЦИАЛЬНОЕ ПРЕДЛОЖЕНИЕ: После покупки Smart Trend Trading System отправьте мне личное сообщение, чтобы получить Smart Universal EA БЕСПЛАТНО и превратить сигналы Smart Trend в автоматические сделки. Smart Trend Trading System — это полноценная торговая система без перерисов
Давайте сначала будем честны. Ни один индикатор сам по себе не сделает вас прибыльным. Если кто-то говорит вам обратное — он продаёт вам мечту. Любой индикатор, который показывает идеальные стрелки покупки/продажи, можно сделать безупречным — просто увеличьте нужный участок истории и сделайте скриншот успешных сделок. Мы так делать не будем. SMC Intraday Formula — это инструмент. Он считывает структуру рынка за вас, определяет зоны с наивысшей вероятностью движения цены и точно показывает, как
Neuro Poseidon - новый индикатор от Дарьи Резуевой. Он сочетает точные торговые сигналы с адаптивными уровнями TP/SL , в результате создавая максимально выгодные сделки! TO SWITCH TO   ENG   PLEASE CHOOSE IT IN THE UPPER-RIGHT CORNER OF THE WEBSITE Напишите мне и получите  Neuro Poseidon Assistant  в подарок для автоматизации вашей торговли! Что отличает его от других индикаторов? 1. Доказанная прибыльность на всех активах и таймфреймах 2. На графике присутствуют только подтвержденные сигналы н
Trend Sniper X
Sarvarbek Abduvoxobov
5 (6)
Trend Sniper X — это индикатор следования за трендом с несколькими таймфреймами для MetaTrader 5, который помогает трейдерам четко и точно определять направление тренда и потенциальные точки разворота. Информация о цене: Текущая цена является промо-ценой и может измениться по мере выпуска обновлений и новых функций. Канал Code2Profit Освойте рынок с помощью анализа нескольких таймфреймов! Технические характеристики Платформа MetaTrader 5 Тип индикатора Трендовый индикатор с несколькими таймфрейм
Welcome to ENTRY IN THE ZONE AND SMC MULTI TIMEFRAME Entry In The Zone and SMC Multi Timeframe is a professional trading indicator built on Smart Money Concepts (SMC) , combining market structure analysis with a No Repaint BUY / SELL signal system in a single indicator. It helps traders understand market structure more clearly, identify key price zones, and focus on higher-quality trading opportunities. By combining Multi-Timeframe Analysis , Points of Interest (POIs) , and real-time signals, th
M1 Quantum MT5
Hamed Dehgani
4.56 (9)
Торговые сигналы в реальном времени с использованием M1 Quantum: Сигнал  (Сделка выполнена автоматически с помощью Quantum Trade Assistant , бесплатно включённого в этот продукт.) План цен: Текущая цена: $169 (Предложение для ранних пользователей) Следующая запланированная цена: $189 Планируемая розничная цена: $299 Developer Note: После покупки свяжитесь со мной, чтобы получить последний рекомендуемый set-файл , полезные рекомендации по настройке, а также приглашение в VIP-группу поддержки , г
Легенда возвращается! Entry Points Pro 10. Перезапуск легендарного индикатора, который 3 года держался в Топ-3 MQL5 Market. Сотни восторженных отзывов (589 на две версии), тысячи трейдеров торгуют с его помощью каждый день, 31 000+ скачиваний демо MT4+MT5. Я прочитал каждый ваш отзыв за пять лет — и вместо обещаний встроил в версию 10 ответы. От автора, который в рынке с 1999 года и ценит честность, свою репутацию и своих клиентов . Стартовая цена $99 действует только на первые 10 копий.   Сразу
Gann Made Easy   - это профессиональная, но при этом очень простая в применении Форекс система, основанная на лучших принципах торговли по методам господина У.Д. Ганна. Индикатор дает точные BUY/SELL сигналы, включающие в себя уровни Stop Loss и Take Profit. ПОЖАЛУЙСТА, СВЯЖИТЕСЬ СО МНОЙ ПОСЛЕ ПОКУПКИ, ЧТОБЫ ПОЛУЧИТЬ ТОРГОВЫЕ ИНСТРУКЦИИ И ОТЛИЧНЫЕ ДОПОЛНИТЕЛЬНЫЕ ИНДИКАТОРЫ БЕСПЛАТНО! Вероятно вы уже не раз слышали о торговли по методам Ганна. Как правило теория Ганна отпугивает от себя не только
M1 SNIPER   — это простая в использовании торговая система. Это стрелочный индикатор, разработанный для тайм фрейма M1. Индикатор можно использовать как отдельную систему для скальпинга на тайм фрейме M1, а также как часть вашей существующей торговой системы. Хотя эта торговая система была разработана специально для торговли на M1, ее можно использовать и с другими тайм фреймами. Первоначально я разработал этот метод для торговли XAUUSD и BTCUSD. Но я считаю этот метод полезным и для торговли на
Power Candles V3 — самооптимизирующийся индикатор силы Power Candles V3 преобразует силу валюты и инструмента в готовый к использованию торговый план на каждом графике, к которому он прикреплен. Вместо того, чтобы просто раскрашивать свечи, он выполняет автоматическую оптимизацию в режиме реального времени в фоновом режиме и предоставляет вам оптимальные значения Stop Loss, Take Profit и порог сигнала для выбранного вами символа. Один клик — и все готово для реальной торговли: на графике появляю
GoldenX Entry — это индикатор для MT5 с адаптивным алгоритмом Smart Entry Trend, системой оценки сигналов, детектором рыночных режимов и фильтром волатильности. Каждый сигнал включает рассчитанный уровень входа, три уровня Take-Profit (TP1, TP2, TP3) и уровень Stop-Loss. Он построен на нескольких аналитических слоях, предназначенных для адаптации к различным рыночным условиям, объединяя многоуровневую аналитическую систему со встроенным оптимизатором и системой статистического отслеживания. Инди
Каждый покупатель этого индикатора получает дополнительно Бесплатно: Авторскую утилиту "Bomber Utility", которая автоматически сопровождает каждю торговую операцию, устанавливает уровни Стоп Лосс и Тейк профит и закрывает сделки согласно правилам этой стратегии, Сет-файлы для настройки этого индикатора на различных активах, Сет-файлы для настройки Bomber Utility в режимы: "Минимум Риска", "Взвешенный Риск" и "Стратегия Выжидания", Пошаговый видео-мануал, который поможет вам быстро установить, на
Crystal Heikin Ashi Signals - Professional Trend & Signal Detection Indicator Advanced Heikin Ashi Visualization with Intelligent Signal System for Manual & Automated Trading Final Price: $149 ---------> Price goes up $10 after every 10 sales . Limited slots available — act fast . Overview Crystal Heikin Ashi Signals is a professional-grade MetaTrader 5 indicator that combines pure Heikin Ashi candle visualization with an advanced momentum-shift detection system. Designed for both manual traders
ARIPoint
Temirlan Kdyrkhan
1 (1)
ARIBot is a powerful trading companion designed to generate high-probability entry signals with dynamic TP/SL/DP levels based on volatility. Built-in performance tracking shows win/loss stats, PP1/PP2 hits, and success rates — all updated live. Key Features: Buy/Sell signals with adaptive volatility bands Real-time TP/SL/DP levels based on ATR Built-in MA Filter with optional ATR/StdDev volatility Performance stats panel (Success, Profit/Loss, PP1/PP2) Alerts via popup, sound, push, or email Cus
Currency Strength Wizard   — очень мощный индикатор, предоставляющий вам комплексное решение для успешной торговли. Индикатор рассчитывает силу той или иной форекс-пары, используя данные всех валют на нескольких тайм фреймах. Эти данные представлены в виде простых в использовании индексов валют и линий силы валют, которые вы можете использовать, чтобы увидеть силу той или иной валюты. Все, что вам нужно, это прикрепить индикатор к графику, на котором вы хотите торговать, и индикатор покажет вам
Этот продукт был обновлен для рынка 2026 года и оптимизирован для последних сборок MT5. УВЕДОМЛЕНИЕ ОБ ИЗМЕНЕНИИ ЦЕНЫ: Atomic Analyst сейчас доступен за $99 . Цена увеличится до $199 после следующих 30 покупок . СПЕЦИАЛЬНОЕ ПРЕДЛОЖЕНИЕ: После покупки Atomic Analyst отправьте мне личное сообщение, чтобы получить Smart Universal EA БЕСПЛАТНО и превратить сигналы Atomic Analyst в автоматические сделки. Atomic Analyst — это индикатор Price Action без перерисовки, без перерисовывания истории и без
Reversion King Indicator
Eugen-alexandru Zibileanu
5 (5)
Новый король в городе — Индикатор + управление ордерами (TP1 + TP2 + TP3) + опциональный Telegram-сигнал-сендер ВКЛЮЧЁН (БЕСПЛАТНО) (ПОЛНОЦЕННАЯ ТОРГОВАЯ И СИГНАЛЬНАЯ СИСТЕМА) Gold Slayer EA Этот индикатор включает в себя продвинутую стратегию, торговую систему с настраиваемым управлением ордерами и систему mean reversion, которая сочетает расширения Envelope и поддерживается несколькими интеллектуальными фильтрами подтверждения, такими как RSI, для поиска высоковероятных точек разворота с сигн
Quantum TrendPulse
Bogdan Ion Puscasu
5 (25)
Представляем   Quantum TrendPulse   , совершенный торговый инструмент, который объединяет мощь   SuperTrend   ,   RSI   и   Stochastic   в один комплексный индикатор, чтобы максимизировать ваш торговый потенциал. Разработанный для трейдеров, которые ищут точность и эффективность, этот индикатор помогает вам уверенно определять рыночные тренды, сдвиги импульса и оптимальные точки входа и выхода. Основные характеристики: Интеграция SuperTrend:   легко следуйте преобладающим рыночным тенденциям и п
IX Power MT5
Daniel Stein
4.92 (13)
IX Power: Получите рыночные инсайты для индексов, сырьевых товаров, криптовалют и форекс Обзор IX Power — это универсальный инструмент для анализа силы индексов, сырьевых товаров, криптовалют и форекс. В то время как FX Power предлагает наивысшую точность для валютных пар, используя данные всех доступных пар, IX Power фокусируется исключительно на данных рынка базового символа. Это делает IX Power отличным выбором для некорреляционных рынков и надежным инструментом для форекса, если вам не нуж
Gold Scalper Pro PSAR ADX Dashboard MT5 Профессиональный многоинтервальный индикатор с продвинутым распознаванием сигналов Обзор Parabolic SAR V3 + ADX — это сложный технический индикатор, который объединяет возможности трендовой модели Parabolic Stop and Reverse (PSAR) с измерением силы импульса с помощью индекса Average Directional Index (ADX). Эта улучшенная версия включает оптимизацию для конкретных валютных пар, систему многоязычных уведомлений и подробную панель многовременных интервалов д
ограниченное количество копий по стартовой цене ZORYK — продвинутая сигнальная система для XAUUSD в MetaTrader 5 Вам знакомо это чувство. Вы анализируете золото, ждёте вход и наконец открываете сделку. Цена сразу начинает двигаться против вас. Вы закрываете позицию слишком рано, переносите Stop Loss или сомневаетесь несколько секунд. А затем рынок без вас достигает именно той цели, которую вы ожидали с самого начала. Проблема не всегда была в направлении. Настоящая проблема была в неопред
KAMA Confluence Engine Торгуйте по тренду — и знайте свою точку входа, стоп и цели в момент его разворота. KAMA Confluence Engine — это универсальный трендовый индикатор, построенный вокруг адаптивной скользящей средней Кауфмана (KAMA), усиленный учётом тикового объёма, мульти‑таймфрейм подтверждением и автоматическими торговыми уровнями. Он адаптируется к рынку: быстрый и чувствительный в трендах, спокойный и фильтрующий шум во флэте — чтобы вы оставались на правильной стороне движения без лишн
Smc Pro ToolKit
Talal N Z Aljarusha
5 (3)
SMC Pro ToolKit  is a professional chart-based Smart Money Concepts indicator for MetaTrader 5. It helps traders read market structure, identify key liquidity areas, organize trade context, and plan setups directly from the chart. This is not a simple buy/sell arrow indicator. It is a complete visual trading toolkit that combines Smart Money Concepts, multi-timeframe analysis, session context, setup planning, risk assistance, and professional dashboard tools in one clean workspace. Watch setup
FX Power: Анализируйте силу валют для более эффективной торговли Обзор FX Power — это ваш незаменимый инструмент для понимания реальной силы валют и золота в любых рыночных условиях. Определяя сильные валюты для покупки и слабые для продажи, FX Power упрощает принятие торговых решений и выявляет высоковероятные возможности. Независимо от того, хотите ли вы следовать за трендами или предсказывать развороты с использованием экстремальных значений дельты, этот инструмент идеально адаптируется под
Quant Direction — это инструмент трехмерного анализа рынка. Он обеспечивает полностью объективный, основанный на алгоритмах анализ рынка, одновременно вычисляя точные процентные отклонения по нескольким параметрам. Разработанный с использованием передовых инструментов моделирования на основе искусственного интеллекта и тщательно протестированный, алгоритм предназначен для интерпретации рынка с уникальной точностью. Он может анализировать любую валютную пару или финансовый инструмент на вашей пла
Btmm state engine pro
Garry James Goodchild
5 (4)
BTMM State Engine Pro is a MetaTrader 5 indicator for traders who use the Beat The Market Maker approach: Asian session context, kill zone timing, level progression, peak formation detection, and a multi-pair scanner from a single chart. It combines cycle state logic with a built-in scanner dashboard so you do not need the same tool on many charts at once. What it does Draws the Asian session range; session times can follow broker server offset or be set in inputs. Tracks level progression (L
Этот продукт был обновлен для рынка 2026 года и оптимизирован для последних сборок MT5. УВЕДОМЛЕНИЕ ОБ ИЗМЕНЕНИИ ЦЕНЫ: Smart Price Action Concepts сейчас доступен за $200 . Цена увеличится до $299 после следующих 30 покупок . СПЕЦИАЛЬНОЕ ПРЕДЛОЖЕНИЕ: После покупки отправьте мне личное сообщение, чтобы получить БЕСПЛАТНЫЙ бонус + подарок . Прежде всего, стоит подчеркнуть, что этот торговый инструмент является индикатором без перерисовки, без перерисовывания истории и без запаздывания, что делает
UZFX {SSS} Scalping Smart Signals v4.0 MT5 — это высокопроизводительный торговый индикатор без перерисовки, разработанный для скальперов, дейтрейдеров и свинг-трейдеров, которым требуются точные сигналы в режиме реального времени на быстро меняющихся рынках. Разработанный компанией (UZFX-LABS), этот индикатор сочетает в себе анализ ценового действия, подтверждение тренда и интеллектуальную фильтрацию для генерации высоковероятных сигналов на покупку и продажу, предупреждающих сигналов и возможно
AXIOM MATRIX MT5 СТАРТОВАЯ ЦЕНА: $99 Axiom Matrix доступен по стартовой цене $99. Цена увеличится до $199 после первых 30 покупок. После покупки напишите мне в личные сообщения, чтобы получить инструкции и забрать свой эксклюзивный подарочный бонус. Axiom Matrix — это профессиональный мультисимвольный и мультитаймфреймный рыночный сканер и панель принятия решений для MetaTrader 5. Он сканирует ваш Market Watch, анализирует несколько таймфреймов, считывает несколько движков подтверждений, сравнив
Фильтр:
Нет отзывов
Ответ на отзыв