HotZone

🔥 HotZone

Visualize Where Price Wants to Go.
  1. "Why does price keep bouncing at this level?"
  2. "Why does it always consolidate in this zone?"
  3. "Where is the next support or resistance?"
If you've ever stared at a chart asking these questions, the answer often lies in Price Density.
Price zones where market participants repeatedly buy and sell naturally accumulate "density."
HotZone is an MT5-exclusive Price Density Analysis Indicator that visualizes this density in real time.

MT5 OnlyM1 to MNCustom Indicator

⚠️ HotZone is a custom indicator for MT5. It is NOT an Expert Advisor (EA) and does not trade automatically.

Who is this for?

✅ Perfect For Traders Who...

  • Draw support & resistance "by feel" and want more precision
  • Need to quickly identify key price zones for day trading
  • Want to track weekly/monthly key zones for swing trading
  • Need to instantly check how price relates to their MAs
  • Want a clean chart without sacrificing information density
  • Want to eliminate the tedious manual work of multi-TF analysis

Section 01

Product Overview

What Is HotZone?

HotZone is a custom indicator exclusively for MetaTrader 5 (MT5).

It goes far beyond simple lines or oscillators. HotZone analyzes historical price data — counting how many times price visited each price band — and visualizes that density as a color heatmap directly on your chart.

What Is Price Density Analysis?

Price density analysis is a quantitative method of evaluating how frequently price visited a given price band within a specific time period.

|

| Density Level | Meaning | Chart Behavior

| High Density (Hot Zone) | A zone where many traders have historically bought and sold | Likely to act as strong support or resistance in the future

| Low Density (Cold Zone) | A zone where very little trading activity occurred | Price tends to pass through smoothly — breakouts are more likely

This concept is well-established as the Value Area and Congestion Zone analysis used by professional traders and institutional investors. HotZone automates and visualizes this analysis directly on your MT5 chart.

Problems HotZone Solves

|

| Common Pain Point | HotZone's Solution

| Hard to identify reliable support/resistance | Density heatmap instantly shows price concentration zones

| Multi-TF analysis is time-consuming | All TFs from M1 to MN switch and display automatically

| Confusing MA relationships at a glance | MA Table ranks price and MAs in order at all times

| Charts become cluttered with too many tools | Clean heatmap visualization keeps charts readable

| Drawing high/low lines manually is tedious | High and low lines are drawn automatically per period block

Section 02

Features & Strengths

🔬

Quantitative & Objective Analysis

Instead of "gut-feel" support/resistance, HotZone uses numerical price density data. Two traders looking at the same chart will reach the same conclusions.

🕐

Optimized for Every Timeframe

From M1 to MN, each timeframe has its own optimized period block for density calculation. Just switch TFs — the density map adapts automatically.

📊

Information-Rich Yet Clean

The combination of heatmap + MA Table gives you everything you need while keeping the chart uncluttered. No need to stack multiple indicators.

High-Performance Design

The MaxPeriods limit keeps rendering fast. All parameters switch automatically on TF change — no manual reconfiguration needed.

🎨

Fully Customizable

Color scheme, band width, analysis depth, MA type, and table size — everything is adjustable. Works on both dark and light chart themes.

Section 03

Key Features

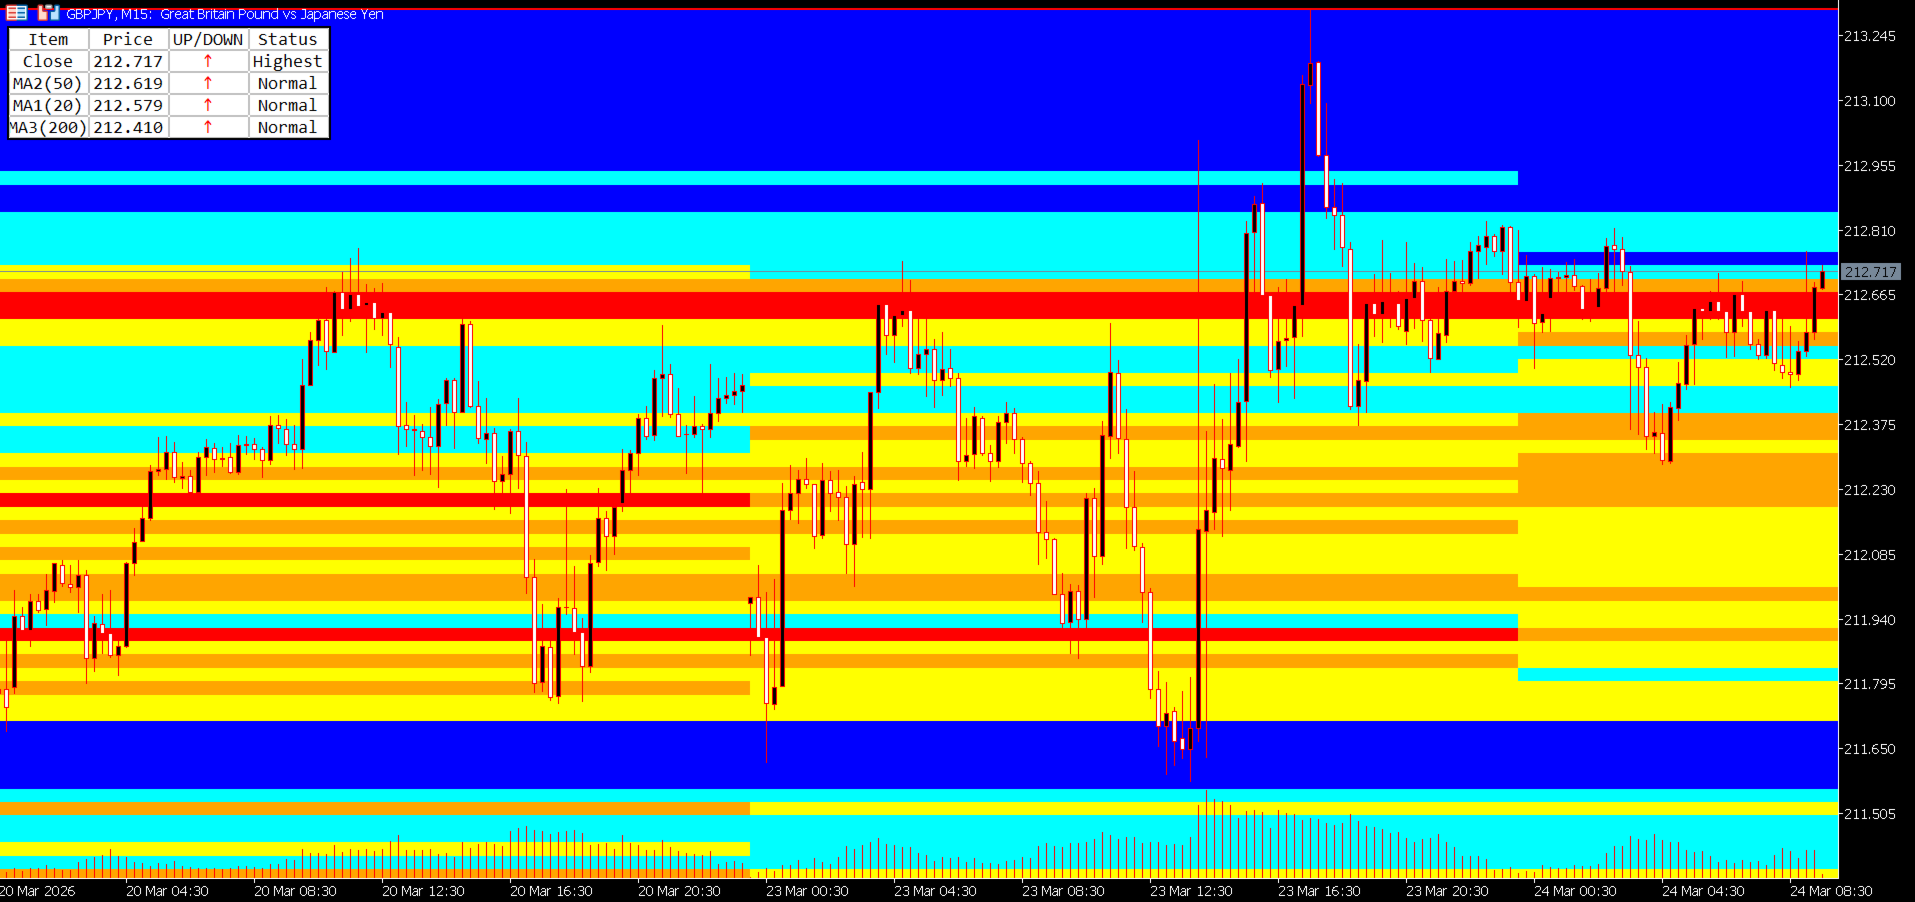
■ Feature 1: 5-Level Color Price Density Heatmap

The core of HotZone. For each period block, it analyzes price data and counts how many times price (close) visited each pip-width band. That density is then displayed as a 5-level color heatmap.

Level 5 (Red)Highest density zone — 80% or more of peak density

Level 4 (Orange)High density zone — 60–79%

Level 3 (Yellow)Medium density zone — 40–59%

Level 2 (Aqua)Low density zone — 20–39%

Level 1 (Blue)Lowest density zone — below 20%

All colors are fully customizable to match your chart style.


■ Feature 2: Multi-Timeframe Support with Auto Period Blocks

HotZone supports all timeframes from M1 to MN (Monthly). Simply change the timeframe and the optimal period blocks are automatically configured.

|

| Timeframe | Period Block Boundary | Density Unit

| M1 (1-minute) | Every 2 hours | 2-hour block density

| M5 (5-minute) | Every 12 hours (00:00 / 12:00) | Half-day block density

| M15 (15-minute) | Daily (00:00) | Daily block density

| M30 (30-minute) | Half-week (Mon 00:00 / Wed 12:00) | Half-week block density

| H1 (1-hour) | Weekly (from Monday) | Weekly block density

| H4 (4-hour) | Half-month (1st / 16th) | Half-month block density

| D1 (Daily) | Every 6 months (Jan / Jul) | Semi-annual block density

| W1 (Weekly) | Annually (January) | Annual block density

| MN (Monthly) | Annually (January) | Annual block density


■ Feature 3: Automatic High/Low Line Drawing

HotZone automatically draws High and Low lines for each period block, marking the highest and lowest price reached within that block. These lines serve as dynamic support/resistance references. Colors are customizable, and lines update automatically at each period boundary.


■ Feature 4: Band Grid Lines (Optional)

Set IsDrawBandLine = true to display the underlying band grid used for density calculation directly on the chart.

|

| Timeframe | Default Band Width

| M1 | 1 pip

| M5 | 2 pips

| M15 | 3 pips

| M30 | 5 pips

| H1 | 10 pips

| H4 | 25 pips

| D1 | 50 pips

| W1 | 100 pips

| MN | 250 pips


■ Feature 5: MA Table (Moving Average Analysis Table)

A compact table in the top-left of your chart displays the current price alongside 3 moving averages, sorted by price in real time.

|

| Item | Price | Direction | Status

| Close | Current price | ↑↓ | Normal / Highest / Lowest

| MA1 (20) | MA1 value | ↑↓ | Normal / Highest / Lowest

| MA2 (50) | MA2 value | ↑↓ | Normal / Highest / Lowest

| MA3 (200) | MA3 value | ↑↓ | Normal / Highest / Lowest

↑ (red): price rose from previous bar  /  ↓ (blue): price fell  /  - (black): unchanged

Highest: highest value within the lookback period  /  Lowest: lowest value  /  Normal: standard


■ Additional Smart Features

Auto Timeframe Switching: All parameters auto-adjust when you change the TF — no manual reconfiguration needed

DPI Scaling Support: The MA Table renders correctly on high-resolution and 4K displays

Performance Optimization: MaxPeriods limits rendering to only the range you need

Universal Symbol Support: Works with any MT5 symbol — FX pairs, Gold, Oil, Indices, and more


Section 04

How to Use HotZone in Your Trading

▶ Day Traders

Recommended Timeframes: M1, M5, M15

Example scenario: Trading USD/JPY during the Tokyo session on M5

  • Review the previous day's M5 heatmap → Identify the red and orange zones from yesterday's morning (00:00–12:00) and afternoon (12:00–24:00) blocks
  • At the Tokyo open (09:00), check current price position → Is price near yesterday's high-density zone (red)?
  • Price approaches a red zone → Consider a mean-reversion entry anticipating a bounce
  • Confirm MA20 direction in the MA Table → ↑ favors long, ↓ favors short
  • Target the next high-density zone as take profit → Use the distance between red zones as your TP guideline

💡 M1/M5 heatmaps use 2-hour and half-day blocks, making it easy to pinpoint hot zones within the current session. Effective for scalpers too.

▶ Swing Traders

Recommended Timeframes: H1, H4, D1

Example scenario: Swing trading EUR/USD on the H4 chart

  • Switch to D1 → Identify the red zones (highest density) from the last 6-month block — these are your key medium-term support/resistance candidates
  • Switch to H4 → Check if the half-month block's red zones overlap with D1 zones (confluence check)
  • Confirm MA50 and MA200 positions in the MA Table → Use the price-vs-MA arrangement to determine medium-term trend direction
  • Use H1 to time your entry → Check the weekly block heatmap on Monday to identify the week's key zones
  • Set stop-loss just below the auto-drawn Low Line of the most recent period block

💡 Overlapping D1 (6-month blocks) and H4 (half-month blocks) makes it easy to spot multi-timeframe confluence zones with high conviction.

▶ Professional Traders

Recommended Approach: Multi-TF confluence analysis

Professional traders focus on "confluence zones" — areas where density is high across multiple timeframes simultaneously.

  • W1 heatmap: Identify annual-level key zones (red) → establish the long-term value area baseline
  • D1 heatmap: Confirm whether those zones are also high-density in the 6-month block → validate with medium-term data
  • H4 heatmap: Check if the same zone is still high-density in the half-month block → confirm short-term market interest
  • H1 heatmap: Confirm weekly block density → narrow down your entry window
  • MA Table: Review the arrangement of Close, MA20, MA50, MA200 → gauge trend strength and direction
  • A zone where 2–3 TFs show high density → Maximum Confluence Zone → Highest-confidence entry point

【Long Setup Example】✓ Price approaches the lower edge of W1 red zone✓ D1 red / orange zone also present at the same level✓ MA Table: MA200 < MA50 < MA20 < Close (bullish alignment)✓ MA Table: MA20 direction arrow = ↑ (rising)→ Strong support confluence → Long entry candidate【Short Setup Example】✓ Price approaches the upper edge of H4 red zone✓ D1 red zone also aligns at the same level✓ MA Table: Close < MA20 < MA50 (bearish alignment)✓ MA Table: MA20 direction arrow just flipped to ↓→ High-density zone rejection → Short entry candidate

▶ Entry & Exit Summary

|

| Use Case | Market Condition | Action

| Counter-trend entry | Price approaching a high-density zone (red/orange) | Bounce entry candidate

| Breakout entry | Price breaking through a high-density zone | Breakout entry (confirm momentum first)

| Trend following | Price passing through a low-density zone (blue) | Hold / continue in trend direction

| Take Profit (TP) | Next high-density zone ahead | Use as TP price target

| Stop Loss (SL) | Break of high/low auto-drawn line | Use as SL reference

| Position scaling | MA direction reverses in MA Table | Consider partial close


Section 05

Parameter Reference

─ General Display Settings ─

|

| Parameter | Default | Description

| MaxPeriods | 10 | Maximum number of period blocks to process and display. 0 = all periods. Lower values reduce chart processing load.

| HighLineColor | Red | Color of the high line for each period block

| LowLineColor | Red | Color of the low line for each period block

| IsDrawBandLine | false | Set to true to display the band grid lines on the chart

| BandLineColor | Silver | Color of band grid lines. Light colors (Silver, LightGray) recommended.


─ Heatmap Color Settings ─

|

| Parameter | Default | Density Level

| BandBgColor5 | Red | Level 5 — Highest density (≥ 80% of peak)

| BandBgColor4 | Orange | Level 4 — High density (60–79%)

| BandBgColor3 | Yellow | Level 3 — Medium density (40–59%)

| BandBgColor2 | Aqua | Level 2 — Low density (20–39%)

| BandBgColor1 | Blue | Level 1 — Lowest density (< 20%)


─ Per-TF Analysis Period (Number of Bars) ─

More bars = wider historical lookback. Fewer bars = density based on more recent data.

|

| Parameter | Default | Approximate Coverage

| AnalysisPeriodM1 | 1440 bars | ≈ 1 day

| AnalysisPeriodM5 | 1440 bars | ≈ 5 days

| AnalysisPeriodM15 | 1440 bars | ≈ 15 days

| AnalysisPeriodM30 | 1440 bars | ≈ 30 days

| AnalysisPeriodH1 | 1440 bars | ≈ 60 days

| AnalysisPeriodH4 | 1440 bars | ≈ 240 days

| AnalysisPeriodD1 | 1200 bars | ≈ 5 years

| AnalysisPeriodW1 | 520 bars | ≈ 10 years

| AnalysisPeriodMN | 240 bars | ≈ 20 years


─ Per-TF Band Width (pips) ─

|

| Parameter | Default | Notes

| BandWidthPipsM1 | 1 pip | Fine granularity for scalping

| BandWidthPipsM5 | 2 pips |

| BandWidthPipsM15 | 3 pips |

| BandWidthPipsM30 | 5 pips |

| BandWidthPipsH1 | 10 pips |

| BandWidthPipsH4 | 25 pips |

| BandWidthPipsD1 | 50 pips |

| BandWidthPipsW1 | 100 pips |

| BandWidthPipsMN | 250 pips | Coarse granularity for monthly

💡 Default values work well for major FX pairs (USD/JPY, EUR/USD, etc.). For high-volatility instruments (XAU/USD, exotic crosses), consider widening band widths by 1.5–2×.


─ MA Table Settings ─

|

| Parameter | Default | Description

| ShowMATable | true | Set to false to hide the MA Table

| MA1Period | 20 | Calculation period for MA1 (short-term MA)

| MA2Period | 50 | Calculation period for MA2 (medium-term MA)

| MA3Period | 200 | Calculation period for MA3 (long-term / trend MA)

| MA1Method / MA2Method / MA3Method | SMA | Choose from: SMA / EMA / SMMA / LWMA

| LookbackBars | 20 | Number of bars used for Highest / Lowest status detection

| HighestColor | Red | Text color for "Highest" status in MA Table

| LowestColor | Blue | Text color for "Lowest" status in MA Table

| UpArrowColor | Red | Color of the up arrow (↑) in MA Table

| DownArrowColor | Blue | Color of the down arrow (↓) in MA Table

| TableFontSize | 8 | Font size of the MA Table (pt)

| TableScale | 1.0 | Display scale of the MA Table. Recommended: 1.5–2.0 for 4K/WQHD displays.


Section 06

Installation & Setup Guide

Installation Steps

  • Purchase & Download: After purchasing on MQL5 Market, download HotZone from the "Market" tab inside MetaTrader 5.
  • Apply to Chart: In the MT5 Navigator panel → "Indicators" → drag and drop HotZone onto your desired chart.
  • Settings Dialog: A configuration dialog will appear. Click OK with the default settings to get started immediately.
  • Verify Display: Once the heatmap, high/low lines, and MA Table appear on the chart, setup is complete.

Recommended Settings by Use Case

|

| Scenario | Recommended Settings

| Major FX pairs (USD/JPY, EUR/USD, GBP/USD, etc.) | Band widths: default values / MaxPeriods: 10 / MA: 20, 50, 200 (SMA)

| High-volatility instruments (XAU/USD, exotic crosses, etc.) | Widen band widths 1.5–2× per TF (e.g. H1: 10 → 20 pips)

| High-resolution displays (4K / WQHD) | TableScale = 1.5–2.0 / TableFontSize = 10–12


Important Notes

⚠️ HotZone is MT5 only. It does not work on MT4.

⚠️ On first load, processing a large amount of historical data may take a few seconds to tens of seconds.

⚠️ If AnalysisPeriod is set very high, some brokers may not have sufficient historical data. A warning will appear in the console if data is insufficient.

⚠️ HotZone is an analysis tool. It does not generate trade signals automatically. All trading decisions remain your responsibility.


Section 07

Frequently Asked Questions


Does it work on MT4?

No. HotZone is MT5 only and is not compatible with MT4.


Which symbols does it support?

HotZone works with any symbol available in MT5 — FX pairs (major, minor, and exotic), precious metals (XAU/USD, XAG/USD), oil (USOIL), stock indices (US30, DAX40), and more.


Will it slow down my chart?

The MaxPeriods parameter limits the number of rendered period blocks to control performance. The default value of 10 runs smoothly on typical hardware (Core i5+, 8GB RAM). Reduce to 5 on lower-spec machines if needed.


Can I use it alongside other indicators?

Yes. HotZone renders in the chart window but does not conflict with other indicators. That said, too many overlapping indicators can reduce readability — manage the number of active indicators accordingly.


Do I need to reconfigure it every time I change the timeframe?

No. HotZone automatically switches to the optimal parameters when you change the timeframe. Band widths and analysis periods are all pre-optimized per TF and applied automatically.


Does it work with any broker?

It works with any MT5-compatible broker. However, the amount of available historical data varies by broker. On brokers with limited data history, longer-term TFs (W1, MN) may not produce fully accurate density calculations.


Will I receive updates after purchase?

Yes. When updates are released through MQL5 Market, your copy will be updated automatically at no additional cost.


Is there a refund policy?

Refund policy follows MQL5 Market terms. Please refer to the MQL5 help page for details.


Section 08

Version Information & Changelog

Version: 1.00

Last Updated: January 22, 2026

Developer: CAPS LLC

Website: https://traders.tokyo/

Platform: MetaTrader 5 (MT5)

Changelog

|

| Version | Date | Changes

| v1.00 | 2026-01-22 | Initial Release

  • 5-level color price density heatmap (M1 to MN, all timeframes)
  • Per-TF optimized period block auto-segmentation
  • MA Table (3 MAs + current price, direction arrows, DPI scaling support)
  • Automatic high/low line drawing per period block
  • Customizable band widths and analysis periods per TF

Disclaimer

HotZone is provided for informational and analytical purposes only. The developer and distributor accept no responsibility for any trading results arising from the use of this indicator. All trading and investment decisions are made at your own risk. Past price data and density patterns do not guarantee future performance.

© 2026 CAPS LLC. All rights reserved.  /  https://traders.tokyo/

Önerilen ürünler
Kst pro tools
Vincent Albert Feugier
KST Pro Tools – Smart Momentum Indicator Overview KST Pro Tools is an advanced momentum indicator based on Martin Pring’s classic Know Sure Thing (KST) . It has been redesigned to deliver a clean, instant, and unambiguous momentum reading , thanks to a smart and fully filtered histogram logic. This indicator shows only meaningful momentum , exactly when it matters. Indicator Components KST Line (blue) Measures the true strength of market momentum Built using 4 weighted and smoothed Rate
To review our products, please click the link: LINK This Classic Pivot Point Indicator accurately calculates and displays 7 essential pivot levels , including the Pivot Point , 3 Support levels (S1–S3) , and 3 Resistance levels (R1–R3) based on the standard classic pivot formula . Designed for Forex, indices, commodities, and crypto trading , it supports multi-currency and multi-timeframe analysis in a clean, professional dashboard interface . With the built-in interactive dashboard , traders c
CosmiCLab SMC FIBO CosmiCLab SMC FIBO is a professional trading indicator designed for traders who use Smart Money Concepts (SMC), market structure analysis and Fibonacci retracement levels. The indicator automatically detects market swings and builds Fibonacci levels based on the latest impulse movement. It also identifies market structure changes such as BOS (Break of Structure) and CHOCH (Change of Character), helping traders understand the current market direction. CosmiCLab SMC FIBO also pr
RBreaker
Zhong Long Wu
RBreaker Gold Indicators is a short-term intraday trading strategy for gold futures that combines trend following and intraday reversal approaches. It not only captures profits during trending markets but also enables timely profit-taking and counter-trend trading during market reversals. This strategy has been ranked among the top ten most profitable trading strategies by the American magazine   Futures Truth   for 15 consecutive years. It boasts a long lifecycle and remains widely used and st
Caicai L&S Yield Histogram Important Notice: This indicator is an integral tool of the automated EA Caicai Long and Short Pair Trading . This indicator visually displays the percentage deviation (Yield %) of a pair's current spread relative to its own historical mean. It is an excellent tool for quickly visualizing the gross financial potential of a market distortion in Long & Short operations. Main Features: Percentage Visualization: Understand the size of the distortion in palpable percentage
Pivot Points MT5 is a universal color multicurrency/multisymbol indicator of the Pivot Points levels systems. You can select one of its three versions: Standard Old, Standard New and Fibo . It plots pivot levels for financial instruments in a separate window . The system will automatically calculate the Pivot Point on the basis of market data for the previous day ( PERIOD_D1 ) and the system of support and resistance levels, three in each. A user can choose colors for the indicator lines. The on
Gold Trader Pro is an advanced analytical tool specifically engineered for professional trading on XAUUSD (Gold). It provides an immediate comprehensive overview of market structure across 7 different timeframes, allowing traders to identify flow direction and signal strength through a modern, draggable, and interactive interface. Key Features Multi-Timeframe Analysis: Real-time monitoring of M1, M5, M15, M30, H1, H4, and D1. Two Operational Modes: MODE_SCALPING: Optimized for fast-paced analys
FREE
Price Magnet — Price Density and Attraction Levels Indicator Price Magnet is a professional analytical tool designed to identify key support and resistance levels based on statistical Price Density. The indicator analyzes a specified historical period and detects price levels where the market spent the most time. These zones act as “magnets,” attracting price action or forming a structural base for potential reversals. Unlike traditional Volume Profile tools, Price Magnet focuses on price-time d
Key level wedge MT5
Presley Annais Tatenda Meck
The   Key level wedge MT5   indicator automatically draws rising wedge pattern and falling wedge pattern for you on the chart. This pattern is really good when used as a confirmation entry at key support & resistance, supply & demand and reversal zones. Advantages  The   Key level wedge MT5   block DOES NOT RE-PAINT, giving you confidence when a signal appears and also helps when looking back.  The   Key level wedge MT5   includes an on/off button on the chart to easily keep the charts clean
Advanced Support and Resistance Support and resistance levels are widely used in trading. They are important as they show some key price levels. Before applying any strategy, one may consider it necessary to draw support and resistance. However, this process can take much time especially if one is to analyse a lot of currency pairs, commodities or indices. This Advanced Support and Resistance tool was designed for traders at any level, amateur to professional. It plots key support and resistance
Smart Trendlines MT5
Suvashish Halder
5 (3)
Smart Trendlines – No.1 Trendlines Indicator Smart Trendlines is a precision tool that automatically draws trendlines based on every valid pivot point, helping traders identify key support and resistance zones. It continuously adjusts as new market pivots form, providing a live and accurate reflection of price structure. Whether you’re tracking trends, preparing for reversals, or anticipating breakouts — this indicator keeps you one step ahead. It works seamlessly across all assets including For
Heiken Ashi Supertrend Combine
Tri Yasin Satrio Adji Pranoto
Headline: Stop Guessing, Start Winning. Unleash the Power of the Heiken Ashi Supertrend Indicator. Body: Are you tired of market noise, confusing charts, and missed opportunities? The Heiken Ashi Supertrend Indicator is the ultimate tool designed to bring clarity and confidence to your trading, once and for all. We've combined two of the most powerful concepts in technical analysis into one seamless, easy-to-use indicator: Crystal-Clear Trends with Heiken Ashi: Say goodbye to choppy price action
"Ayarlanabilir Fraktallar" - fraktal göstergesinin gelişmiş bir versiyonudur, çok kullanışlı bir ticaret aracıdır! - Bildiğimiz gibi Standart fraktallar MT5  göstergesinin hiç ayarı yoktur - bu, yatırımcılar için çok elverişsizdir. - Ayarlanabilir Fraktallar bu sorunu çözmüştür - gerekli tüm ayarlara sahiptir: - Göstergenin ayarlanabilir periyodu (önerilen değerler - 7'nin üzerinde). - Fiyatın Yüksek/Düşük noktalarına ayarlanabilir mesafe. - Fraktal oklarının ayarlanabilir tasarımı. - Gösterged
Footprint is an indicator for order flow and volume analysis. It helps identify market structure at the cluster level, find key zones with increased activity, and work with filters directly on the chart without constantly opening the settings window. Footprint Indicator Features cluster-based Bid x Ask and Delta charts; on-chart control panel; sliders for filter adjustments; Absorption; Initiative; Stacked Imbalances; Big Trades; dPOC / Dynamic Point of Control; Delta; side market profile; cumul
L'indicatore SMC Venom Model BPR è uno strumento professionale per i trader che operano nell'ambito del concetto di Smart Money (SMC). Identifica automaticamente due modelli chiave sul grafico dei prezzi: FVG   (Fair Value Gap) è una combinazione di tre candele, in cui c'è un gap tra la prima e la terza candela. Forma una zona tra livelli in cui non c'è supporto di volume, il che spesso porta a una correzione dei prezzi. BPR   (Balanced Price Range) è una combinazione di due modelli FVG che for
Trade smarter, not harder: Empower your trading with Harmonacci Patterns This is arguably the most complete harmonic price formation auto-recognition indicator you can find for the MetaTrader Platform. It detects 19 different patterns, takes fibonacci projections as seriously as you do, displays the Potential Reversal Zone (PRZ) and finds suitable stop-loss and take-profit levels. [ Installation Guide | Update Guide | Troubleshooting | FAQ | All Products  ] It detects 19 different harmonic pric
Çoklu zaman dilimi desteği, özelleştirilebilir görsel sinyaller ve yapılandırılabilir uyarı sistemi ile Balance of Power (BOP) göstergesi. Serbest programlama hizmetleri, güncellemeler ve diğer TrueTL ürünleri MQL5 profilimde mevcuttur. Geri bildirim ve değerlendirmeler çok takdir edilmektedir! BOP nedir? Balance of Power (BOP), fiyattaki değişimi mum aralığıyla karşılaştırarak alıcıların satıcılara karşı gücünü ölçen bir osilatördür. Gösterge (Kapanış - Açılış) / (Yüksek - Düşük) olarak hesa
FREE
BTFX Pivot Points
Bradley Thomas Farrington
The BTFX Pivot Points is an indicator which calculates the Support and Resistance levels for each day. By using this indicator the pivot levels point out clear targets to aim for. The resistance levels are shown in purple above the silver pivot line. The support levels are shown in Orange and can be found below the silver pivot line. This indicators works very well when used with The BTFX Daybreak Indicator. For a more in depth explanation of these indicators please watch the Youtube video attac
Auto Optimized RSI , doğru alım ve satım sinyalleri vermek için tasarlanmış, kullanımı kolay ve akıllı bir ok göstergesidir. Geçmiş verilere dayalı işlem simülasyonları kullanarak, her enstrüman ve zaman dilimi için en etkili RSI seviyelerini otomatik olarak belirler. Bu gösterge, bağımsız bir işlem sistemi olarak veya mevcut stratejinize entegre edilerek kullanılabilir ve özellikle kısa vadeli işlem yapanlar için faydalıdır. Geleneksel RSI’nin sabit seviyeleri (örneğin 70/30) yerine,   Auto Opt
Awesome Oscillator by Bill Williams with the ability to fine-tune and replace the averaging algorithms of the indicator, which significantly expands the possibilities of using this oscillator in algorithmic trading and brings it closer in its properties to such an indicator as the MACD. To reduce price noise, the final indicator is processed with an additional Smooth averaging. The indicator has the ability to give alerts, send mail messages and push signals when the direction of movement of th
MetaTrend M5
Vahidreza Heidar Gholami
Meta Trend Indicator is an efficient way to forecast and detect the trend in any market. It reveals the trend, support and resistance levels, volatility and the maximum potential target, all in one indicator. To adapt to the price and to decrease consecutive trend failures, the internal trend detector algorithm studies the market and dynamically chooses the right values for the internal parameters. This indicator is a perfect trend filter for any strategy or expert advisor. Features Super Adapti
Multi-Timeframe PO3 Projection Multi-Timeframe PO3 Projection is a clean and practical MetaTrader 5 indicator designed to project multiple higher-timeframe candles directly on your active chart. Instead of switching between H1, H4, D1, and other higher timeframes, this indicator lets you view their live candle structure side by side. It helps traders track the current higher-timeframe open, high, low, close, and candle direction while staying on the chart timeframe they are actively trading. The
The Breaker Blocks with Signals indicator aims to highlight a complete methodology based on breaker blocks. Breakout signals between the price and breaker blocks are highlighted and premium/discount swing levels are included to provide potential take profit/stop loss levels. This script also includes alerts for each signal highlighted.   SETTINGS   Breaker Blocks Length: Sensitivity of the detected swings used to construct breaker blocks. Higher values will return longer term break
This indicator will help traders quickly identify inside bars, which are often used in price action trading strategies as potential consolidation or continuation patterns. An inside bar formation is a counter trend candle on both sides as it didn't break the previous candle high or low. Key feature: Identify inside bars in real-time. Colours inside bars while keeping normal bars. Configurable history bars. Optional pop-up alerts and phone notifications with symbol name and time of detection. W
Custom Pivots MT5
Tsvetan Tsvetanov
5 (1)
Pivots Points are significant levels traders can use to determine directional movement, support and resistance. Pivot Points use the prior period's high, low and close to formulate future support and resistance. In this regard, Pivot Points are predictive and leading indicators. Pivot Points were originally used by floor traders to set key levels. Floor traders are the original day traders. They deal in a very fast moving environment with a short-term focus. At the beginning of the trading day,
Created by imjesstwoone and mickey1984, this trade model attempts to capture the expansion from the 10:00-14:00 EST 4h candle using just 3 simple steps. All of the information presented in this description has been outlined by its creators, all I did was translate it to MQL5. All core settings of the trade model may be edited so that users can test several variations, however this description will cover its default, intended behavior using NQ 5m as an example. Step 1 is to identify our Price Ra
BTMM Continuation Sessions + Re-Entry Indicator (MT5) is a chart visualization tool designed to make continuation trading clearer and faster. It draws session boxes (Asian, London, New York)  and marks continuation entry + re-entry  opportunities during active sessions.  Works on Forex pairs and XAUUSD (depending on broker symbols). This is an indicator (not an EA). It does not place trades automatically. Key Features Session Boxes Asian, London, New York boxes Custom colors, opacity,
FREE
Support & Resistance Zone Indicator This indicator dynamically identifies and draws support and resistance zones based on recent price action and fractal patterns. By analyzing ZigZag pivot points and tracking price reactions (touches, bounces, and breaks), the indicator determines the strength and validity of each zone. Key Features: Multi-Timeframe Support: Can work across different timeframes. Fractal-Based Detection: Utilizes both fast and slow fractal detection to find significant swing po
Tma Poc Gold
Ignacio Agustin Mene Franco
POC + TMA SCALPER GOLD - Expert Advisor Professional DESCRIPTION: Automated trading system designed specifically for XAU/USD, combining Point of Control (POC) with Triangular Moving Average (TMA) to identify high-volume and trending zones. It uses advanced risk management with dynamic trailing stops and an intelligent grid system. TECHNICA
No Wick Candle
Hafiz Anas Hashmi
5 (1)
No Wick Candles is a powerful price action indicator that identifies candles with no upper or lower wick (also known as Marubozu candles ) and automatically draws horizontal compensation lines from their open price with a "Compensation" label . These wickless candles represent strong momentum and are often used by professional traders as key support/resistance zones . The indicator helps you visualize potential reversal or continuation zones instantly. Key Features Detects Bullish (no lower wick
FREE
Bu ürünün alıcıları ayrıca şunları da satın alıyor
SuperScalp Pro
Van Minh Nguyen
4.63 (24)
SuperScalp Pro – Gelişmiş Çoklu Filtre Scalping Gösterge Sistemi SuperScalp Pro, işlem fırsatlarını belirlemeye yardımcı olmak için klasik Supertrend ile birden fazla akıllı onay filtresini birleştiren gelişmiş bir scalping göstergesidir. M1’den H4’e kadar farklı zaman dilimlerinde verimli şekilde çalışır ve XAUUSD, BTCUSD ile majör Forex pariteleri için optimize edilmiştir. Gösterge, net Al ve Sat sinyalleri sunar ve ATR tabanlı otomatik giriş fiyatı, stop loss ve take profit seviyeleri hesapla
Divergence Bomber
Ihor Otkydach
4.9 (89)
Bu göstergeyi satın alan herkese aşağıdaki ekstra içerikler ücretsiz olarak sunulmaktadır: Her işlemi otomatik olarak yöneten, Stop Loss ve Take Profit seviyelerini ayarlayan ve işlemleri strateji kurallarına göre kapatan özel yardımcı araç: "Bomber Utility" Göstergenin farklı varlıklar üzerinde kullanılmasına yönelik ayar dosyaları (set dosyaları) Bomber Utility için 3 farklı modda kullanım sunan ayar dosyaları: "Minimum Risk", "Dengeli Risk" ve "Bekle-Gör Stratejisi" Bu ticaret stratejisini hı
Entry In The Zone and SMC Multi Timeframe is a real-time 2-in-1 market analysis tool that combines market structure analysis and a No Repaint BUY / SELL signal system into a single indicator, built on Smart Money Concepts (SMC) — a widely adopted framework used by professional traders to understand market structure. This indicator helps you see the market more clearly, make decisions based on structure rather than guesswork, and focus on high-probability zones where price is more likely to react
Power Candles V3 - Kendi Kendini Optimize Eden Güç Göstergesi Power Candles V3, döviz ve enstrüman gücünü, eklendiği her grafikte eyleme geçirilebilir bir ticaret planına dönüştürür. Sadece mumları renklendirmek yerine, arka planda canlı bir otomatik optimizasyon çalıştırır ve önünüzdeki sembol için en iyi Stop Loss, Take Profit ve sinyal eşiğini size sunar. Tek bir tıklama ile canlı ticarete uyarlanır - giriş, Stop Loss ve Take Profit ışınları grafikte tam fiyatlarla görünür ve uyarılar yön bil
SignalTech MT5 is a fully rule based trading system for EURUSD, USDCHF, USDJPY, AUDUSD, NZDUSD, EURJPY, AUDJPY, NZDJPY, CADJPY.  All the winning trades with chart setups are published on the comments page. 2025-12 1174 Pips 2026-01 2624 Pips 2026-02 2937 Pips 2026-03 2165 Pips 2026-04 2243 Pips It can generate signals with Buy/Sell Arrows and Pop-Up/Sound Alerts. Each signal has clear Entry and Stop Loss levels, which should be automatically flagged on the chart, as well as potential Targets 1,
Bu indikatörü satın alırsanız, Profesyonel Trade Manager’ımı  + EA ÜCRETSİZ olarak alacaksınız. Öncelikle, bu Ticaret Sistemi'nin Non-Repainting, Non-Redrawing ve Non-Lagging Göstergesi olduğunu vurgulamak önemlidir, bu da hem manuel hem de robot ticareti için ideal hale getirir. Online kurs, kılavuz ve ön ayarları indir. "Smart Trend Trading System MT5", yeni ve deneyimli tüccarlar için özelleştirilmiş kapsamlı bir ticaret çözümüdür. 10'dan fazla premium göstergeyi birleştiriyor ve 7'den fazla
RelicusRoad Pro MT5
Relicus LLC
4.96 (24)
RelicusRoad Pro: Kantitatif Piyasa İşletim Sistemi ÖMÜR BOYU ERİŞİMDE %70 İNDİRİM (SINIRLI SÜRE) - 2.000+ TRADER'A KATILIN Neden çoğu trader "mükemmel" indikatörlere rağmen başarısız olur? Çünkü tekil kavramları boşlukta trade ederler. Bağlamı olmayan bir sinyal kumardır. Sürekli kazanmak için KONFLÜANS (UYUM) gerekir. RelicusRoad Pro basit bir ok indikatörü değildir. Tam bir Kantitatif Piyasa Ekosistemi dir. Tescilli volatilite modellemesini kullanarak fiyatın ilerlediği "Adil Değer Yolu"nu har
MetaTrader 5 için Akıllı Çok Katmanlı Kırılım ve Geri Çekilme Dedektörü "Akıllı, Basit, Hızlı!" Yüksek olasılıklı kırılım girişlerini kaçırmaktan bıktınız mı? Kırılımları trend yönü ve para birimi momentumuyla hizalamaya çalışarak birden fazla grafiği saatlerce tarayıp — yine de hareketi kaçırıyor musunuz? Break Pullback, tüm bunları tek bir göstergede çözüyor. Break Pullback Nedir? Break Pullback, piyasa yapısı, kırılım ve trend devamı kurulumlarında işlem yapan yatırımcılar için özel olarak
Gann Made Easy , bay teorisini kullanarak ticaretin en iyi ilkelerine dayanan, profesyonel ve kullanımı kolay bir Forex ticaret sistemidir. WD Gann. Gösterge, Zararı Durdur ve Kâr Al Seviyeleri dahil olmak üzere doğru SATIN AL ve SAT sinyalleri sağlar. PUSH bildirimlerini kullanarak hareket halindeyken bile işlem yapabilirsiniz. Satın alma işleminden sonra, alım satım talimatlarını ve harika ek göstergeleri ücretsiz olarak almak için lütfen benimle iletişime geçin! Muhtemelen Gann ticaret yöntem
Tanıtım       Quantum Breakout PRO   , Breakout Bölgeleri ile ticaret yapma şeklinizi değiştiren çığır açan MQL5 Göstergesi! 13 yılı aşkın ticaret tecrübesine sahip deneyimli tüccarlardan oluşan bir ekip tarafından geliştirilmiştir.       Kuantum Breakout PRO       yenilikçi ve dinamik koparma bölgesi stratejisiyle ticaret yolculuğunuzu yeni zirvelere taşımak için tasarlanmıştır. Kuantum Breakout Göstergesi, size 5 kar hedefi bölgesi ile kırılma bölgelerinde sinyal okları ve kırılma kutusuna da
Azimuth Pro
Ottaviano De Cicco
5 (7)
Azimuth Pro V2: Synthetic Fractal Structure and Confirmed Entries for MT5 Overview Azimuth Pro is a multi-level swing structure indicator by Merkava Labs . Four nested swing layers, swing-anchored VWAP, ABC pattern detection, three-timeframe structural filtering, and closed-bar confirmed entries — one chart, one workflow from micro-swings to macro-cycles. This is not a blind signal product. It is a structure-first workflow for traders who care about location, context, and timing. V2 Launch Offe
Öncelikle, bu Ticaret Aracının Non-Repainting, Non-Redrawing ve Non-Lagging Gösterge olduğunu vurgulamakta fayda var, bu da onu profesyonel ticaret için ideal hale getiriyor. Çevrimiçi kurs, kullanıcı kılavuzu ve demo. Akıllı Fiyat Hareketi Kavramları Göstergesi, hem yeni hem de deneyimli tüccarlar için çok güçlü bir araçtır. İleri ticaret fikirlerini, Inner Circle Trader Analizi ve Smart Money Concepts Ticaret Stratejileri gibi 20'den fazla kullanışlı göstergeyi bir araya getirerek bir araya
Önce dürüst olalım. Hiçbir gösterge tek başına sizi kârlı yapmaz. Eğer biri size aksini söylüyorsa, size bir hayal satıyordur. Mükemmel al/sat okları gösteren her gösterge, kusursuzmuş gibi görünecek şekilde yapılabilir — sadece geçmişin doğru bir bölümünü yakınlaştırıp kazanan işlemleri ekran görüntüsü almanız yeterlidir. Biz bunu yapmıyoruz.  SMC Intraday Formula bir araçtır. Piyasa yapısını sizin için okur, en yüksek olasılıklı fiyat bölgelerini belirler ve şu anda akıllı paranın izinin nası
Quantum TrendPulse
Bogdan Ion Puscasu
5 (25)
SuperTrend   ,   RSI   ve   Stochastic'in   gücünü tek bir kapsamlı göstergede birleştirerek işlem potansiyelinizi en üst düzeye çıkaran nihai işlem aracı olan   Quantum TrendPulse'u   tanıtıyoruz. Hassasiyet ve verimlilik arayan yatırımcılar için tasarlanan bu gösterge, piyasa trendlerini, momentum değişimlerini ve en uygun giriş ve çıkış noktalarını güvenle belirlemenize yardımcı olur. Temel Özellikler: SuperTrend Entegrasyonu:   Güncel piyasa trendlerini kolayca takip edin ve karlılık dalgası
FX Trend MT5 NG
Daniel Stein
5 (4)
FX Trend NG: Yeni Nesil Çoklu Piyasa Trend Zekâsı Genel Bakış FX Trend NG , çoklu zaman dilimlerinde çalışan profesyonel bir trend analiz ve piyasa izleme aracıdır. Piyasanın yapısını saniyeler içinde anlamanızı sağlar. Birden fazla grafik arasında geçiş yapmak yerine, hangi enstrümanların trendde olduğunu, momentumun nerede zayıfladığını ve hangi zaman dilimlerinin uyumlu olduğunu anında görebilirsiniz. Lansman Teklifi – FX Trend NG sadece $30 (6 Ay) veya $80 Ömür Boyu Lisans ile edinin. Zate
Atomic Analyst MT5
Issam Kassas
3.94 (31)
Öncelikle belirtmek gerekir ki bu Ticaret Göstergesi Yeniden Çizim Yapmaz, Gecikmez ve Gecikme Göstermez, bu da hem manuel hem de robot ticareti için ideal hale getirir. Kullanıcı kılavuzu: ayarlar, girişler ve strateji. Atom Analisti, Piyasada Daha İyi Bir Avantaj Bulmak İçin Fiyatın Gücünü ve Momentumunu Kullanan PA Fiyat Hareketi Göstergesidir. Gürültüleri ve Yanlış Sinyalleri Kaldırmaya ve Ticaret Potansiyelini Artırmaya Yardımcı Olan Gelişmiş Filtrelerle Donatılmıştır. Birden fazla katmanl
Meridian Pro
Ottaviano De Cicco
5 (2)
Meridian Pro 2.00: Professional Multi-Timeframe Trend Matrix for MT5 Meridian Pro 2.00 is a professional adaptive trend matrix for MetaTrader 5. It combines the original Meridian trend engine, a clean chart ribbon, closed-bar signal arrows, an 8-timeframe dashboard, Fuel momentum, weighted consensus, synthetic HTF processing and chart-native higher-timeframe context lines. The goal is simple: read current trend, multi-timeframe structure, strength, momentum and EA-ready state from one discipline
Btmm state engine pro
Garry James Goodchild
5 (4)
BTMM State Engine Pro is a MetaTrader 5 indicator for traders who use the Beat The Market Maker approach: Asian session context, kill zone timing, level progression, peak formation detection, and a multi-pair scanner from a single chart. It combines cycle state logic with a built-in scanner dashboard so you do not need the same tool on many charts at once. What it does Draws the Asian session range; session times can follow broker server offset or be set in inputs. Tracks level progression (L
Market Structure Order Block Dashboard MT5, piyasa yapısını ve ana fiyat reaksiyon bölgelerini doğrudan grafikte okumak isteyen traderlar için tasarlanmış bir MT5 göstergesidir. BOS, ChoCH, Order Blocks, Fair Value Gaps (FVG), Likidite, Kill Zones, Volume Profile ve hızlı analiz için kompakt bir paneli bir araya getirir. Bu gösterge, piyasa yapısını, ICT ve Smart Money kavramlarını karar çerçevesi olarak kullanan traderlara yöneliktir. Trend devamlarını, olası tersine dönüşleri, fiyat dengesizli
KT Alpha Hunter Arrows MT5
KEENBASE SOFTWARE SOLUTIONS
Çoğu ok göstergesi size yalnızca bir sinyal verir ve geri kalan her şeyi sizin çözmenizi bekler. KT Alpha Hunter Arrows ise size tam bir işlem planı sunar. Her sinyal oku, hazır çizilmiş tam bir planla birlikte görünür: giriş çizgisi, stop loss, dört take profit seviyesi ve bu sembol ile zaman diliminin o anda işlem yapmaya değer olup olmadığını gösteren canlı edge değerlendirmesi. Dahil edilen Trade Manager EA, siz işleme girdikten sonra yönetimi üstlenir. Böylece piyasa gürültülü ve stresli ha
RFI levels PRO MT5
Roman Podpora
3.67 (3)
Bu gösterge, fiyat dönüş noktalarını ve fiyat geri dönüş bölgelerini doğru bir şekilde gösterir.       Başlıca oyuncular   . Yeni trendlerin nerede oluştuğunu görüyorsunuz ve her işlem üzerinde kontrolü elinizde tutarak, azami hassasiyetle kararlar alıyorsunuz. TREND LINES PRO   göstergesiyle birlikte kullanıldığında maksimum potansiyelini ortaya koyar.  VERSION MT4 Göstergenin gösterdiği şey: Yeni bir trendin başlangıcında aktivasyonla birlikte tersine dönüş yapıları ve tersine dönüş seviyeler
Grabber System MT5
Ihor Otkydach
4.83 (23)
Size mükemmel bir teknik gösterge olan Grabber’ı tanıtıyorum. Bu araç, kullanıma hazır bir “her şey dahil” işlem stratejisi olarak çalışır. Tek bir yazılım kodu içinde güçlü piyasa teknik analiz araçları, işlem sinyalleri (oklar), uyarı işlevleri ve push bildirimleri entegre edilmiştir. Bu göstergeyi satın alan herkes aşağıdaki hediyeleri ücretsiz olarak alır: Açık emirleri otomatik yönetmek için Grabber Yardımcı Aracı Kurulum, yapılandırma ve nasıl işlem yapılacağını adım adım anlatan video kıl
Top indicator for MT5   providing accurate signals to enter a trade without repainting! It can be applied to any financial assets:   forex, cryptocurrencies, metals, stocks, indices .  Watch  the video  (6:22) with an example of processing only one signal that paid off the indicator! MT4 version is here It will provide pretty accurate trading signals and tell you when it's best to open a trade and close it. Most traders improve their trading results during the first trading week with the help of
Bu gösterge paneli, seçilen semboller için mevcut en son   harmonik kalıpları   gösterir, böylece zamandan tasarruf edersiniz ve daha verimli olursunuz /   MT4 sürümü . Ücretsiz Gösterge:   Basic Harmonic Pattern Gösterge sütunları Symbol :   seçilen semboller görünecektir Trend:   yükseliş veya düşüş Pattern :   desen türü (gartley, kelebek, yarasa, yengeç, köpekbalığı, cypher veya ABCD) Entry :   giriş fiyatı SL:   zararı durdur fiyatı TP1:   1. kar alma fiyatı TP2:   2. kar alma fiyatı TP
FX Power MT5 NG
Daniel Stein
5 (31)
FX Power: Daha Akıllı Ticaret Kararları için Para Birimlerinin Gücünü Analiz Edin Genel Bakış FX Power , her piyasa koşulunda başlıca para birimlerinin ve altının gerçek gücünü anlamak için vazgeçilmez bir araçtır. Güçlü para birimlerini alıp zayıf olanları satarak, FX Power ticaret kararlarınızı basitleştirir ve yüksek olasılıklı fırsatları ortaya çıkarır. İster trendlere sadık kalın ister Delta'nın aşırı değerlerini kullanarak tersine dönüşleri öngörün, bu araç ticaret tarzınıza mükemmel bir
TREND ÇİZGİLERİ PRO       Piyasanın gerçek yön değiştirdiği noktayı anlamaya yardımcı olur. Gösterge, gerçek trend dönüşlerini ve büyük oyuncuların piyasaya yeniden girdiği noktaları gösterir. Anlıyorsun   BOS hatları   Daha yüksek zaman dilimlerindeki trend değişiklikleri ve önemli seviyeler, karmaşık ayarlar veya gereksiz gürültü olmadan gösterilir. Sinyaller yeniden çizilmez ve çubuk kapandıktan sonra grafikte kalır. MT4 SÜRÜMÜ   -   RFI LEVELS PRO   göstergesiyle   birlikte kullanıldığında m
Super Signal Market Slayer No repaint | Alta precisione | Indicatore di trend intelligente multi-mercato Nel trading, la vera difficoltà non è aprire un’operazione, ma riconoscere chiaramente quando un trend sta realmente iniziando. Market Slayer nasce proprio per questo. È un indicatore intelligente senza repaint, progettato specificamente per il trading intraday. Grazie a conferme multilivello e filtri di trend, fornisce segnali Buy / Sell chiari e affidabili solo nei momenti chiave. Vantaggi
OmniSync Projection
Antonio-alin Teculescu
5 (1)
Chronos Fractal Engine is an innovative price projection indicator for MetaTrader 5, designed to transform your technical analysis by intelligently identifying and projecting historical price patterns. Built upon an advanced correlation algorithm and the fractal principles of the market, this powerful tool visualizes potential future price movements, giving you a unique edge in your trading decisions. What is Chronos Fractal Engine? At its core, the Chronos Fractal Engine employs a sophisticat
FX Levels MT5
Daniel Stein
5 (13)
FX Levels: Tüm Piyasalar İçin Son Derece Hassas Destek ve Direnç Hızlı Bakış Döviz kurları, endeksler, hisseler veya emtialar gibi herhangi bir piyasada güvenilir destek ve direnç seviyeleri belirlemek mi istiyorsunuz? FX Levels geleneksel “Lighthouse” yöntemini ileri düzey bir dinamik yaklaşımla birleştirerek neredeyse evrensel bir doğruluk sağlar. Gerçek broker deneyimimize ve otomatik günlük güncellemeler ile gerçek zamanlı güncellemelerin birleşimine dayalı olarak, FX Levels size dönüş nok
The Zone Trading Indicator is a technical analysis tool for MetaTrader 5 that automatically identifies and displays tradable price zones across multiple timeframes to assist with structured market analysis. The indicator plots Monthly, Weekly, Daily, and H4 tradable zones , allowing traders to view higher- and lower-timeframe price areas simultaneously. These zones are designed to support one-candle–based entry approaches by highlighting predefined areas where price interaction may be monitored.
Filtrele:
Değerlendirme yok
Değerlendirmeye yanıt