HotZone

🔥 HotZone

Visualize Where Price Wants to Go.
  1. "Why does price keep bouncing at this level?"
  2. "Why does it always consolidate in this zone?"
  3. "Where is the next support or resistance?"
If you've ever stared at a chart asking these questions, the answer often lies in Price Density.
Price zones where market participants repeatedly buy and sell naturally accumulate "density."
HotZone is an MT5-exclusive Price Density Analysis Indicator that visualizes this density in real time.

MT5 OnlyM1 to MNCustom Indicator

⚠️ HotZone is a custom indicator for MT5. It is NOT an Expert Advisor (EA) and does not trade automatically.

Who is this for?

✅ Perfect For Traders Who...

  • Draw support & resistance "by feel" and want more precision
  • Need to quickly identify key price zones for day trading
  • Want to track weekly/monthly key zones for swing trading
  • Need to instantly check how price relates to their MAs
  • Want a clean chart without sacrificing information density
  • Want to eliminate the tedious manual work of multi-TF analysis

Section 01

Product Overview

What Is HotZone?

HotZone is a custom indicator exclusively for MetaTrader 5 (MT5).

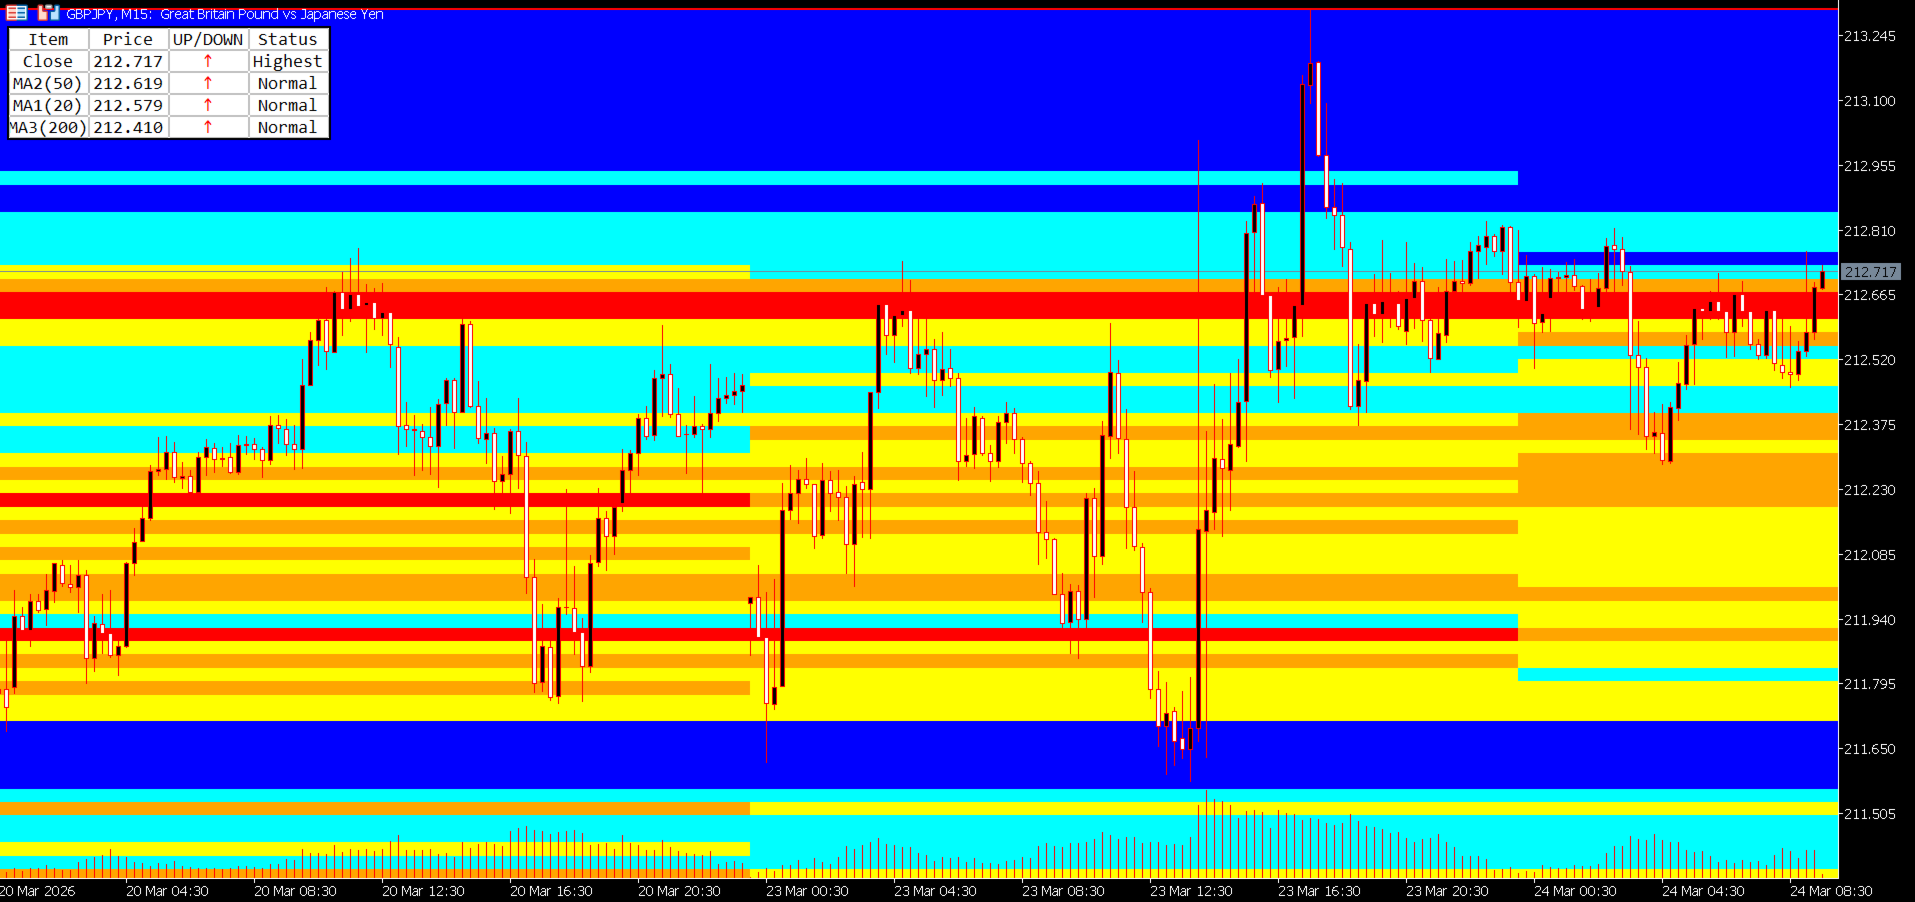
It goes far beyond simple lines or oscillators. HotZone analyzes historical price data — counting how many times price visited each price band — and visualizes that density as a color heatmap directly on your chart.

What Is Price Density Analysis?

Price density analysis is a quantitative method of evaluating how frequently price visited a given price band within a specific time period.

|

| Density Level | Meaning | Chart Behavior

| High Density (Hot Zone) | A zone where many traders have historically bought and sold | Likely to act as strong support or resistance in the future

| Low Density (Cold Zone) | A zone where very little trading activity occurred | Price tends to pass through smoothly — breakouts are more likely

This concept is well-established as the Value Area and Congestion Zone analysis used by professional traders and institutional investors. HotZone automates and visualizes this analysis directly on your MT5 chart.

Problems HotZone Solves

|

| Common Pain Point | HotZone's Solution

| Hard to identify reliable support/resistance | Density heatmap instantly shows price concentration zones

| Multi-TF analysis is time-consuming | All TFs from M1 to MN switch and display automatically

| Confusing MA relationships at a glance | MA Table ranks price and MAs in order at all times

| Charts become cluttered with too many tools | Clean heatmap visualization keeps charts readable

| Drawing high/low lines manually is tedious | High and low lines are drawn automatically per period block

Section 02

Features & Strengths

🔬

Quantitative & Objective Analysis

Instead of "gut-feel" support/resistance, HotZone uses numerical price density data. Two traders looking at the same chart will reach the same conclusions.

🕐

Optimized for Every Timeframe

From M1 to MN, each timeframe has its own optimized period block for density calculation. Just switch TFs — the density map adapts automatically.

📊

Information-Rich Yet Clean

The combination of heatmap + MA Table gives you everything you need while keeping the chart uncluttered. No need to stack multiple indicators.

High-Performance Design

The MaxPeriods limit keeps rendering fast. All parameters switch automatically on TF change — no manual reconfiguration needed.

🎨

Fully Customizable

Color scheme, band width, analysis depth, MA type, and table size — everything is adjustable. Works on both dark and light chart themes.

Section 03

Key Features

■ Feature 1: 5-Level Color Price Density Heatmap

The core of HotZone. For each period block, it analyzes price data and counts how many times price (close) visited each pip-width band. That density is then displayed as a 5-level color heatmap.

Level 5 (Red)Highest density zone — 80% or more of peak density

Level 4 (Orange)High density zone — 60–79%

Level 3 (Yellow)Medium density zone — 40–59%

Level 2 (Aqua)Low density zone — 20–39%

Level 1 (Blue)Lowest density zone — below 20%

All colors are fully customizable to match your chart style.


■ Feature 2: Multi-Timeframe Support with Auto Period Blocks

HotZone supports all timeframes from M1 to MN (Monthly). Simply change the timeframe and the optimal period blocks are automatically configured.

|

| Timeframe | Period Block Boundary | Density Unit

| M1 (1-minute) | Every 2 hours | 2-hour block density

| M5 (5-minute) | Every 12 hours (00:00 / 12:00) | Half-day block density

| M15 (15-minute) | Daily (00:00) | Daily block density

| M30 (30-minute) | Half-week (Mon 00:00 / Wed 12:00) | Half-week block density

| H1 (1-hour) | Weekly (from Monday) | Weekly block density

| H4 (4-hour) | Half-month (1st / 16th) | Half-month block density

| D1 (Daily) | Every 6 months (Jan / Jul) | Semi-annual block density

| W1 (Weekly) | Annually (January) | Annual block density

| MN (Monthly) | Annually (January) | Annual block density


■ Feature 3: Automatic High/Low Line Drawing

HotZone automatically draws High and Low lines for each period block, marking the highest and lowest price reached within that block. These lines serve as dynamic support/resistance references. Colors are customizable, and lines update automatically at each period boundary.


■ Feature 4: Band Grid Lines (Optional)

Set IsDrawBandLine = true to display the underlying band grid used for density calculation directly on the chart.

|

| Timeframe | Default Band Width

| M1 | 1 pip

| M5 | 2 pips

| M15 | 3 pips

| M30 | 5 pips

| H1 | 10 pips

| H4 | 25 pips

| D1 | 50 pips

| W1 | 100 pips

| MN | 250 pips


■ Feature 5: MA Table (Moving Average Analysis Table)

A compact table in the top-left of your chart displays the current price alongside 3 moving averages, sorted by price in real time.

|

| Item | Price | Direction | Status

| Close | Current price | ↑↓ | Normal / Highest / Lowest

| MA1 (20) | MA1 value | ↑↓ | Normal / Highest / Lowest

| MA2 (50) | MA2 value | ↑↓ | Normal / Highest / Lowest

| MA3 (200) | MA3 value | ↑↓ | Normal / Highest / Lowest

↑ (red): price rose from previous bar  /  ↓ (blue): price fell  /  - (black): unchanged

Highest: highest value within the lookback period  /  Lowest: lowest value  /  Normal: standard


■ Additional Smart Features

Auto Timeframe Switching: All parameters auto-adjust when you change the TF — no manual reconfiguration needed

DPI Scaling Support: The MA Table renders correctly on high-resolution and 4K displays

Performance Optimization: MaxPeriods limits rendering to only the range you need

Universal Symbol Support: Works with any MT5 symbol — FX pairs, Gold, Oil, Indices, and more


Section 04

How to Use HotZone in Your Trading

▶ Day Traders

Recommended Timeframes: M1, M5, M15

Example scenario: Trading USD/JPY during the Tokyo session on M5

  • Review the previous day's M5 heatmap → Identify the red and orange zones from yesterday's morning (00:00–12:00) and afternoon (12:00–24:00) blocks
  • At the Tokyo open (09:00), check current price position → Is price near yesterday's high-density zone (red)?
  • Price approaches a red zone → Consider a mean-reversion entry anticipating a bounce
  • Confirm MA20 direction in the MA Table → ↑ favors long, ↓ favors short
  • Target the next high-density zone as take profit → Use the distance between red zones as your TP guideline

💡 M1/M5 heatmaps use 2-hour and half-day blocks, making it easy to pinpoint hot zones within the current session. Effective for scalpers too.

▶ Swing Traders

Recommended Timeframes: H1, H4, D1

Example scenario: Swing trading EUR/USD on the H4 chart

  • Switch to D1 → Identify the red zones (highest density) from the last 6-month block — these are your key medium-term support/resistance candidates
  • Switch to H4 → Check if the half-month block's red zones overlap with D1 zones (confluence check)
  • Confirm MA50 and MA200 positions in the MA Table → Use the price-vs-MA arrangement to determine medium-term trend direction
  • Use H1 to time your entry → Check the weekly block heatmap on Monday to identify the week's key zones
  • Set stop-loss just below the auto-drawn Low Line of the most recent period block

💡 Overlapping D1 (6-month blocks) and H4 (half-month blocks) makes it easy to spot multi-timeframe confluence zones with high conviction.

▶ Professional Traders

Recommended Approach: Multi-TF confluence analysis

Professional traders focus on "confluence zones" — areas where density is high across multiple timeframes simultaneously.

  • W1 heatmap: Identify annual-level key zones (red) → establish the long-term value area baseline
  • D1 heatmap: Confirm whether those zones are also high-density in the 6-month block → validate with medium-term data
  • H4 heatmap: Check if the same zone is still high-density in the half-month block → confirm short-term market interest
  • H1 heatmap: Confirm weekly block density → narrow down your entry window
  • MA Table: Review the arrangement of Close, MA20, MA50, MA200 → gauge trend strength and direction
  • A zone where 2–3 TFs show high density → Maximum Confluence Zone → Highest-confidence entry point

【Long Setup Example】✓ Price approaches the lower edge of W1 red zone✓ D1 red / orange zone also present at the same level✓ MA Table: MA200 < MA50 < MA20 < Close (bullish alignment)✓ MA Table: MA20 direction arrow = ↑ (rising)→ Strong support confluence → Long entry candidate【Short Setup Example】✓ Price approaches the upper edge of H4 red zone✓ D1 red zone also aligns at the same level✓ MA Table: Close < MA20 < MA50 (bearish alignment)✓ MA Table: MA20 direction arrow just flipped to ↓→ High-density zone rejection → Short entry candidate

▶ Entry & Exit Summary

|

| Use Case | Market Condition | Action

| Counter-trend entry | Price approaching a high-density zone (red/orange) | Bounce entry candidate

| Breakout entry | Price breaking through a high-density zone | Breakout entry (confirm momentum first)

| Trend following | Price passing through a low-density zone (blue) | Hold / continue in trend direction

| Take Profit (TP) | Next high-density zone ahead | Use as TP price target

| Stop Loss (SL) | Break of high/low auto-drawn line | Use as SL reference

| Position scaling | MA direction reverses in MA Table | Consider partial close


Section 05

Parameter Reference

─ General Display Settings ─

|

| Parameter | Default | Description

| MaxPeriods | 10 | Maximum number of period blocks to process and display. 0 = all periods. Lower values reduce chart processing load.

| HighLineColor | Red | Color of the high line for each period block

| LowLineColor | Red | Color of the low line for each period block

| IsDrawBandLine | false | Set to true to display the band grid lines on the chart

| BandLineColor | Silver | Color of band grid lines. Light colors (Silver, LightGray) recommended.


─ Heatmap Color Settings ─

|

| Parameter | Default | Density Level

| BandBgColor5 | Red | Level 5 — Highest density (≥ 80% of peak)

| BandBgColor4 | Orange | Level 4 — High density (60–79%)

| BandBgColor3 | Yellow | Level 3 — Medium density (40–59%)

| BandBgColor2 | Aqua | Level 2 — Low density (20–39%)

| BandBgColor1 | Blue | Level 1 — Lowest density (< 20%)


─ Per-TF Analysis Period (Number of Bars) ─

More bars = wider historical lookback. Fewer bars = density based on more recent data.

|

| Parameter | Default | Approximate Coverage

| AnalysisPeriodM1 | 1440 bars | ≈ 1 day

| AnalysisPeriodM5 | 1440 bars | ≈ 5 days

| AnalysisPeriodM15 | 1440 bars | ≈ 15 days

| AnalysisPeriodM30 | 1440 bars | ≈ 30 days

| AnalysisPeriodH1 | 1440 bars | ≈ 60 days

| AnalysisPeriodH4 | 1440 bars | ≈ 240 days

| AnalysisPeriodD1 | 1200 bars | ≈ 5 years

| AnalysisPeriodW1 | 520 bars | ≈ 10 years

| AnalysisPeriodMN | 240 bars | ≈ 20 years


─ Per-TF Band Width (pips) ─

|

| Parameter | Default | Notes

| BandWidthPipsM1 | 1 pip | Fine granularity for scalping

| BandWidthPipsM5 | 2 pips |

| BandWidthPipsM15 | 3 pips |

| BandWidthPipsM30 | 5 pips |

| BandWidthPipsH1 | 10 pips |

| BandWidthPipsH4 | 25 pips |

| BandWidthPipsD1 | 50 pips |

| BandWidthPipsW1 | 100 pips |

| BandWidthPipsMN | 250 pips | Coarse granularity for monthly

💡 Default values work well for major FX pairs (USD/JPY, EUR/USD, etc.). For high-volatility instruments (XAU/USD, exotic crosses), consider widening band widths by 1.5–2×.


─ MA Table Settings ─

|

| Parameter | Default | Description

| ShowMATable | true | Set to false to hide the MA Table

| MA1Period | 20 | Calculation period for MA1 (short-term MA)

| MA2Period | 50 | Calculation period for MA2 (medium-term MA)

| MA3Period | 200 | Calculation period for MA3 (long-term / trend MA)

| MA1Method / MA2Method / MA3Method | SMA | Choose from: SMA / EMA / SMMA / LWMA

| LookbackBars | 20 | Number of bars used for Highest / Lowest status detection

| HighestColor | Red | Text color for "Highest" status in MA Table

| LowestColor | Blue | Text color for "Lowest" status in MA Table

| UpArrowColor | Red | Color of the up arrow (↑) in MA Table

| DownArrowColor | Blue | Color of the down arrow (↓) in MA Table

| TableFontSize | 8 | Font size of the MA Table (pt)

| TableScale | 1.0 | Display scale of the MA Table. Recommended: 1.5–2.0 for 4K/WQHD displays.


Section 06

Installation & Setup Guide

Installation Steps

  • Purchase & Download: After purchasing on MQL5 Market, download HotZone from the "Market" tab inside MetaTrader 5.
  • Apply to Chart: In the MT5 Navigator panel → "Indicators" → drag and drop HotZone onto your desired chart.
  • Settings Dialog: A configuration dialog will appear. Click OK with the default settings to get started immediately.
  • Verify Display: Once the heatmap, high/low lines, and MA Table appear on the chart, setup is complete.

Recommended Settings by Use Case

|

| Scenario | Recommended Settings

| Major FX pairs (USD/JPY, EUR/USD, GBP/USD, etc.) | Band widths: default values / MaxPeriods: 10 / MA: 20, 50, 200 (SMA)

| High-volatility instruments (XAU/USD, exotic crosses, etc.) | Widen band widths 1.5–2× per TF (e.g. H1: 10 → 20 pips)

| High-resolution displays (4K / WQHD) | TableScale = 1.5–2.0 / TableFontSize = 10–12


Important Notes

⚠️ HotZone is MT5 only. It does not work on MT4.

⚠️ On first load, processing a large amount of historical data may take a few seconds to tens of seconds.

⚠️ If AnalysisPeriod is set very high, some brokers may not have sufficient historical data. A warning will appear in the console if data is insufficient.

⚠️ HotZone is an analysis tool. It does not generate trade signals automatically. All trading decisions remain your responsibility.


Section 07

Frequently Asked Questions


Does it work on MT4?

No. HotZone is MT5 only and is not compatible with MT4.


Which symbols does it support?

HotZone works with any symbol available in MT5 — FX pairs (major, minor, and exotic), precious metals (XAU/USD, XAG/USD), oil (USOIL), stock indices (US30, DAX40), and more.


Will it slow down my chart?

The MaxPeriods parameter limits the number of rendered period blocks to control performance. The default value of 10 runs smoothly on typical hardware (Core i5+, 8GB RAM). Reduce to 5 on lower-spec machines if needed.


Can I use it alongside other indicators?

Yes. HotZone renders in the chart window but does not conflict with other indicators. That said, too many overlapping indicators can reduce readability — manage the number of active indicators accordingly.


Do I need to reconfigure it every time I change the timeframe?

No. HotZone automatically switches to the optimal parameters when you change the timeframe. Band widths and analysis periods are all pre-optimized per TF and applied automatically.


Does it work with any broker?

It works with any MT5-compatible broker. However, the amount of available historical data varies by broker. On brokers with limited data history, longer-term TFs (W1, MN) may not produce fully accurate density calculations.


Will I receive updates after purchase?

Yes. When updates are released through MQL5 Market, your copy will be updated automatically at no additional cost.


Is there a refund policy?

Refund policy follows MQL5 Market terms. Please refer to the MQL5 help page for details.


Section 08

Version Information & Changelog

Version: 1.00

Last Updated: January 22, 2026

Developer: CAPS LLC

Website: https://traders.tokyo/

Platform: MetaTrader 5 (MT5)

Changelog

|

| Version | Date | Changes

| v1.00 | 2026-01-22 | Initial Release

  • 5-level color price density heatmap (M1 to MN, all timeframes)
  • Per-TF optimized period block auto-segmentation
  • MA Table (3 MAs + current price, direction arrows, DPI scaling support)
  • Automatic high/low line drawing per period block
  • Customizable band widths and analysis periods per TF

Disclaimer

HotZone is provided for informational and analytical purposes only. The developer and distributor accept no responsibility for any trading results arising from the use of this indicator. All trading and investment decisions are made at your own risk. Past price data and density patterns do not guarantee future performance.

© 2026 CAPS LLC. All rights reserved.  /  https://traders.tokyo/

Produits recommandés
FVG Sessions
Thi Thanh Huong Vo
The FVG Sessions indicator highlights the first fair value gap of the trading session as well as the session range. Detected fair value gaps extend to the end of the trading session. Alerts are included on the formation of a session fair value gap, price being within a session fair value gap, mitigations, and price crossing session fair value gaps average. Trader ICT states that the first fair value gap of the trading session can attract the most significant reaction. Having only one FVG per
To review our products, please click the link: LINK This Classic Pivot Point Indicator accurately calculates and displays 7 essential pivot levels , including the Pivot Point , 3 Support levels (S1–S3) , and 3 Resistance levels (R1–R3) based on the standard classic pivot formula . Designed for Forex, indices, commodities, and crypto trading , it supports multi-currency and multi-timeframe analysis in a clean, professional dashboard interface . With the built-in interactive dashboard , traders c
Market Structure Fractals The structure layer MetaTrader 5 was missing Most traders stare at candles and draw structure manually — imprecisely, inconsistently, and always too late. You know what a fractal high and low look like. The question is whether you can spot every one, mark it cleanly, and track it the moment price breaks through. You can't. Market Structure Fractals can. MetaTrader 5 shows you price. It doesn't show you structure. That gap — between a candle pattern and a confirmed bre
FREE
CosmiCLab SMC FIBO CosmiCLab SMC FIBO is a professional trading indicator designed for traders who use Smart Money Concepts (SMC), market structure analysis and Fibonacci retracement levels. The indicator automatically detects market swings and builds Fibonacci levels based on the latest impulse movement. It also identifies market structure changes such as BOS (Break of Structure) and CHOCH (Change of Character), helping traders understand the current market direction. CosmiCLab SMC FIBO also pr
Un indicateur de détection de tendance propre pour MT5, basé sur la structure du marché, avec des flèches de tendance visuelles, des marqueurs de pivots valides et des zones structurelles optionnelles. STS Structure Trend Detector est un indicateur propre pour MetaTrader 5, conçu pour détecter la direction de la tendance du marché à partir de la structure du prix. STS Structure Trend Detector est conçu pour les traders qui souhaitent disposer d’un outil visuel simple afin de suivre la structure
RBreaker
Zhong Long Wu
RBreaker Gold Indicators est une stratégie de trading intraday à court terme pour les contrats à terme sur l'or, qui combine deux approches : le suivi de tendance et le retournement intraday. Elle permet non seulement de capturer les profits dans les marchés en tendance, mais aussi de prendre des bénéfices en temps opportun lors des retournements de marché et d'ouvrir une position en sens inverse. Cette stratégie a été classée pendant 15 années consécutives parmi les dix stratégies de trading l
PRISM TRAIL SURGE SuperTrend Direction + Stochastic Recovery for XAUUSD Prism Trail Surge is a professional Gold trading indicator designed to identify trend-aligned recovery opportunities supported by directional structure, momentum recovery, and volatility-based trade levels. The indicator combines SuperTrend direction analysis with Stochastic recovery confirmation, an internal Gann and Fibonacci price-alignment engine, confirmed-can
Caicai L&S Yield Histogram Important Notice: This indicator is an integral tool of the automated EA Caicai Long and Short Pair Trading . This indicator visually displays the percentage deviation (Yield %) of a pair's current spread relative to its own historical mean. It is an excellent tool for quickly visualizing the gross financial potential of a market distortion in Long & Short operations. Main Features: Percentage Visualization: Understand the size of the distortion in palpable percentage
Pivot Points MT5 is a universal color multicurrency/multisymbol indicator of the Pivot Points levels systems. You can select one of its three versions: Standard Old, Standard New and Fibo . It plots pivot levels for financial instruments in a separate window . The system will automatically calculate the Pivot Point on the basis of market data for the previous day ( PERIOD_D1 ) and the system of support and resistance levels, three in each. A user can choose colors for the indicator lines. The on
Gold Trader Pro is an advanced analytical tool specifically engineered for professional trading on XAUUSD (Gold). It provides an immediate comprehensive overview of market structure across 7 different timeframes, allowing traders to identify flow direction and signal strength through a modern, draggable, and interactive interface. Key Features Multi-Timeframe Analysis: Real-time monitoring of M1, M5, M15, M30, H1, H4, and D1. Two Operational Modes: MODE_SCALPING: Optimized for fast-paced analys
FREE
Price Magnet — Price Density and Attraction Levels Indicator Price Magnet is a professional analytical tool designed to identify key support and resistance levels based on statistical Price Density. The indicator analyzes a specified historical period and detects price levels where the market spent the most time. These zones act as “magnets,” attracting price action or forming a structural base for potential reversals. Unlike traditional Volume Profile tools, Price Magnet focuses on price-time d
This script provides basic pivot point Support and Resistance Levels to the user whilst displaying Break signal tags. It also has the ability to let the user display more significant breaks by filtering using the Volume Oscillator. Only more significant breaks of these basic levels are displayed to the user when optimized which avoids noise and messy signals. It will also display breaks with candles it deems to be bullish (e.g. having a longer upper or lower wick). Notation The notation
Key level wedge MT5
Presley Annais Tatenda Meck
The   Key level wedge MT5   indicator automatically draws rising wedge pattern and falling wedge pattern for you on the chart. This pattern is really good when used as a confirmation entry at key support & resistance, supply & demand and reversal zones. Advantages  The   Key level wedge MT5   block DOES NOT RE-PAINT, giving you confidence when a signal appears and also helps when looking back.  The   Key level wedge MT5   includes an on/off button on the chart to easily keep the charts clean
HAS RSI Signal — Indicateur de Tendance Professionnel avec Calcul SL/TP HAS RSI Signal est un outil de trading puissant combinant des classiques éprouvés et des algorithmes modernes de filtrage du bruit. L'indicateur analyse le marché à travers le prisme des bougies Heiken Ashi Smoothed (HAS) et de l'oscillateur RSI , offrant au trader des signaux d'entrée clairs lors des retournements de tendance ou des sorties de zones de surachat/survente. Principaux Avantages : Double Filtrage : L'utilisatio
Pivot Confluence Zones   est un   indicateur d'analyse technique pour MT4 et MT5   conçu pour identifier   les zones de retracement   ,   les zones de retournement   et   les niveaux de support et de résistance   en combinant   les points pivots   ,   les retracements de Fibonacci   ,   l'ATR   et   l'ADR   dans un espace de trading unique. Au lieu de s'appuyer sur un seul outil technique, cet indicateur recherche les   zones de confluence   où plusieurs niveaux de trading se chevauchent, aidant
Advanced Support and Resistance Support and resistance levels are widely used in trading. They are important as they show some key price levels. Before applying any strategy, one may consider it necessary to draw support and resistance. However, this process can take much time especially if one is to analyse a lot of currency pairs, commodities or indices. This Advanced Support and Resistance tool was designed for traders at any level, amateur to professional. It plots key support and resistance
FarOne Engine Gann Magnet MTF MT5 - Multi Timeframe Institutional Levels OVERVIEW FarOne Engine Gann Magnet is a professional Multi-Timeframe indicator that shows key institutional levels based on Gann 50% theory. It helps traders identify strong Buy Zones and Sell Zones across 7 timeframes: M1 to D1. KEY FEATURES Multi Timeframe Analysis: M1, M5, M15, M30, H1, H4, D1 in one chart Automatic Levels: High, Low, Buy Zone, Sell Zone Smart Dashboard: Real-time status for each timeframe - MAG
Accès Officiel à l’Écosystème BlueDigitsFx Recevez les mises à jour de l’infrastructure, les ressources de workflow, les nouveaux produits et l’accès à l’écosystème officiel BlueDigitsFx. Écosystème Telegram Site Web Version MT4 BlueDigitsFx Spike And Strike Reversal MT5 — Oscillateur Composite pour l’Analyse des Retournements et du Momentum BlueDigitsFx Spike And Strike Reversal est un oscillateur composite qui combine plusieurs signaux d’indicateurs afin d’aider les traders à identifier le
Smart Trendlines MT5
Suvashish Halder
5 (3)
Smart Trendlines – No.1 Trendlines Indicator Smart Trendlines is a precision tool that automatically draws trendlines based on every valid pivot point, helping traders identify key support and resistance zones. It continuously adjusts as new market pivots form, providing a live and accurate reflection of price structure. Whether you’re tracking trends, preparing for reversals, or anticipating breakouts — this indicator keeps you one step ahead. It works seamlessly across all assets including For
Support & Resistance MT5 Description Support & Resistance MT5 is a MetaTrader 5 indicator that automatically identifies and draws support and resistance levels on the chart. The indicator helps traders quickly locate important price levels that may act as areas of buying or selling interest, reducing the need to draw levels manually. It is suitable for traders who use support and resistance as part of their technical analysis. Features Automatic support level detection Automatic resistance level
Heiken Ashi Supertrend Combine
Tri Yasin Satrio Adji Pranoto
Headline: Stop Guessing, Start Winning. Unleash the Power of the Heiken Ashi Supertrend Indicator. Body: Are you tired of market noise, confusing charts, and missed opportunities? The Heiken Ashi Supertrend Indicator is the ultimate tool designed to bring clarity and confidence to your trading, once and for all. We've combined two of the most powerful concepts in technical analysis into one seamless, easy-to-use indicator: Crystal-Clear Trends with Heiken Ashi: Say goodbye to choppy price action
Smc Session Killzone and Breakout The Smc Session Killzone and Breakout indicator automates the institutional session trading model for MetaTrader 5. It draws the Asian, London, and New York session ranges as labelled boxes on the chart, detects when price sweeps beyond the Asian session high or low, and fires a non-repainting entry signal after a Market Structure Shift is confirmed. All signals are based on closed bars and do not repaint. The underlying model follows the sequence that institut
FREE
SMC Alpha Engine SMC Alpha Engine is a Smart Money Concepts indicator for MetaTrader 5 designed to identify Order Blocks, Fair Value Gaps, Liquidity Sweeps, and market structure changes directly on the chart. The indicator focuses on displaying the most recent valid Order Block together with automatically calculated TP and SL levels for simplified chart analysis. Main Features Automatic Order Block detection Buy and Sell zone visualization Automatic TP and SL calculation Fair Value Gap (FVG) det
"Adjustable Fractals" - est une version avancée de l'indicateur fractal, un outil de trading très utile ! - Comme nous le savons, l'indicateur fractal standard MT5  n'a aucun paramètre - c'est très gênant pour les traders. - Les fractales ajustables ont résolu ce problème - il dispose de tous les paramètres nécessaires : - Période réglable de l'indicateur (valeurs recommandées - supérieures à 7). - Distance réglable par rapport aux hauts/bas du prix. - Conception réglable des flèches fractales.
Footprint is an indicator for order flow and volume analysis. It helps identify market structure at the cluster level, find key zones with increased activity, and work with filters directly on the chart without constantly opening the settings window. Footprint Indicator Features cluster-based Bid x Ask and Delta charts; on-chart control panel; sliders for filter adjustments; Absorption; Initiative; Stacked Imbalances; Big Trades; dPOC / Dynamic Point of Control; Delta; side market profile; cumul
Trade smarter, not harder: Empower your trading with Harmonacci Patterns This is arguably the most complete harmonic price formation auto-recognition indicator you can find for the MetaTrader Platform. It detects 19 different patterns, takes fibonacci projections as seriously as you do, displays the Potential Reversal Zone (PRZ) and finds suitable stop-loss and take-profit levels. [ Installation Guide | Update Guide | Troubleshooting | FAQ | All Products  ] It detects 19 different harmonic pric
MTF MA Color Candles Alert helps traders read moving-average context faster by replacing regular candles with four customizable candle colors. The indicator can use the current timeframe or a selected higher timeframe moving average. For example, a trader can view M5 price action while coloring the candles from an H1 or H4 moving average condition. Main features: - Multi-timeframe MA source: current, M5, M15, M30, H1, H4, D1, and W1 - Moving average period, method, and applied price are adjus
Multi-Timeframe PO3 Projection Multi-Timeframe PO3 Projection is a clean and practical MetaTrader 5 indicator designed to project multiple higher-timeframe candles directly on your active chart. Instead of switching between H1, H4, D1, and other higher timeframes, this indicator lets you view their live candle structure side by side. It helps traders track the current higher-timeframe open, high, low, close, and candle direction while staying on the chart timeframe they are actively trading. The
Indicateur Balance of Power (BOP) avec support multi-timeframe, signaux visuels personnalisables et système d'alertes configurable. Les services de programmation freelance, les mises à jour et autres produits TrueTL sont disponibles sur mon profil MQL5 . Les retours et avis sont très appréciés ! Qu'est-ce que le BOP ? Balance of Power (BOP) est un oscillateur qui mesure la force des acheteurs par rapport aux vendeurs en comparant la variation du prix à la plage de la bougie. L'indicateur est
FREE
This is FVG PRO with our Indication Panel. The FVG LITE is available for free without the side panel. Watch the FVG Indicator v2 work live on the chart. This tool automatically detects Fair Value Gaps,  price imbalances where the market moved too fast and left unfinished business, and flags them as potential support and resistance zones. The panel on the left shows the trend direction across four timeframes simultaneously, so you can see at a glance whether the big picture agrees with what pr
Les acheteurs de ce produit ont également acheté
Ce produit a été mis à jour pour le marché 2026 et optimisé pour les dernières versions de MT5. AVIS DE MISE À JOUR DU PRIX : Smart Trend Trading System est actuellement disponible à $99 . Le prix passera à $199 après les 30 prochains achats . OFFRE SPÉCIALE : Après avoir acheté Smart Trend Trading System, envoyez-moi un message privé pour recevoir Smart Universal EA GRATUITEMENT et transformer vos signaux Smart Trend en trades automatisés. Smart Trend Trading System est un système de trading c
SuperScalp Pro
Van Minh Nguyen
4.69 (29)
SuperScalp Pro –  Système Professionnel de Scalping à Confluence Multicouche SuperScalp Pro est un système professionnel de scalping à confluence multicouche, conçu pour aider les traders à identifier des opportunités à plus forte probabilité grâce à des confirmations d'entrée plus claires, des niveaux de Stop Loss et de Take Profit basés sur l'ATR, ainsi qu'un filtrage flexible des signaux sur le XAUUSD, le BTCUSD et les principales paires de devises du Forex. La documentation complète est disp
Trend Sniper X
Sarvarbek Abduvoxobov
5 (7)
Trend Sniper X est un indicateur de suivi de tendance multi-période pour MetaTrader 5 qui aide les traders à identifier la direction de la tendance et les points de retournement potentiels avec clarté et précision. Informations sur le prix : Le prix actuel est un prix promotionnel et est sujet à changement à mesure que les futures mises à jour et nouvelles fonctionnalités seront publiées. Canal Code2Profit Maîtrisez le marché grâce à l'analyse multi-période ! Spécifications techniques Plateforme
Commençons par être honnêtes. Aucun indicateur ne vous rendra rentable à lui seul. Si quelqu’un vous dit le contraire, il vous vend un rêve. Tout indicateur qui affiche des flèches parfaites d’achat/vente peut être rendu impeccable — il suffit de zoomer sur la bonne partie de l’historique et de capturer uniquement les trades gagnants. Nous ne faisons pas cela.  SMC Intraday Formula est un outil. Il lit la structure du marché pour vous, identifie les zones de prix à la probabilité la plus élevée
Welcome to ENTRY IN THE ZONE AND SMC MULTI TIMEFRAME Entry In The Zone and SMC Multi Timeframe is a professional trading indicator built on Smart Money Concepts (SMC) , combining market structure analysis with a No Repaint BUY / SELL signal system in a single indicator. It helps traders understand market structure more clearly, identify key price zones, and focus on higher-quality trading opportunities. By combining Multi-Timeframe Analysis , Points of Interest (POIs) , and real-time signals, th
M1 Quantum MT5
Hamed Dehgani
4.6 (10)
Signaux de Trading en Direct avec M1 Quantum : Signal   (L’opération est exécutée automatiquement par le Quantum Trade Assistant , inclus gratuitement avec ce produit.) Plan de prix : Prix actuel : $169 (Offre de lancement) Prochain prix prévu : $189 Prix de vente prévu : $299 Note du développeur : Après votre achat, veuillez me contacter pour recevoir le dernier fichier de configuration recommandé (Set File) , des conseils d'utilisation, ainsi qu'une invitation au groupe d'assistance VIP , où
Neuro Poseidon MT5
Daria Rezueva
4.8 (54)
Neuro Poseidon is a new indicator by Daria Rezueva. It combines precise trading signals with adaptive TP/SL levels - creating best possible trades as a result! Message me and get  Neuro Poseidon Assistant  as a gift to automize your trading process! What makes it stand out? 1. Proven profitability on all assets and timeframes 2. Only confirmed BUY and SELL signals present on the chart 3. Adaptive TP & SL levels generated by the software for each trade 4. Easy to understand - suitable for al
La légende est de retour : Entry Points Pro 10. La relance de l'indicateur légendaire qui s'est maintenu 3 ans dans le Top-3 du MQL5 Market. Des centaines d'avis enthousiastes (589 sur les deux versions), des milliers de traders l'utilisent chaque jour, 31 000+ téléchargements de la démo   MT4+MT5 . J'ai lu chacun de vos avis publiés en cinq ans — et au lieu de promettre, j'ai intégré les réponses directement dans la version 10. Par un auteur présent sur les marchés depuis 1999, qui tient à l'ho
L'indicateur UZFX {SSS} Scalping Smart Signals v4.0 MT5 est un indicateur de trading haute performance sans « repaint », conçu pour les scalpers, les day traders et les swing traders qui recherchent des signaux précis et en temps réel sur des marchés très volatils. Développé par (UZFX-LABS), cet indicateur combine l'analyse de l'action des prix, la confirmation de tendance et un filtrage intelligent pour générer des signaux d'achat et de vente à forte probabilité, des signaux d'alerte et des opp
Divergence Bomber
Ihor Otkydach
4.9 (92)
Chaque acheteur de cet indicateur reçoit également gratuitement : L’outil exclusif « Bomber Utility », qui accompagne automatiquement chaque opération de trading, fixe les niveaux de Stop Loss et de Take Profit, et clôture les positions selon les règles de la stratégie Des fichiers de configuration (set files) pour adapter l’indicateur à différents actifs Des set files pour configurer le Bomber Utility selon différents modes : « Risque Minimum », « Risque Équilibré » et « Stratégie d’Attente » U
Gann Made Easy   est un système de trading Forex professionnel et facile à utiliser qui est basé sur les meilleurs principes de trading en utilisant la théorie de mr. WD Gann. L'indicateur fournit des signaux d'ACHAT et de VENTE précis, y compris les niveaux Stop Loss et Take Profit. Vous pouvez échanger même en déplacement en utilisant les notifications PUSH. VEUILLEZ ME CONTACTER APRÈS L'ACHAT POUR RECEVOIR GRATUITEMENT DES INSTRUCTIONS DE TRADING ET D'EXCELLENTS INDICATEURS SUPPLÉMENTAIRES! V
Atomic Analyst MT5
Issam Kassas
4.36 (45)
Ce produit a été mis à jour pour le marché 2026 et optimisé pour les dernières versions de MT5. AVIS DE MISE À JOUR DU PRIX : Atomic Analyst est actuellement disponible à $99 . Le prix passera à $199 après les 30 prochains achats . OFFRE SPÉCIALE : Après avoir acheté Atomic Analyst, envoyez-moi un message privé pour recevoir Smart Universal EA GRATUITEMENT et transformer vos signaux Atomic Analyst en trades automatisés. Atomic Analyst est un indicateur de trading Price Action sans repaint, san
GoldenX Entry MT5
Kareem Abbas
5 (14)
GoldenX Entry est un indicateur MT5 doté d’un algorithme adaptatif Smart Entry Trend, d’un système de scoring des signaux, d’un détecteur de régime de marché et d’un filtre de volatilité. Chaque signal inclut un niveau d’entrée calculé, trois niveaux de Take-Profit (TP1, TP2, TP3) ainsi qu’un niveau de Stop-Loss. Il est construit sur plusieurs couches analytiques conçues pour s’adapter à différentes conditions de marché, combinant un système analytique multicouche avec un optimiseur intégré et u
Zoryk Gold
Reda El Koutbane
5 (3)
ZORYK — Système avancé de signaux XAUUSD pour MetaTrader 5 Vous connaissez certainement cette sensation. Vous passez du temps à analyser l’or. Vous attendez le bon point d’entrée. Vous ouvrez enfin la position, puis le prix commence immédiatement à évoluer contre vous. Vous fermez trop tôt, déplacez le Stop Loss ou hésitez pendant quelques secondes. Ensuite, le marché atteint exactement l’objectif que vous aviez initialement prévu, mais sans vous dans la position. Le problème n’était pas toujour
Power Candles MT5
Daniel Stein
5 (9)
Power Candles V3 - Indicateur de force à optimisation automatique Power Candles V3 transforme la force des devises et des instruments en un plan de trading exploitable sur chaque graphique auquel il est associé. Au lieu de se contenter de colorer les bougies, il effectue une optimisation automatique en temps réel en arrière-plan et vous fournit les meilleurs niveaux de Stop Loss, Take Profit et seuils de signal pour le symbole que vous avez sous les yeux. Un simple clic suffit pour l'adopter en
Crystal Heikin Ashi Signals
Muhammad Jawad Shabir
5 (2)
Crystal Heikin Ashi Signals - Professional Trend & Signal Detection Indicator Advanced Heikin Ashi Visualization with Intelligent Signal System for Manual & Automated Trading Final Price: $149 ---------> Price goes up $10 after every 10 sales . Limited slots available — act fast . Overview Crystal Heikin Ashi Signals is a professional-grade MetaTrader 5 indicator that combines pure Heikin Ashi candle visualization with an advanced momentum-shift detection system. Designed for both manual traders
Quantum TrendPulse
Bogdan Ion Puscasu
5 (25)
Présentation de   Quantum TrendPulse   , l'outil de trading ultime qui combine la puissance de   SuperTrend   ,   RSI   et   Stochastic   dans un seul indicateur complet pour maximiser votre potentiel de trading. Conçu pour les traders qui recherchent précision et efficacité, cet indicateur vous aide à identifier les tendances du marché, les changements de dynamique et les points d'entrée et de sortie optimaux en toute confiance. Caractéristiques principales : Intégration SuperTrend :   suivez f
M1 Sniper MT5
Oleg Rodin
5 (4)
M1 SNIPER   est un système d'indicateurs de trading facile à utiliser. Il s'agit d'un indicateur à flèche conçu pour l'unité de temps M1. Cet indicateur peut être utilisé seul pour le scalping sur l'unité de temps M1 ou intégré à votre système de trading existant. Bien que conçu spécifiquement pour le trading sur l'unité de temps M1, ce système peut également être utilisé avec d'autres unités de temps. Initialement, j'avais conçu cette méthode pour le trading du XAUUSD et du BTCUSD. Cependant, j
ARIPoint
Temirlan Kdyrkhan
1 (1)
ARIPoint is a powerful trading companion designed to generate high-probability entry signals with dynamic TP/SL/DP levels based on volatility. Built-in performance tracking shows win/loss stats, PP1/PP2 hits, and success rates all updated live. Key Features: Buy/Sell signals with adaptive volatility bands Real-time TP/SL/DP levels based on ATR Built-in MA Filter with optional ATR/StdDev volatility Performance stats panel (Success, Profit/Loss, PP1/PP2) Alerts via popup, sound, push, or email Cu
Ce produit a été mis à jour pour le marché 2026 et optimisé pour les dernières versions de MT5. AVIS DE MISE À JOUR DU PRIX : Smart Price Action Concepts est actuellement disponible à $200 . Le prix passera à $299 après les 30 prochains achats . OFFRE SPÉCIALE : Après l’achat, envoyez-moi un message privé pour recevoir un bonus gratuit + un cadeau . Tout d’abord, il est important de souligner que cet outil de trading est un indicateur sans repaint, sans redrawing et sans retard, ce qui le rend
Présentation       Quantum Breakout PRO   , l'indicateur révolutionnaire MQL5 qui transforme la façon dont vous négociez les zones d'évasion ! Développé par une équipe de traders expérimentés avec une expérience commerciale de plus de 13 ans,       Évasion quantique PRO       est conçu pour propulser votre parcours commercial vers de nouveaux sommets grâce à sa stratégie de zone de discussion innovante et dynamique. Quantum Breakout Indicator vous donnera des flèches de signalisation sur les z
FX Power MT5 NG
Daniel Stein
5 (33)
FX Power : Analysez la force des devises pour des décisions de trading plus intelligentes Aperçu FX Power est l'outil essentiel pour comprendre la force réelle des principales devises et de l'or, quelles que soient les conditions du marché. En identifiant les devises fortes à acheter et les faibles à vendre, FX Power simplifie vos décisions de trading et révèle des opportunités à forte probabilité. Que vous suiviez les tendances ou anticipiez les retournements à l'aide de valeurs extrêmes de D
Axiom Matrix
Issam Kassas
5 (4)
AXIOM MATRIX MT5 PRIX DE LANCEMENT : $99 Axiom Matrix est disponible au prix de lancement de $99. Le prix passera à $199 après les 30 premiers achats. Après votre achat, envoyez-moi un message direct pour recevoir les instructions et réclamer votre bonus cadeau exclusif. Axiom Matrix est un scanner de marché professionnel multi-symboles et multi-timeframes, ainsi qu’un tableau de bord de décision pour MetaTrader 5. Il scanne votre Market Watch, analyse plusieurs timeframes, lit plusieurs moteurs
DayTrader PRO
Davit Beridze
5 (1)
DayTrader PRO DayTrader PRO est un indicateur de trading avancé qui combine le filtre Laguerre de John Ehlers avec un puissant moteur d'auto-optimisation. Au lieu d'utiliser des paramètres fixes, l'indicateur recherche automatiquement les meilleurs réglages en fonction des conditions récentes du marché, vous aidant à vous adapter à la volatilité changeante sans ajustements manuels constants. L'indicateur génère des signaux clairs d'ACHAT (BUY) et de VENTE (SELL), accompagnés de niveaux de Stop L
The Oracle Pro
Ottaviano De Cicco
5 (1)
The Oracle Pro: Synthetic Multi-Timeframe Bias Engine for MT5 ️ Summer Launch Offer — Get The Oracle Pro for USD 199 (early buyers). Price rises with traction; final price USD 399. The Oracle Pro is a premium multi-timeframe bias engine for MetaTrader 5, built for demanding and professional traders. It answers one question with discipline: what is the directional bias on each timeframe right now, how strong is it, and how much do the timeframes agree? Everything is computed on closed bars only
Currency Strength Wizard   est un indicateur très puissant qui vous offre une solution tout-en-un pour un trading réussi. L'indicateur calcule la puissance de telle ou telle paire de devises en utilisant les données de toutes les devises sur plusieurs périodes. Ces données sont représentées sous la forme d'un indice de devise facile à utiliser et de lignes électriques de devise que vous pouvez utiliser pour voir la puissance de telle ou telle devise. Tout ce dont vous avez besoin est d'attacher
Reversion King Indicator
Eugen-alexandru Zibileanu
5 (5)
Un nouveau Roi en ville - Indicateur + Gestion des ordres (TP1 + TP2 + TP3) + Envoi optionnel de signaux Telegram INCLUS (GRATUIT) (SYSTÈME COMPLET DE TRADING et DE SIGNAUX) Notre meilleur EA pour l’Or : Gold Slayer Cet indicateur inclut une stratégie avancée, un système de trading avec gestion des ordres personnalisable ainsi qu’un système de retour à la moyenne combinant des extensions d’enveloppes, soutenu par plusieurs filtres intelligents de confirmation comme le RSI afin de détecter des en
Actualités du produit : Strategy Assistant a été mis à jour vers la nouvelle version 1.8 avec des performances plus rapides, une interface professionnelle repensée et une expérience utilisateur améliorée. Note du développeur : Strategy Assistant est en développement continu avec des mises à jour et des améliorations régulières. Vous pouvez demander des modèles spécifiques que vous souhaitez voir ajoutés. Note sur le prix : Le prix actuel reste à 50 $ pour les 100 premiers utilisateurs . Après c
Smc Pro ToolKit
Talal N Z Aljarusha
5 (3)
SMC Pro ToolKit  is a professional chart-based Smart Money Concepts indicator for MetaTrader 5. It helps traders read market structure, identify key liquidity areas, organize trade context, and plan setups directly from the chart. This is not a simple buy/sell arrow indicator. It is a complete visual trading toolkit that combines Smart Money Concepts, multi-timeframe analysis, session context, setup planning, risk assistance, and professional dashboard tools in one clean workspace. Watch setup
Atbot
Zaha Feiz
4.69 (55)
AtBot : Comment ça fonctionne et comment l'utiliser ### Comment ça fonctionne L'indicateur "AtBot" pour la plateforme MT5 génère des signaux d'achat et de vente en utilisant une combinaison d'outils d'analyse technique. Il intègre la Moyenne Mobile Simple (SMA), la Moyenne Mobile Exponentielle (EMA) et l'indice de la Plage Vraie Moyenne (ATR) pour identifier les opportunités de trading. De plus, il peut utiliser des bougies Heikin Ashi pour améliorer la précision des signaux. Laissez un avis ap
Filtrer:
Aucun avis
Répondre à l'avis