Multi Timeframe Analysis Dashboard
- Indicators
-
Thomas Edelbroek
 Trading since 2016 and interested in automated trading since the end of 2016. Started my own business 'Startenmettraden.nl' and start-with-trading.com' to help others to succeed in trading as well.
 - Version: 1.0
- Activations: 5
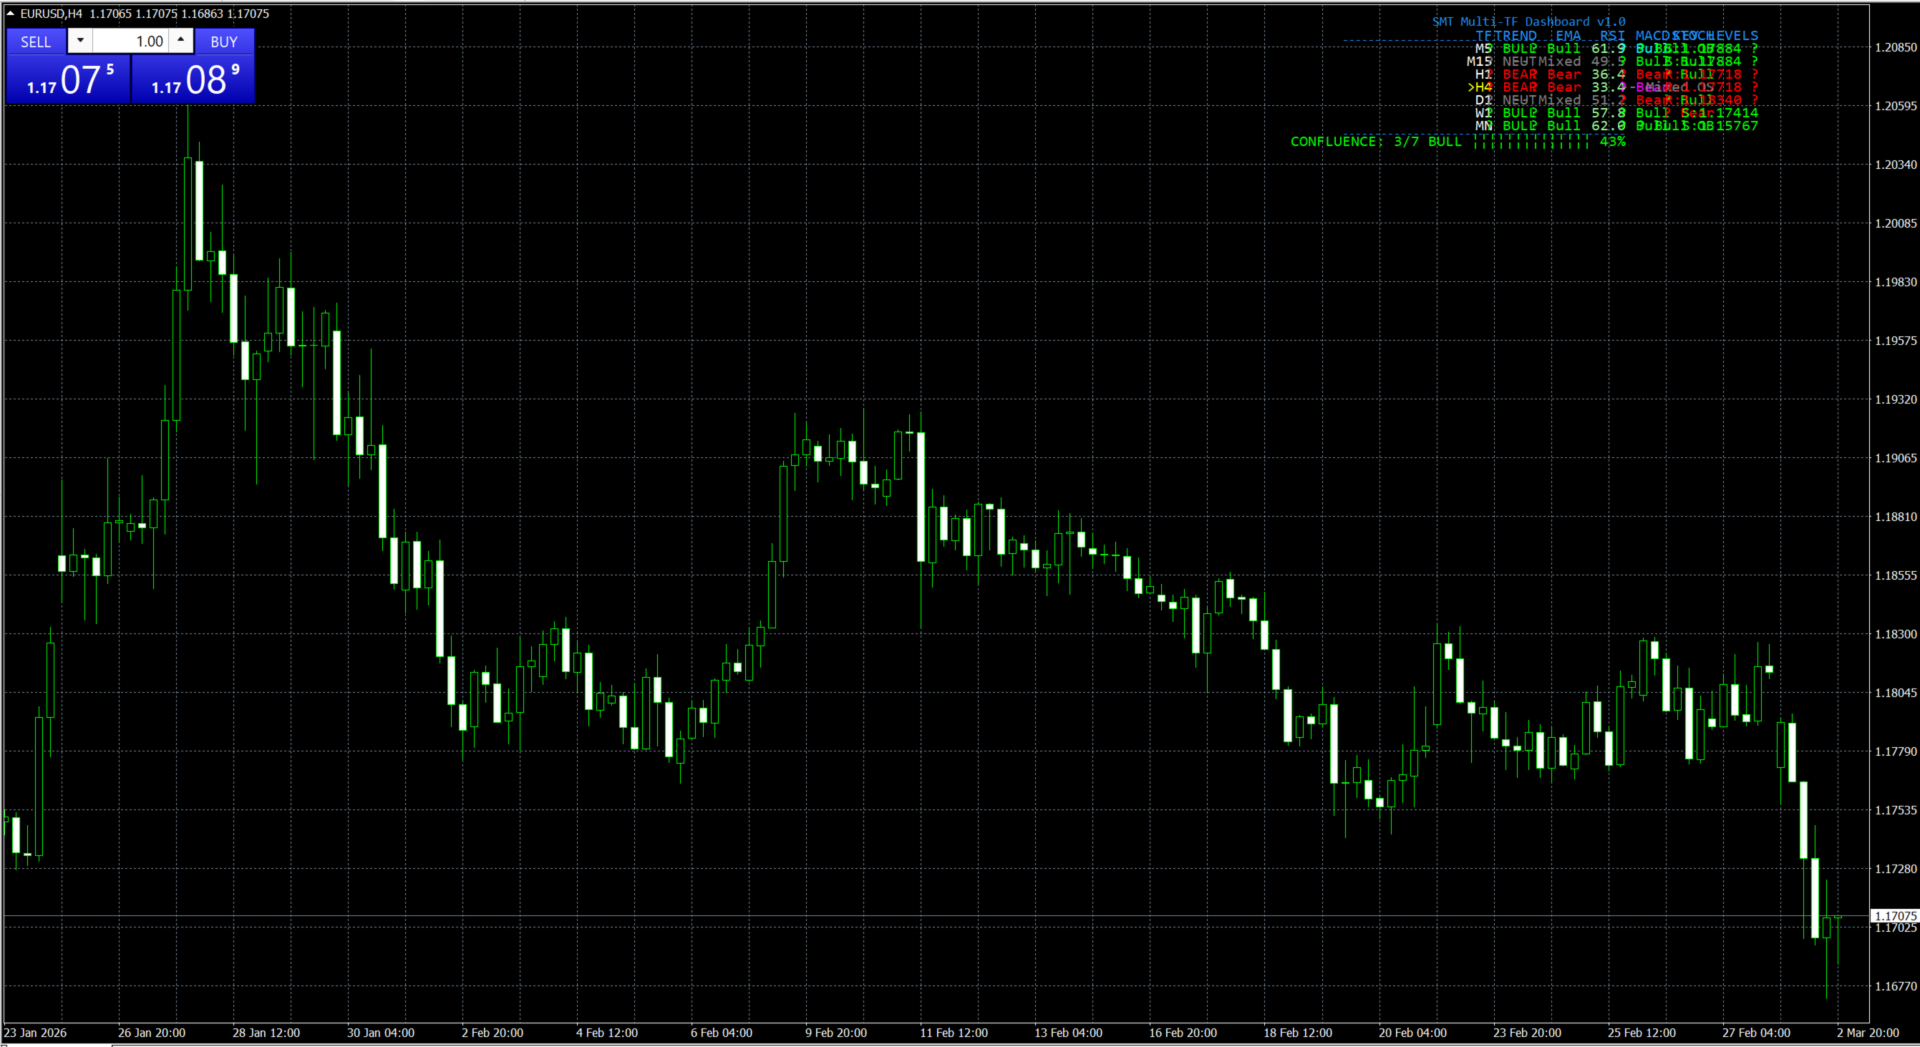
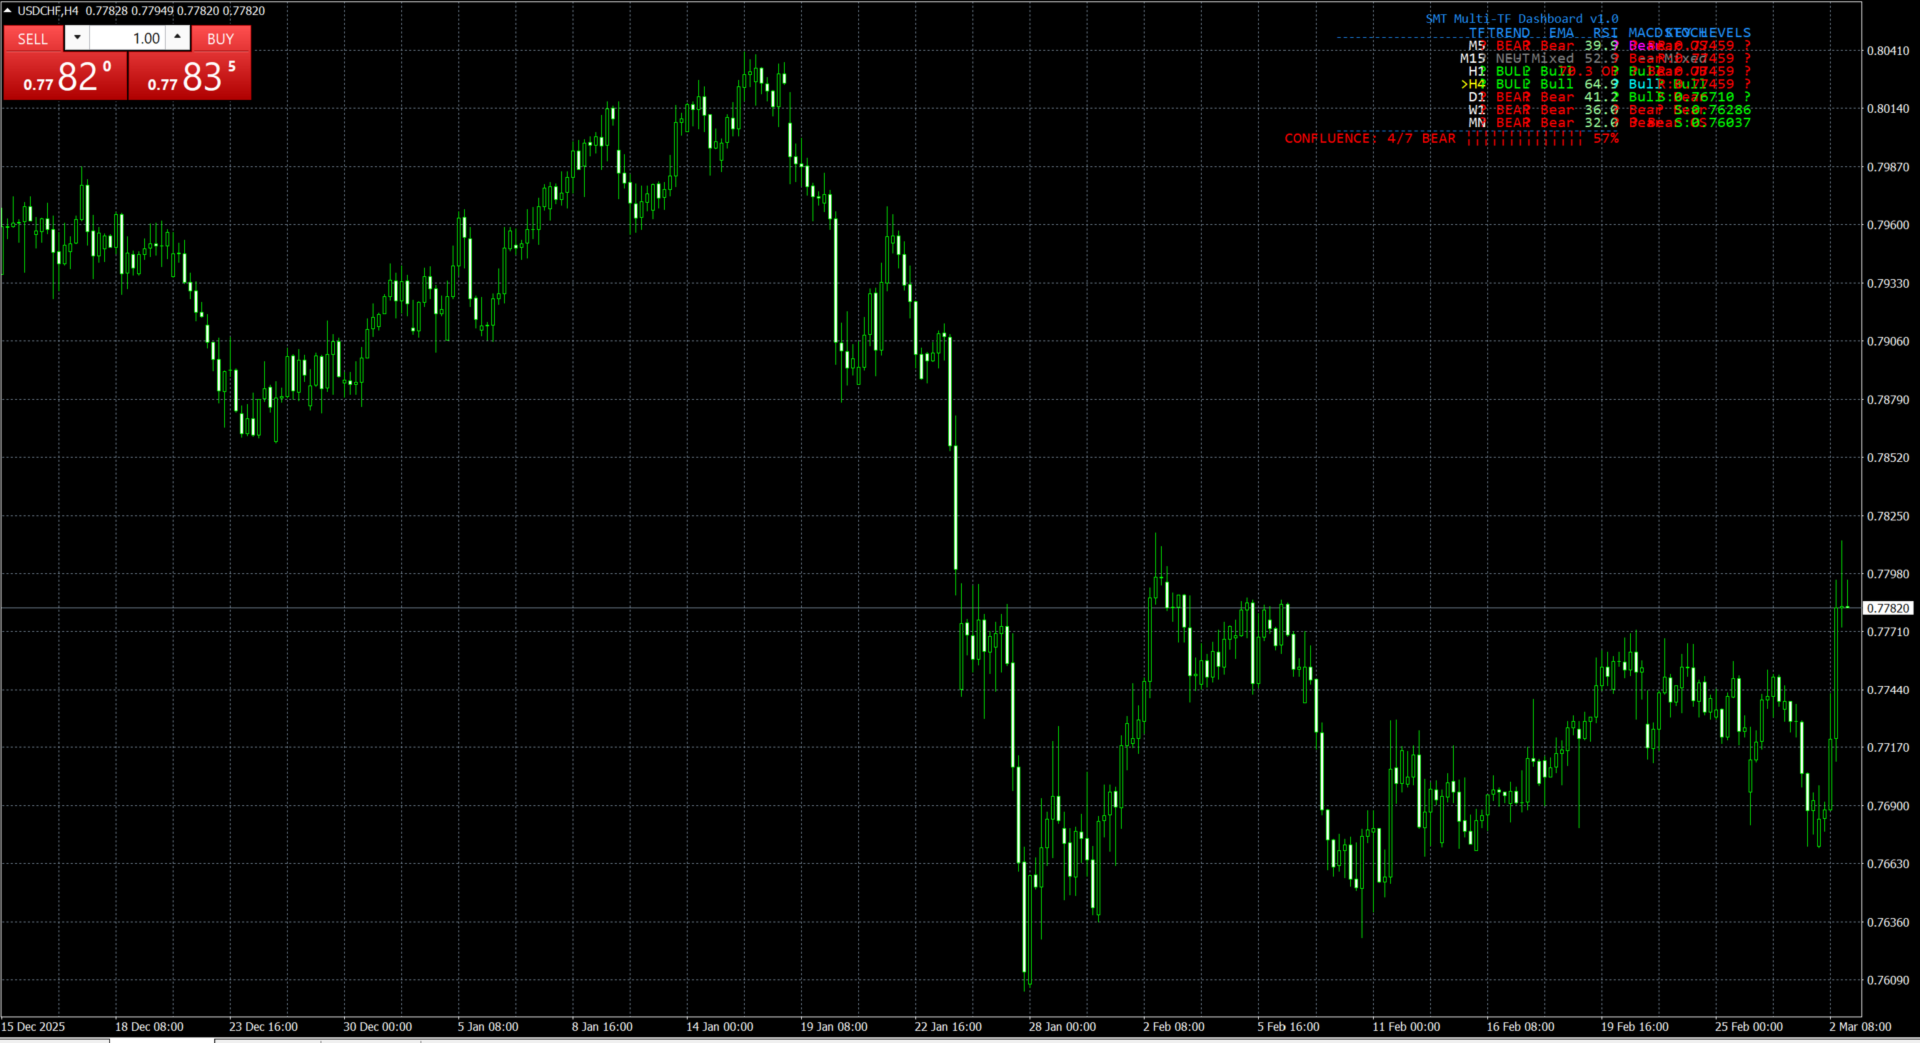
SMT Multi-TF Dashboard is a professional multi-timeframe analysis panel for MetaTrader. It displays trend direction, EMA status, RSI, MACD, Stochastic and key support/resistance levels across seven timeframes simultaneously in a single on-chart dashboard.
How it works
The indicator scans M5, M15, H1, H4, D1, W1 and MN timeframes and calculates a composite trend score for each using EMA positioning, market structure analysis (higher highs/higher lows detection) and ADX directional strength. All calculations use the confirmed closed bar (shift 1) to prevent repainting. Results are displayed in a color-coded table directly on your chart.
Dashboard Columns
TF: Timeframe label with optional highlighting of the current chart timeframe. TREND: Composite trend direction combining EMA alignment, market structure (HH/HL or LH/LL) and ADX directional index into a single bullish, bearish or neutral reading. EMA: Fast and slow EMA crossover status showing whether price is above or below both moving averages in proper alignment. RSI: Relative Strength Index value with overbought and oversold zone identification. MACD: MACD line versus signal line status with recent crossover detection highlighted in a brighter color. STOCH: Stochastic oscillator direction with overbought and oversold zone labels. KEY LEVELS: Nearest support or resistance level derived from previous session, day, week, month or quarter high/low depending on the timeframe, with a confluence icon when multiple timeframe levels align within a configurable pip range.
Confluence Meter
A visual progress bar at the bottom of the dashboard shows how many timeframes agree on directional bias. When the count reaches the configurable threshold, the meter highlights to signal strong multi-timeframe alignment. This helps identify high-probability trade setups where multiple timeframes confirm the same direction.
Alert System
Alignment Alert: Triggers when the number of agreeing timeframes reaches the confluence threshold. Bias Flip Alert: Fires when any monitored timeframe changes from bullish to bearish or vice versa. RSI Extreme Alert: Notifies when RSI enters overbought or oversold territory on any timeframe. Key Level Proximity Alert: Warns when price approaches a key support or resistance level within a configurable pip distance. All alerts support popup, push notification, email, sound, or all methods simultaneously.
Input Parameters
Color_Theme: Select Dark, Light or Custom theme. Bull_Color, Bear_Color, Neutral_Color, Panel_BG_Color: Custom theme colors. DashboardCorner: Position the panel in any chart corner. DashboardScale: Small, Medium or Large text size. ShowCurrentTF_Highlight: Mark the current chart timeframe in the table. Show_M5 through Show_MN: Enable or disable individual timeframes. EMA_Fast_Period (default 9), EMA_Slow_Period (default 21): Moving average periods for trend and EMA columns. ADX_Period (default 14): ADX period for trend strength component. Structure_Lookback (default 10): Bars used to detect swing highs and swing lows for market structure analysis. RSI_Period (default 14), RSI_OB_Level (default 70), RSI_OS_Level (default 30): RSI calculation settings. MACD_Fast (default 12), MACD_Slow (default 26), MACD_Signal (default 9): MACD parameters. Stoch_K_Period (default 14), Stoch_D_Period (default 3), Stoch_Slowing (default 3): Stochastic parameters. ShowKeyLevels: Toggle the key levels column. LevelConfluence_Pips (default 10): Pip distance within which levels from different timeframes are considered confluent. ShowConfluence: Toggle the confluence meter. Confluence_MinTF (default 5): Minimum number of aligned timeframes to trigger the confluence highlight and alignment alert. Alert_Alignment, Alert_BiasFlip, Alert_RSI_Extreme, Alert_KeyLevel: Individual alert toggles. Alert_KeyLevel_Distance (default 15): Pips from a key level to trigger the proximity alert. Alert_Method: Select Popup, Push, Email, Sound or All.
Recommended Settings
Attach the indicator to any chart. The dashboard reads data from all enabled timeframes regardless of the chart timeframe you are viewing. Default indicator periods work well for forex majors. For indices or commodities, consider increasing the Structure_Lookback to 15-20. Use the Dark theme for dark chart backgrounds or the Light theme for white backgrounds.
Important Notes
This indicator does not repaint. All readings are based on the confirmed closed bar. The indicator is designed for multi-timeframe analysis and does not generate trade signals. Use it as a decision support tool alongside your own trading strategy. Past market behavior does not guarantee future results.