Ichimoku V2
- Indicators
- Quang Huy Quach
- Version: 3.0
1. Overview
The Ichimoku Kinko Hyo (or Ichimoku Cloud) is a comprehensive, all-in-one technical analysis indicator designed to provide a deep understanding of market trends, momentum, and dynamic support and resistance levels.
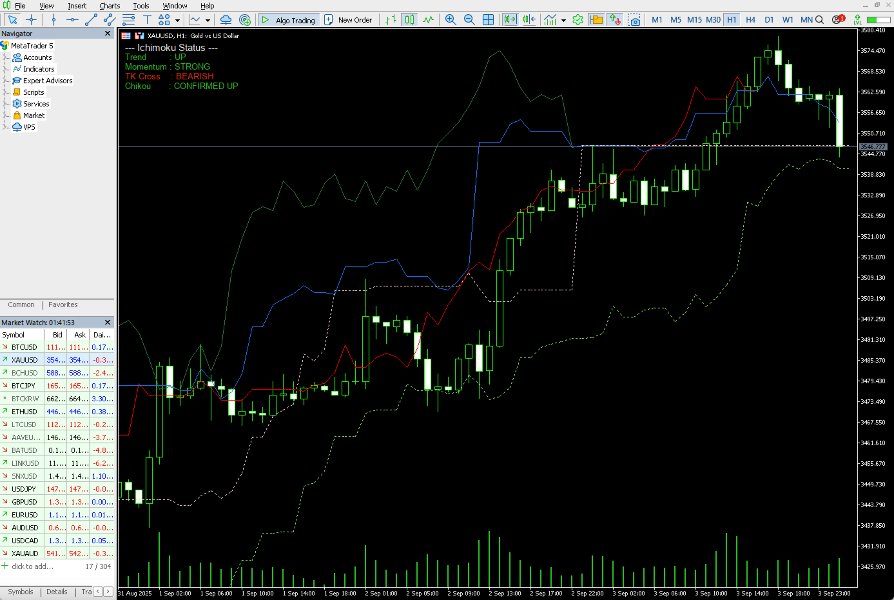
This indicator provides a clean, standard implementation of the five core Ichimoku lines. Its key feature is a non-intrusive Status Dashboard that gives you an at-a-glance summary of the current market situation according to the Ichimoku system, allowing for quick and efficient analysis without cluttering your chart.
This document provides a guide to understanding the components of the indicator and how they can be interpreted as part of a trading strategy.
Disclaimer: This indicator is a tool for market analysis. It does not provide direct trading signals or guarantee any financial results. All trading decisions involve risk, and past performance is not indicative of future results. Always use proper risk management.
2. The Components of Ichimoku
The indicator consists of five main lines and a "cloud" (Kumo).
- Tenkan-sen (Conversion Line): The midpoint of the last 9 periods. It is the fastest moving line and provides early indications of momentum shifts.
- Kijun-sen (Base Line): The midpoint of the last 26 periods. It represents medium-term momentum and acts as a key level of dynamic support and resistance. It is often considered the most important single line in the Ichimoku system.
- Chikou Span (Lagging Span): The current closing price plotted 26 periods in the past. It helps visualize the relationship between the current price and recent price action, providing a powerful confirmation signal.
- Senkou Span A (Leading Span A): The midpoint between the Tenkan-sen and Kijun-sen, plotted 26 periods in the future. It forms one of the boundaries of the Kumo.
- Senkou Span B (Leading Span B): The midpoint of the last 52 periods, plotted 26 periods in the future. It forms the second boundary of the Kumo and represents the long-term trend.
- Kumo (The Cloud): The area between Senkou Span A and Senkou Span B. The Kumo is the heart of the system, representing a dynamic "river" of support and resistance. The color and thickness of the cloud can also indicate the strength of the trend.
3. How to Interpret the Signals
The Ichimoku system provides a layered approach to analysis. A trader typically looks for multiple signals to align before considering a trade.
a) Kumo (The Cloud)
The position of the price relative to the Kumo is the primary indication of the overall trend.
- Bullish Trend: Price is consistently trading above the Kumo. The Kumo itself acts as a support zone.
- Bearish Trend: Price is consistently trading below the Kumo. The Kumo itself acts as a resistance zone.
- Consolidation / Ranging Market: Price is trading inside the Kumo. Trading within the cloud is generally considered high-risk as the trend is undefined.
b) Kijun-sen (Base Line)
The Kijun-sen acts as a reliable indicator of market momentum.
- Bullish Momentum: Price is trading above the Kijun-sen.
- Bearish Momentum: Price is trading below the Kijun-sen.
- A Kijun Cross, where the price crosses the Kijun-sen, can be a significant signal of a change in momentum.
c) TK Cross (Tenkan-sen / Kijun-sen Cross)
This is one of the most common signals used for trade entry.
- Bullish TK Cross: The Tenkan-sen (faster line) crosses above the Kijun-sen (slower line). The strength of this signal is considered higher if it occurs above the Kumo.
- Bearish TK Cross: The Tenkan-sen crosses below the Kijun-sen. The strength of this signal is considered higher if it occurs below the Kumo.
d) Chikou Span (Lagging Span)
The Chikou Span provides final confirmation for a signal.
- Bullish Confirmation: The Chikou Span is above the price line from 26 periods ago (i.e., it is in "open space"). This confirms that there is little resistance to an upward move.
- Bearish Confirmation: The Chikou Span is below the price line from 26 periods ago. This confirms that there is little support to prevent a downward move.
A high-probability setup often involves the confluence of all these signals (e.g., a Bullish TK Cross that happens above the Kumo while the Chikou Span is also in open space).
4. Feature: The Status Dashboard
To simplify analysis, this indicator includes a dashboard that summarizes the state of all the signals on the last closed candle.
- Trend: Shows if the price is UP (above Kumo), DOWN (below Kumo), or NEUTRAL (inside Kumo).
- Momentum: Shows if the price is STRONG (above Kijun) or WEAK (below Kijun).
- TK Cross: Shows the direction of the most recent BULLISH or BEARISH cross.
- Chikou: Shows if the Chikou Span CONFIRMED UP or CONFIRMED DOWN .
5. Input Parameters
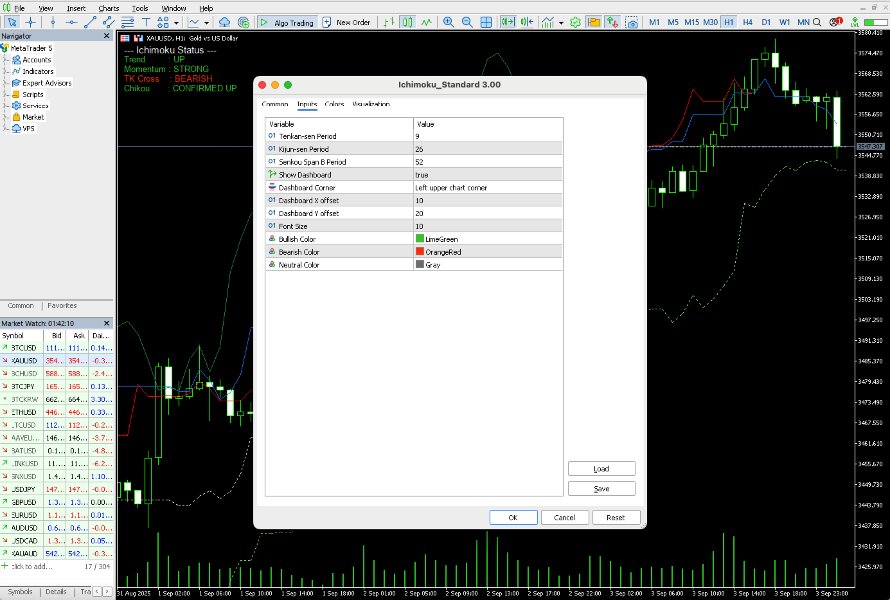
The indicator's settings can be adjusted via the "Inputs" tab.
a) Ichimoku Periods
- InpTenkanPeriods: The lookback period for the Tenkan-sen. Default is 9.
- InpKijunPeriods: The lookback period for the Kijun-sen and the shift period for the Kumo/Chikou. Default is 26.
- InpSenkouPeriods: The lookback period for the Senkou Span B. Default is 52.
b) Dashboard Settings
- InpDashboardOn: true / false . Toggles the visibility of the dashboard.
- InpDashboardCorner: Sets the corner of the chart where the dashboard will appear (e.g., CORNER_LEFT_UPPER ).
- InpDashboardX: The horizontal distance (in pixels) from the corner's edge.
- InpDashboardY: The vertical distance (in pixels) from the corner's edge.
- InpDashboardFontSize: The font size for the dashboard text.
- InpDashboardColorBull: The color used for bullish status text.
- InpDashboardColorBear: The color used for bearish status text.
- InpDashboardColorNeutral: The color used for neutral or undefined status text.

