Ichimoku V2

1. Overview

The Ichimoku Kinko Hyo (or Ichimoku Cloud) is a comprehensive, all-in-one technical analysis indicator designed to provide a deep understanding of market trends, momentum, and dynamic support and resistance levels.

This indicator provides a clean, standard implementation of the five core Ichimoku lines. Its key feature is a non-intrusive Status Dashboard that gives you an at-a-glance summary of the current market situation according to the Ichimoku system, allowing for quick and efficient analysis without cluttering your chart.

This document provides a guide to understanding the components of the indicator and how they can be interpreted as part of a trading strategy.

Disclaimer: This indicator is a tool for market analysis. It does not provide direct trading signals or guarantee any financial results. All trading decisions involve risk, and past performance is not indicative of future results. Always use proper risk management.

2. The Components of Ichimoku

The indicator consists of five main lines and a "cloud" (Kumo).

  • Tenkan-sen (Conversion Line): The midpoint of the last 9 periods. It is the fastest moving line and provides early indications of momentum shifts.
  • Kijun-sen (Base Line): The midpoint of the last 26 periods. It represents medium-term momentum and acts as a key level of dynamic support and resistance. It is often considered the most important single line in the Ichimoku system.
  • Chikou Span (Lagging Span): The current closing price plotted 26 periods in the past. It helps visualize the relationship between the current price and recent price action, providing a powerful confirmation signal.
  • Senkou Span A (Leading Span A): The midpoint between the Tenkan-sen and Kijun-sen, plotted 26 periods in the future. It forms one of the boundaries of the Kumo.
  • Senkou Span B (Leading Span B): The midpoint of the last 52 periods, plotted 26 periods in the future. It forms the second boundary of the Kumo and represents the long-term trend.
  • Kumo (The Cloud): The area between Senkou Span A and Senkou Span B. The Kumo is the heart of the system, representing a dynamic "river" of support and resistance. The color and thickness of the cloud can also indicate the strength of the trend.

3. How to Interpret the Signals

The Ichimoku system provides a layered approach to analysis. A trader typically looks for multiple signals to align before considering a trade.

a) Kumo (The Cloud)

The position of the price relative to the Kumo is the primary indication of the overall trend.

  • Bullish Trend: Price is consistently trading above the Kumo. The Kumo itself acts as a support zone.
  • Bearish Trend: Price is consistently trading below the Kumo. The Kumo itself acts as a resistance zone.
  • Consolidation / Ranging Market: Price is trading inside the Kumo. Trading within the cloud is generally considered high-risk as the trend is undefined.

b) Kijun-sen (Base Line)

The Kijun-sen acts as a reliable indicator of market momentum.

  • Bullish Momentum: Price is trading above the Kijun-sen.
  • Bearish Momentum: Price is trading below the Kijun-sen.
  • A Kijun Cross, where the price crosses the Kijun-sen, can be a significant signal of a change in momentum.

c) TK Cross (Tenkan-sen / Kijun-sen Cross)

This is one of the most common signals used for trade entry.

  • Bullish TK Cross: The Tenkan-sen (faster line) crosses above the Kijun-sen (slower line). The strength of this signal is considered higher if it occurs above the Kumo.
  • Bearish TK Cross: The Tenkan-sen crosses below the Kijun-sen. The strength of this signal is considered higher if it occurs below the Kumo.

d) Chikou Span (Lagging Span)

The Chikou Span provides final confirmation for a signal.

  • Bullish Confirmation: The Chikou Span is above the price line from 26 periods ago (i.e., it is in "open space"). This confirms that there is little resistance to an upward move.
  • Bearish Confirmation: The Chikou Span is below the price line from 26 periods ago. This confirms that there is little support to prevent a downward move.

A high-probability setup often involves the confluence of all these signals (e.g., a Bullish TK Cross that happens above the Kumo while the Chikou Span is also in open space).

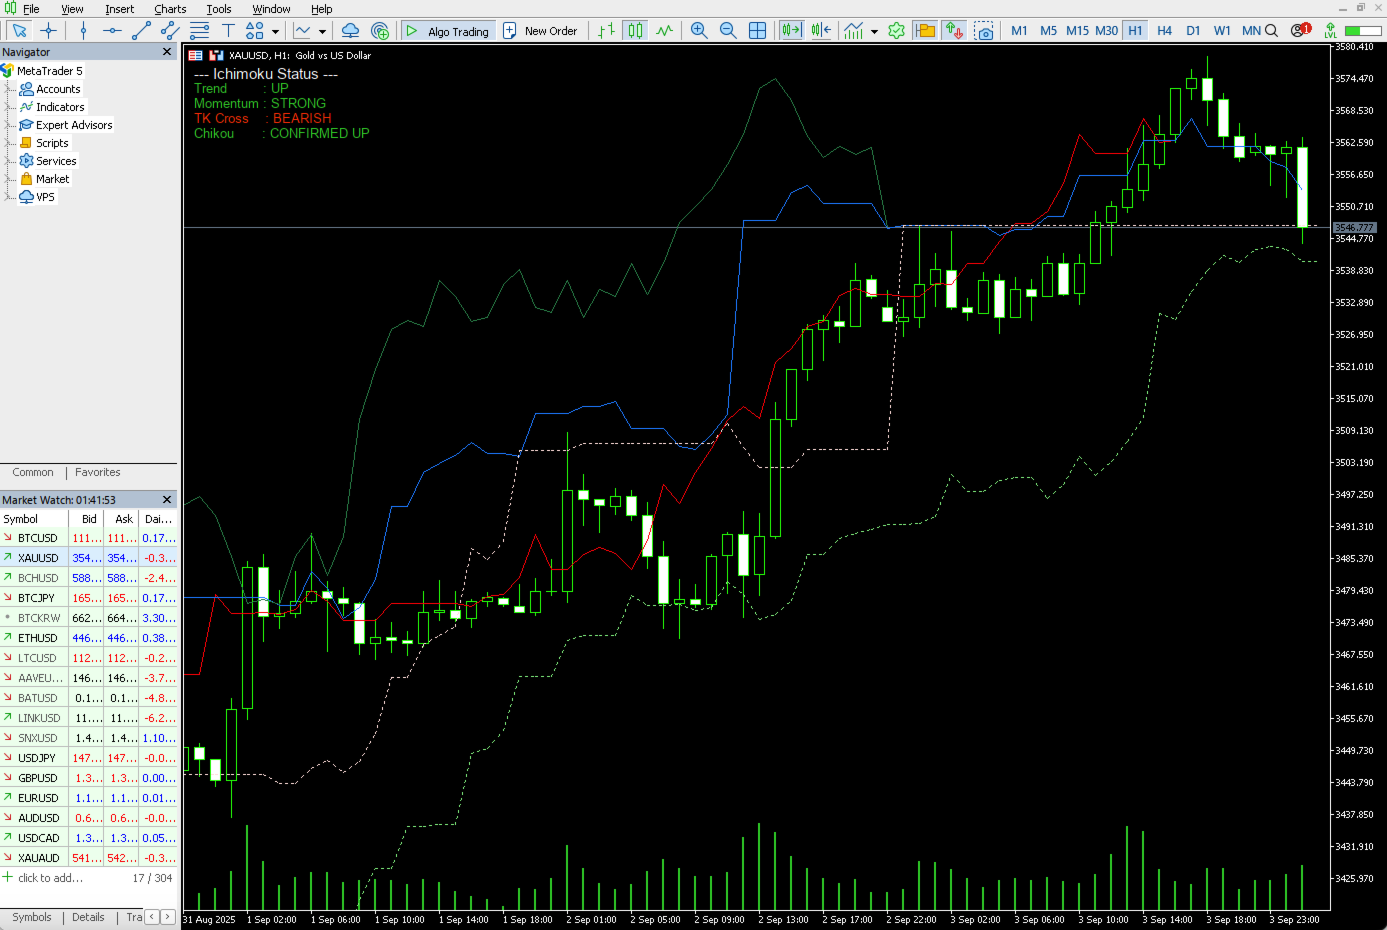
4. Feature: The Status Dashboard

To simplify analysis, this indicator includes a dashboard that summarizes the state of all the signals on the last closed candle.

  • Trend: Shows if the price is UP (above Kumo), DOWN (below Kumo), or NEUTRAL (inside Kumo).
  • Momentum: Shows if the price is STRONG (above Kijun) or WEAK (below Kijun).
  • TK Cross: Shows the direction of the most recent BULLISH or BEARISH cross.
  • Chikou: Shows if the Chikou Span CONFIRMED UP or CONFIRMED DOWN .
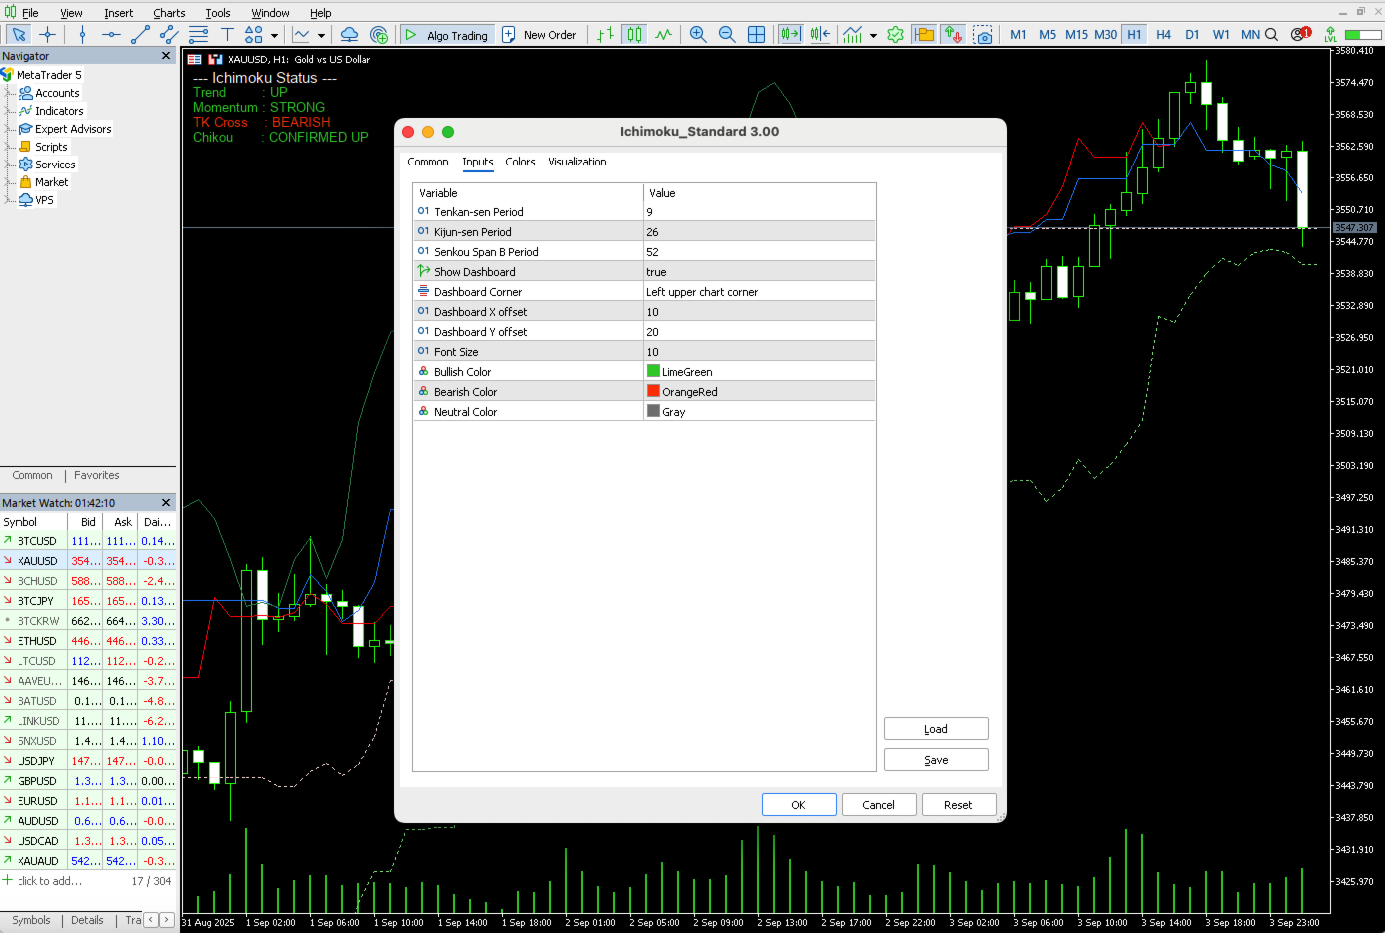
5. Input Parameters

The indicator's settings can be adjusted via the "Inputs" tab.

a) Ichimoku Periods

  • InpTenkanPeriods: The lookback period for the Tenkan-sen. Default is 9.
  • InpKijunPeriods: The lookback period for the Kijun-sen and the shift period for the Kumo/Chikou. Default is 26.
  • InpSenkouPeriods: The lookback period for the Senkou Span B. Default is 52.

b) Dashboard Settings

  • InpDashboardOn: true / false . Toggles the visibility of the dashboard.
  • InpDashboardCorner: Sets the corner of the chart where the dashboard will appear (e.g., CORNER_LEFT_UPPER ).
  • InpDashboardX: The horizontal distance (in pixels) from the corner's edge.
  • InpDashboardY: The vertical distance (in pixels) from the corner's edge.
  • InpDashboardFontSize: The font size for the dashboard text.
  • InpDashboardColorBull: The color used for bullish status text.
  • InpDashboardColorBear: The color used for bearish status text.
  • InpDashboardColorNeutral: The color used for neutral or undefined status text.
Önerilen ürünler
FractalEfficiencyIndicator   A ratio between 0 and 1 with the higher values representing a more efficient or trending market,  It is used in the calculation of Perry J. Kaufman Adaptive Moving Average (KAMA), dividing the price change over a period by the absolute sum of the price movements that occurred to achieve that change. The Fractal Efficiency or also known as Efficiency Ratio was first published by Perry J. Kaufman in his book   ‘Smarter Trading‘. This is mostly considered a filter for v
FREE
TANIN ICHIMOKU CLOUD (EA20): The Ultimate Trend Rider & Prop Firm Shield Trading the Ichimoku Kinko Hyo system manually can be complex and emotionally draining. Are you tired of getting shaken out of massive trends by market noise? Meet EA20 Tanin Ichimoku Cloud , a fully automated trend-following system. It takes the guesswork out of Ichimoku by executing sniper entries and riding the mega trends with zero emotions.   ENTER YOUR KEY HERE:   [  EA20_99999D_TANINCODER_598259741005 ] --
FREE
A professional tool for trading - the divergence indicator between the RSI and the price, which allows you to receive a signal about a trend reversal in a timely manner or catch price pullback movements (depending on the settings). The indicator settings allow you to adjust the strength of the divergence due to the angle of the RSI peaks and the percentage change in price, which makes it possible to fine-tune the signal strength. The indicator code is optimized and is tested very quickly as par
FREE
AdaptiveCCiMt5
Francis Dube
4 (2)
The Commodity Channel Index computes the deviation of the typical price of each bar from the average price over a particular time period. Multiplying the median deviation by 0.015 facilitates normalization, which makes all deviations below the first standard deviation less than  -100, and all deviations above the first standard deviation more than 100. This adaptive version is based on the indicator described by John Ehlers, in the book Rocket Science for traders. The indicator uses the homodyne
FREE
Multi-timeframe trend indicator based on the ADX / ADXWilder indicator with Fibonacci levels The indicator shows trend areas using ADX or ADXWilder indicator data from multiple timeframes. The impulse mode of the indicator allows you to catch the beginning of a trend, and several "Screens" with different timeframes allow you to filter out market noise. Fibonacci levels are added to the price chart, which have flexible settings. How the indicator works: if PDI is greater than NDI, then   it`s
FREE
Follow The Line MT5
Oliver Gideon Amofa Appiah
4.6 (35)
This indicator obeys the popular maxim that: "THE TREND IS YOUR FRIEND" It paints a GREEN line for BUY and also paints a RED line for SELL. (you can change the colors). It gives alarms and alerts of all kinds. IT DOES NOT REPAINT and can be used for all currency pairs and timeframes. Yes, as easy and simple as that. Even a newbie can use it to make great and reliable trades. NB: For best results, get my other premium indicators for more powerful and reliable signals. Get them here: https://www.m
FREE
Kijun sen
Khaled Nouioui
5 (1)
The Kijun-sen , also known as the Base Line , is arguably the most critical component of the Ichimoku Kinko Hyo system. While many traders focus on the "Cloud," professional traders know that the Kijun-sen is the true heartbeat of market momentum and trend direction. This indicator calculates the midpoint of the highest high and the lowest low over the last 26 periods , providing a stable, medium-term view of the market’s equilibrium.
FREE
Gaussian Envelope   is an innovative technical indicator that uses Gaussian-weighted moving average to create dynamic price channels. Unlike traditional volatility indicators (Bollinger Bands, Keltner Channels), Gaussian Envelope provides smoother and more accurate price tracking through the use of the bell-shaped Gaussian function. The indicator is particularly effective in trending markets and for identifying reversal points, providing traders with clear entry and exit signals. Key Features
FREE
1. Indicator Overview 1.1 General Description Dynamic Support & Resistance (DSR) is a technical indicator that identifies dynamic support and resistance zones — price levels that continuously adapt to market movement, unlike fixed horizontal support/resistance lines. DSR precisely identifies the upper boundary (DSRt) and lower boundary (DSRb) of price oscillation within a defined lookback period — these are the levels where price tends to pause, reverse, or break out to form a new trend. 1.2 Id
FREE
Multi-timeframe trend indicator, based on the ADX / ADXWilder indicator The indicator shows trend areas using ADX or ADXWilder indicator data from multiple timeframes. The impulse mode of the indicator allows you to catch the beginning of a trend, and several "Screens" with different timeframes allow you to filter out market noise. How the indicator works: if PDI is greater than NDI, then it`s bullish movement; if PDI is less than NDI, then it`s bearish movement; to determine any trend, it is
FREE
Kaufmans AMA Candle
Syamsurizal Dimjati
5 (1)
RITZ Candle Kaufman’s AMA is a precision market-flow indicator built around Kaufman’s Adaptive Moving Average (KAMA / AMA) — a dynamic smoothing algorithm that automatically adjusts to changing volatility. This enhanced version interprets AMA momentum directly into smart candle-color signals , giving traders a clean, noise-filtered view of trend strength and directional bias. Where most indicators repaint or react too slowly, RITZ Candle AMA delivers stable, non-repainting color shifts based on
FREE
Tunnel Warrens MT5
Dariel Iserne Carrera
This is MT5 version Get Tunnel Warrens MT4 here Here are several indicators that work together. It basically works with moving averages and various levels of ATR creating a dynamic channel through which the price is drained. As I always recommend, you should try it before using it in live so that you understand how it works. The market entry signal is similar to other MA indicators, but with this one you also have a graphical analysis of the moment when the trend is found and dynamic levels to
FREE
Phoenix Momentum 5 Star
Nigel Nii Darku Narnor Darko
This indicator, "Phoenix Volume Amazing", is a sophisticated Volume Delta and Order Flow Dashboard. Unlike standard volume indicators that only show total activity, this tool dissects the internal "tug-of-war" between buyers and sellers in real-time. Core Functionality The indicator calculates Delta (the difference between buying volume and selling volume) to provide a "under the hood" look at market sentiment. It uses a custom-built GUI (Graphical User Interface) panel to display these metrics
FREE
Trend indicator based on the ADX / ADXWilder indicator The indicator shows trend areas using ADX or ADXWilder indicator data. How the indicator works: if PDI is greater than NDI, then it`s bullish movement; if PDI is less than NDI, then it`s bearish movement; if ADX is less than or equal to the filter value specified in the parameters, then there is no movement state. Input parameters of the indicator: Calculate Timeframe - timeframe for calculation; ADX Type - type of ADX calculation based
FREE
Stamina HUD
Michele Todesco
STAMINA HUD – Advanced Market & Trend Dashboard (MT5) STAMINA HUD   is a professional   market information panel   designed for traders who want   clarity, speed, and control   directly on the chart. It provides a   clean heads-up display (HUD)   with essential market data and   multi-timeframe trend direction , without cluttering the chart or generating trading signals. What STAMINA HUD Shows   Current Price   Spread (in real pips)   Today High–Low range (pips)   Average D
FREE
The Keltner Channel is a volatility-based technical indicator composed of three separate lines. The middle line is an exponential moving average (EMA) of the price. Additional lines are placed above and below the EMA. The upper band is typically set two times the Average True Range (ATR) above the EMA, and the lower band is typically set two times the ATR below the EMA. The bands expand and contract as volatility (measured by ATR) expands and contracts. Since most price action will be encompasse
FREE
Cross MA histogram
Mariusz Piotr Rodacki
The Cossover MA Histogram indicator is a simple tool showing the trend based on crossover of moving averages. Simply specify two mobving averages and addicional parameters like MA method and Applied price. When fast MA is above slow MA the histogram is green, indicating an uptrend. When MA fast is below MA slow the histogram is red, indicating an downtrend.
FREE
LT Force
Thiago Duarte
5 (5)
For those who like trend the Force will be a very useful indicator. This is because it is based on the famouse ADX, which measure the strenght of a trend, but without its 3 confusing lines. Force has its very simple interpretation: if the histogram is above zero level the trend is up, otherwise it is down. You can use it to find divergences too, which is very profitable. Thanks to Andre Sens for the version 1.1 idea. If you have any doubt or suggestion, please, contact me. Enjoy! MT4 version: 
FREE
GDS Renko Ghost Free Renko Market Memory Visualization Indicator for MetaTrader 5 GDS Renko Ghost is a free MetaTrader 5 indicator for traders who use Renko charts and want to study how similar Renko structures behaved in the past. The indicator visualizes historical Renko memory: similar past structures, continuation paths, consensus behavior and uncertainty zones. It does not give buy or sell signals. It does not predict price movement. It is a visual research and context tool for manual Renko
FREE
Bollinger Bands Technical Indicator (BB) is similar to envelopes. The only difference is that the bands of Envelopes are plotted a fixed distance (%) away from the moving average, while the Bollinger Bands are plotted a certain number of standard deviations away from it. Standard deviation is a measure of volatility, therefore Bollinger Bands adjust themselves to the market conditions. When the markets become more volatile, the bands widen and they contract during less volatile periods. This ada
FREE
MWC COX 5
Joerg Hamann
3 (1)
The MWC COX indicator shows the extreme zones of net short/long positions of the Commitments of Traders Report released by the CFTC once a week for four periods of time. Default settings are periods of 12, 26, 52 and 156 weeks. Additional Features Displays the sum of all 4 periods in one line MA, MOM and RSI indicators are integrated ( not in the MQL5 Version 1.0 ) Please make sure that you download the MWC_Demo.zip file and unpack it into   [...]/MQL5/Files   folder.  ->  www.myweeklycot.com/t
FREE
Index Trend Monitor is a MetaTrader 5 indicator designed to measure directional strength on index CFD symbols and other active markets. Core idea: the indicator combines EMA structure, ATR-normalized movement, impulse and persistence logic to build a clean trend score, while also exposing a hidden regime buffer for Expert Advisors and custom tools. Quick Summary Product type MetaTrader 5 indicator Main focus Directional strength, trend score and regime classification Visual output Bullish and b
FREE
TrailingStop MA
Andrej Nikitin
3.5 (2)
The indicator draws two simple moving averages using High and Low prices. The MA_High line is displayed when the moving average is directed downwards. It can be used for setting a stop order for a sell position. The MA_Low line is displayed when the moving average is directed upwards. It can be used for setting a stop order for a buy position. The indicator is used in the TrailingStop Expert Advisor. Parameters Period - period of calculation of the moving average. Deviation - rate of convergence
FREE
Ema cloud smooth
Hermes Sebastian Cifuentes Bohorquez
5 (3)
This indicator has been developed as an analytical tool based on exponential moving averages (EMA) . Its purpose is to provide additional insights into market dynamics using two exponential moving averages (EMA) and one smoothed exponential moving average (SMMA) . The indicator can be applied to different financial instruments and timeframes, depending on user preferences. Some traders use it on 30-second charts , complementing it with a 2-minute chart . How the Indicator Works The analysis is b
FREE
The indicator detects and displays М. Gartley's Butterfly pattern. The pattern is plotted by the extreme values of the ZigZag indicator (included in the resources, no need to install). After detecting the pattern, the indicator notifies of that by the pop-up window, a mobile notification and an email. The pattern and wave parameters are displayed on the screenshots. The default parameters are used for demonstration purposes only in order to increase the amount of detected patterns. Parameters z
The CV MACD Indicator is a modern and professional momentum indicator designed to analyze trend strength, market direction and potential reversals. By combining the MACD line, signal line and histogram, the indicator helps traders identify market momentum and high-quality trading opportunities with clarity and precision. Features: Precise MACD momentum analysis Early trend reversal detection Clear histogram for market strength visualization Adjustable Fast, Slow and Signal periods Visual Buy & S
FREE
++++++++++++++++++++++++++++++++++ +++ Trend Tool ++++++++++++++++++++++++++++++++++ Hallo Trader, This is a trend tool that I use... based on four moving averages. Price below or above the EMA200 is indication for the long term trend. Also the direction of the slope counts. You can customise in settings if you want. The tool is aligned with my Forecast System and the Bounce Zones. - Forecast System --> https://www.mql5.com/en/market/product/156904 - Bounce Zones -->  https://www.mql5.com/en/mar
FREE
ATR Moving Average
David Gitau Gakunga
4 (2)
ATR Moving Average draws a moving average of the standard Average True Range( ATR ) in the same window. Settings Name Description ATR period Set Price per iod for ATR calculation ATR level Set ATR value for thresholding( only whole number, ignore leading zeros e.g. 0.00089 = 89 ) MA Period Set moving Average Period MA Method Set moving average method( Simple, Exponential, Smoothed and Linear Weighted ) MA Shift Set moving average shift Enable Alerts ? Generate Alert when ATR crosses Moving
FREE
VR Donchian MT5
Vladimir Pastushak
4.82 (17)
VR Donchian göstergesi, Donchian kanalının geliştirilmiş bir versiyonudur. İyileştirmeler kanalın neredeyse tüm işlevlerini etkiledi ancak ana işletim algoritması ve kanal yapısı korundu. Mevcut trende bağlı olarak top göstergesine seviyelerin renginde bir değişiklik eklendi - bu, yatırımcıya trendde veya yatayda bir değişiklik olduğunu açıkça gösterir. Yatırımcıyı akıllı telefon, e-posta veya MetaTrader terminalinde iki kanal seviyesinden birinin kırılması hakkında bilgilendirme yeteneği eklend
FREE
Технический индикатор Trend Moving Average позволяет определить глобальное направление рынка. Данный технический индикатор создан для того, чтобы определить «линию наименьшего сопротивления» рынка и понять в какую сторону направлен тренд. Помимо классического использования МА, индикатор позволяет понять направленность рынка на основе динамики его значений. Так, если значение индикатора демонстрируют переход с нисходящего значения в восходящее (и наоборот) - это является дополнительным торговым с
FREE
Bu ürünün alıcıları ayrıca şunları da satın alıyor
Neuro Poseidon MT5
Daria Rezueva
4.8 (54)
Neuro Poseidon is a new indicator by Daria Rezueva. It combines precise trading signals with adaptive TP/SL levels - creating best possible trades as a result! Message me and get  Neuro Poseidon Assistant  as a gift to automize your trading process! What makes it stand out? 1. Proven profitability on all assets and timeframes 2. Only confirmed BUY and SELL signals present on the chart 3. Adaptive TP & SL levels generated by the software for each trade 4. Easy to understand - suitable for al
SuperScalp Pro
Van Minh Nguyen
4.68 (28)
SuperScalp Pro –  Profesyonel Çok Katmanlı Uyumluluklu Scalping Sistemi SuperScalp Pro, yüksek olasılıklı işlem fırsatlarını akıllı çok faktörlü onay mekanizmasıyla tespit etmek için tasarlanmış profesyonel çok katmanlı bir confluence işlem sistemidir. Supertrend, VWAP, EMA, RSI, ADX, hacim analizi, Bollinger Bantları ve MACD Diverjansını entegre ederek düşük kaliteli kurulumları filtreler, sahte kırılma sinyallerini azaltır ve giriş hassasiyetini artırır. Özellikle XAUUSD, BTCUSD ve başlıca For
M1 Quantum MT5
Hamed Dehgani
5 (5)
M1 Quantum ile Canlı İşlem Sinyalleri : Sinyal Fiyat Planı: Güncel Fiyat: $149 (Erken kullanıcı teklifi) Bir sonraki planlanan fiyat: $169 Planlanan perakende fiyatı: $299 Geliştirici Notu: Satın alma işleminden sonra benimle iletişime geçerek en güncel önerilen ayar dosyasını (Set File) , kullanım tavsiyelerini ve diğer M1 Quantum kullanıcılarıyla iletişim kurabileceğiniz VIP destek grubuna davetiye alabilirsiniz. M1 Quantum , hızlı ve doğru alım-satım sinyalleri sunan, yerleşik Stop Loss, Tak
Önce dürüst olalım. Hiçbir gösterge tek başına sizi kârlı yapmaz. Eğer biri size aksini söylüyorsa, size bir hayal satıyordur. Mükemmel al/sat okları gösteren her gösterge, kusursuzmuş gibi görünecek şekilde yapılabilir — sadece geçmişin doğru bir bölümünü yakınlaştırıp kazanan işlemleri ekran görüntüsü almanız yeterlidir. Biz bunu yapmıyoruz.  SMC Intraday Formula bir araçtır. Piyasa yapısını sizin için okur, en yüksek olasılıklı fiyat bölgelerini belirler ve şu anda akıllı paranın izinin nası
Gold Entry Sniper
Tahir Mehmood
5 (14)
Gold Entry Sniper – Altın Scalping & Swing Trading için Profesyonel Çoklu Zaman Çerçeveli ATR Paneli Gold Entry Sniper , XAUUSD ve diğer enstrümanlar için doğru al/sat sinyalleri veren, ATR Trailing Stop mantığı ve çoklu zaman çerçevesi analizi ile geliştirilmiş gelişmiş bir MetaTrader 5 göstergesidir. Temel Özellikler ve Avantajlar Çoklu Zaman Çerçevesi Analizi – M1, M5, M15 trendlerini tek panelde gösterir. ATR Tabanlı Trailing Stop – Volatiliteye göre dinamik olarak ayarlanır. Profesyonel Gra
Entry In The Zone and SMC Multi Timeframe is a real-time 2-in-1 market analysis tool that combines market structure analysis and a No Repaint BUY / SELL signal system into a single indicator, built on Smart Money Concepts (SMC) — a widely adopted framework used by professional traders to understand market structure. This indicator helps you see the market more clearly, make decisions based on structure rather than guesswork, and focus on high-probability zones where price is more likely to react
Bu ürün 2026 piyasası için güncellendi ve en son MT5 sürümleri için optimize edildi. FİYAT GÜNCELLEME BİLDİRİMİ: Smart Trend Trading System şu anda $99 fiyatıyla sunulmaktadır. Sonraki 30 satın alma işleminden sonra fiyat $199 olacaktır. ÖZEL TEKLİF: Smart Trend Trading System satın aldıktan sonra bana özel mesaj gönderin, Smart Universal EA’yı ÜCRETSİZ olarak alın ve Smart Trend sinyallerinizi otomatik işlemlere dönüştürün. Smart Trend Trading System, daha temiz sinyaller, daha iyi trend yönü
Divergence Bomber
Ihor Otkydach
4.9 (92)
Bu göstergeyi satın alan herkese aşağıdaki ekstra içerikler ücretsiz olarak sunulmaktadır: Her işlemi otomatik olarak yöneten, Stop Loss ve Take Profit seviyelerini ayarlayan ve işlemleri strateji kurallarına göre kapatan özel yardımcı araç: "Bomber Utility" Göstergenin farklı varlıklar üzerinde kullanılmasına yönelik ayar dosyaları (set dosyaları) Bomber Utility için 3 farklı modda kullanım sunan ayar dosyaları: "Minimum Risk", "Dengeli Risk" ve "Bekle-Gör Stratejisi" Bu ticaret stratejisini hı
Trend Sniper X
Sarvarbek Abduvoxobov
5 (2)
Trend Sniper X , traderların trend yönünü ve potansiyel dönüş noktalarını netlik ve hassasiyetle belirlemelerine yardımcı olan, MetaTrader 5 için çoklu zaman dilimli bir trend takip göstergesidir. Fiyat Bilgisi: Mevcut fiyat promosyon amaçlıdır ve gelecekteki güncellemeler ve yeni özellikler yayınlandıkça değişebilir. Code2Profit Kanalı   Çoklu Zaman Dilimi Analizi ile Piyasada Ustalaşın!   Trend Sniper X : Sistematik Piyasa Analizi ve Güncellemeler   Teknik Özellikler Platform MetaTrader 5 Göst
Gann Made Easy , bay teorisini kullanarak ticaretin en iyi ilkelerine dayanan, profesyonel ve kullanımı kolay bir Forex ticaret sistemidir. WD Gann. Gösterge, Zararı Durdur ve Kâr Al Seviyeleri dahil olmak üzere doğru SATIN AL ve SAT sinyalleri sağlar. PUSH bildirimlerini kullanarak hareket halindeyken bile işlem yapabilirsiniz. Satın alma işleminden sonra, alım satım talimatlarını ve harika ek göstergeleri ücretsiz olarak almak için lütfen benimle iletişime geçin! Muhtemelen Gann ticaret yöntem
Power Candles V3 - Kendi Kendini Optimize Eden Güç Göstergesi Power Candles V3, döviz ve enstrüman gücünü, eklendiği her grafikte eyleme geçirilebilir bir ticaret planına dönüştürür. Sadece mumları renklendirmek yerine, arka planda canlı bir otomatik optimizasyon çalıştırır ve önünüzdeki sembol için en iyi Stop Loss, Take Profit ve sinyal eşiğini size sunar. Tek bir tıklama ile canlı ticarete uyarlanır - giriş, Stop Loss ve Take Profit ışınları grafikte tam fiyatlarla görünür ve uyarılar yön bil
Trend Catcher ind mt5
Ramil Minniakhmetov
5 (8)
TREND YAKALAYICI GÖSTERGE Trend Yakalayıcı Gösterge, yazarın tescilli ve özelleştirilmiş uyarlanabilir trend analiz göstergelerinin bir kombinasyonunu kullanarak piyasa fiyat hareketlerini analiz eder. Kısa vadeli gürültüyü filtreleyerek ve temel momentum gücüne, volatilite genişlemesine ve fiyat yapısı davranışına odaklanarak gerçek piyasa yönünü belirler. Ayrıca, hareketli ortalamalar, RSI ve volatilite filtreleri gibi yumuşatma ve trend filtreleme özelleştirilmiş göstergelerinin bir kombina
UZFX {SSS} Scalping Smart Signals v4.0 MT5, hızlı hareket eden piyasalarda doğru ve gerçek zamanlı sinyaller bekleyen scalperlar, günlük işlemciler ve swing işlemciler için tasarlanmış, yeniden çizilmeyen yüksek performanslı bir işlem göstergesidir. (UZFX-LABS) tarafından geliştirilen bu gösterge, fiyat hareketi analizi, trend teyidi ve akıllı filtrelemeyi bir araya getirerek tüm döviz çiftleri ve zaman dilimlerinde yüksek olasılıklı alım ve satım sinyalleri, Uyarı Sinyalleri ve Trend Devam Fırs
Göstergemiz, piyasada ilgi gösterilen bölgeleri vurgular ve ardından emir birikim bölgelerini gösterir. Büyük ölçekli bir emir defteri (order book) gibi çalışır. Bu, büyük sermaye için geliştirilmiş bir göstergedir. Performansı olağanüstüdür. Piyasada ne tür bir ilgi olursa olsun, onu görürsünüz . (Bu, tamamen yeniden yazılmış ve otomatikleştirilmiş bir versiyondur – artık manuel analiz gerekmez.) İşlem Hızı (Transaction Speed) , piyasada büyük emirlerin nerede ve ne zaman biriktiğini gösteren v
Gem SIGNAL
Shengzu Zhong
5 (1)
GEM Signal Pro GEM Signal Pro, MetaTrader 5 için geliştirilmiş bir trend takip göstergesidir ve daha net sinyaller, daha düzenli işlem kurulumları ve daha pratik risk yönetimini doğrudan grafik üzerinde görmek isteyen yatırımcılar için tasarlanmıştır. Sadece basit bir ok göstermek yerine, GEM Signal Pro işlem fikrinin tamamını daha temiz ve daha okunabilir bir şekilde sunmaya yardımcı olur. Koşullar onaylandığında, gösterge giriş fiyatını, stop loss seviyesini ve take profit hedeflerini grafik ü
Axiom Matrix
Issam Kassas
5 (1)
AXIOM MATRIX MT5 LANSman FİYATI: $99 Axiom Matrix, $99 lansman fiyatıyla sunulmaktadır. İlk 30 satın alma tamamlandıktan sonra fiyat $199 olacaktır. Axiom Matrix, MetaTrader 5 için profesyonel bir çoklu sembol, çoklu zaman dilimi piyasa tarayıcısı ve karar panelidir. Market Watch listenizi tarar, birden fazla zaman dilimini analiz eder, birden fazla kanıt motorunu okur, en güçlü fırsatları karşılaştırır ve size en iyi BUY, SELL, WAIT veya engellenmiş durumu tek bir temiz matris paneli içinde gös
Atomic Analyst MT5
Issam Kassas
4.26 (39)
Bu ürün 2026 piyasası için güncellendi ve en son MT5 sürümleri için optimize edildi. FİYAT GÜNCELLEME BİLDİRİMİ: Atomic Analyst şu anda $99 fiyatıyla sunulmaktadır. Sonraki 30 satın alma işleminden sonra fiyat $199 olacaktır. ÖZEL TEKLİF: Atomic Analyst satın aldıktan sonra bana özel mesaj gönderin, Smart Universal EA’yı ÜCRETSİZ olarak alın ve Atomic Analyst sinyallerinizi otomatik işlemlere dönüştürün. Atomic Analyst, manuel trading, sinyal netliği ve EA otomasyonu için tasarlanmış, repaint
Tanıtım       Quantum Breakout PRO   , Breakout Bölgeleri ile ticaret yapma şeklinizi değiştiren çığır açan MQL5 Göstergesi! 13 yılı aşkın ticaret tecrübesine sahip deneyimli tüccarlardan oluşan bir ekip tarafından geliştirilmiştir.       Kuantum Breakout PRO       yenilikçi ve dinamik koparma bölgesi stratejisiyle ticaret yolculuğunuzu yeni zirvelere taşımak için tasarlanmıştır. Kuantum Breakout Göstergesi, size 5 kar hedefi bölgesi ile kırılma bölgelerinde sinyal okları ve kırılma kutusuna da
ARIPoint
Temirlan Kdyrkhan
1 (1)
ARIPoint is a powerful trading companion designed to generate high-probability entry signals with dynamic TP/SL/DP levels based on volatility. Built-in performance tracking shows win/loss stats, PP1/PP2 hits, and success rates all updated live. Key Features: Buy/Sell signals with adaptive volatility bands Real-time TP/SL/DP levels based on ATR Built-in MA Filter with optional ATR/StdDev volatility Performance stats panel (Success, Profit/Loss, PP1/PP2) Alerts via popup, sound, push, or email Cu
The Oracle Pro
Ottaviano De Cicco
The Oracle Pro: Synthetic Multi-Timeframe Bias Engine for MT5 ️ Summer Launch Offer — Get The Oracle Pro for USD 199 (early buyers). Price rises with traction; final price USD 399. The Oracle Pro is a premium multi-timeframe bias engine for MetaTrader 5, built for demanding and professional traders. It answers one question with discipline: what is the directional bias on each timeframe right now, how strong is it, and how much do the timeframes agree? Everything is computed on closed bars only
Quantum TrendPulse
Bogdan Ion Puscasu
5 (25)
SuperTrend   ,   RSI   ve   Stochastic'in   gücünü tek bir kapsamlı göstergede birleştirerek işlem potansiyelinizi en üst düzeye çıkaran nihai işlem aracı olan   Quantum TrendPulse'u   tanıtıyoruz. Hassasiyet ve verimlilik arayan yatırımcılar için tasarlanan bu gösterge, piyasa trendlerini, momentum değişimlerini ve en uygun giriş ve çıkış noktalarını güvenle belirlemenize yardımcı olur. Temel Özellikler: SuperTrend Entegrasyonu:   Güncel piyasa trendlerini kolayca takip edin ve karlılık dalgası
FX Trend MT5 NG
Daniel Stein
5 (6)
FX Trend NG: Yeni Nesil Çoklu Piyasa Trend Zekâsı Genel Bakış FX Trend NG , çoklu zaman dilimlerinde çalışan profesyonel bir trend analiz ve piyasa izleme aracıdır. Piyasanın yapısını saniyeler içinde anlamanızı sağlar. Birden fazla grafik arasında geçiş yapmak yerine, hangi enstrümanların trendde olduğunu, momentumun nerede zayıfladığını ve hangi zaman dilimlerinin uyumlu olduğunu anında görebilirsiniz. Lansman Teklifi – FX Trend NG sadece $30 (6 Ay) veya $80 Ömür Boyu Lisans ile edinin. Zate
FX Power MT5 NG
Daniel Stein
5 (33)
FX Power: Daha Akıllı Ticaret Kararları için Para Birimlerinin Gücünü Analiz Edin Genel Bakış FX Power , her piyasa koşulunda başlıca para birimlerinin ve altının gerçek gücünü anlamak için vazgeçilmez bir araçtır. Güçlü para birimlerini alıp zayıf olanları satarak, FX Power ticaret kararlarınızı basitleştirir ve yüksek olasılıklı fırsatları ortaya çıkarır. İster trendlere sadık kalın ister Delta'nın aşırı değerlerini kullanarak tersine dönüşleri öngörün, bu araç ticaret tarzınıza mükemmel bir
Current event:  https://c.mql5.com/1/326/A2SR2025_NoMusic.gif MT5 için A2SR Gösterge: Otomatik Gerçek Arz ve Talep (S/R). + İşlem Araçları. Product description in English here. --   Guidance   : -- at   https://www.mql5.com/en/blogs/post/734748/page4#comment_16532516 -- and  https://www.mql5.com/en/users/yohana/blog Daha Akıllı İşlem Kararları İçin Güçlü, Gerçek ve Zamandan Tasarruf Sağlayan + EA Uyumlu Nesneler. Temel Avantajlar Önde Gelen Gerçek SR Seviyeleri (Gecikmiyor, Yeniden Boyanmı
GoldenX Entry MT5
Kareem Abbas
5 (14)
GoldenX Entry, adaptif Smart Entry Trend algoritmasına, sinyal skorlaması sistemine, piyasa rejimi algılayıcısına ve volatilite filtresine sahip bir MT5 indikatörüdür. Her sinyal; hesaplanmış bir giriş seviyesi, üç adet Take-Profit seviyesi (TP1, TP2, TP3) ve bir Stop-Loss seviyesi içerir. Farklı piyasa koşullarına uyum sağlamak için tasarlanmış çok katmanlı analitik yapı üzerine kuruludur ve yerleşik optimizasyon aracı ile istatistik takip sistemini birleştirir. Risk-ödül (RR) metrikleri ve geç
Azimuth Pro
Ottaviano De Cicco
5 (7)
Azimuth Pro V2: Synthetic Fractal Structure and Confirmed Entries for MT5 Overview Azimuth Pro is a multi-level swing structure indicator by Merkava Labs . Four nested swing layers, swing-anchored VWAP, ABC pattern detection, three-timeframe structural filtering, and closed-bar confirmed entries — one chart, one workflow from micro-swings to macro-cycles. This is not a blind signal product. It is a structure-first workflow for traders who care about location, context, and timing. ️ Summer Sale
Btmm state engine pro
Garry James Goodchild
5 (5)
BTMM State Engine Pro is a MetaTrader 5 indicator for traders who use the Beat The Market Maker approach: Asian session context, kill zone timing, level progression, peak formation detection, and a multi-pair scanner from a single chart. It combines cycle state logic with a built-in scanner dashboard so you do not need the same tool on many charts at once. What it does Draws the Asian session range; session times can follow broker server offset or be set in inputs. Tracks level progression (L
Quant Direction MT5
Georgios Kalomoiropoulos
Quant Direction, 3 boyutlu bir piyasa analiz aracıdır. Çeşitli parametrelerdeki yüzdesel sapmaları hassas bir şekilde hesaplayan, tamamen objektif, algoritma tabanlı piyasa analizi sunar. Gelişmiş yapay zeka tabanlı modelleme araçları kullanılarak geliştirilen ve titizlikle test edilen bu algoritma, piyasayı benzersiz bir hassasiyetle analiz eder. Platformda herhangi bir döviz çiftini veya finansal enstrümanı analiz edebilirsiniz. İster kısa vadeli, ister günlük, isterse swing trading yapın, Qua
Bu ürün 2026 piyasası için güncellendi ve en son MT5 sürümleri için optimize edildi. FİYAT GÜNCELLEME BİLDİRİMİ: Smart Price Action Concepts şu anda $200 fiyatıyla sunulmaktadır. Sonraki 30 satın alma işleminden sonra fiyat $299 olacaktır. ÖZEL TEKLİF: Satın aldıktan sonra bana özel mesaj gönderin ve ÜCRETSİZ Bonus + Hediye alın. Öncelikle, bu trading aracının repaint yapmayan, geçmişi yeniden çizmeyen ve gecikmeyen bir indikatör olduğunu vurgulamak gerekir. Bu da onu profesyonel trading için
Reversion King Indicator
Eugen-alexandru Zibileanu
5 (5)
Şehre yeni bir Kral geldi - Gösterge + Emir Yönetimi göstergeleri (TP1 + TP2 + TP3) + Opsiyonel Telegram Sinyal Gönderici DAHİL (ÜCRETSİZ) (TAM TRADING ve SİNYAL SİSTEMİ) Altın için en iyi EA’mız: Gold Slayer Bu gösterge; gelişmiş bir strateji, özelleştirilebilir emir yönetimine sahip bir trading sistemi ve envelope uzantılarını birleştiren bir mean reversion sistemi içerir. Ayrıca RSI gibi birçok akıllı onay filtresiyle desteklenerek yüksek olasılıklı dönüş girişlerini AL ve SAT sinyalleriyle y
Yazarın diğer ürünleri
Trend Lines v2 MT5
Quang Huy Quach
5 (1)
Trend Lines v2 MT5 is an intelligent auto trendline indicator that instantly detects key dynamic support and resistance zones. Built on pivot high/low structure, it delivers a clear and accurate view of market trends across all timeframes. Features Fully automatic trendline drawing based on precise pivot points. Filters out noise – only clean and reliable trendlines are shown. Control the number of lines to keep your chart neat and easy to read. Flexible customization: colors, line thickness, ra
FREE
Breakout Finder MT5
Quang Huy Quach
5 (1)
The "Breakout Finder" is a technical indicator designed to automatically identify potential price breakouts and breakdowns on a chart. The highlight of this indicator is its robust signal filtering system, which helps traders avoid false signals (fakeouts) and focus on higher-probability trading opportunities. Key Features Automatic Pivot Point Detection: The indicator automatically identifies significant pivot highs and lows on the chart to establish potential support and resistance levels. Bre
FREE
Indicator Guide: Key Price Levels & Structure Shifts 1. Description The indicator is a technical analysis tool for the MetaTrader 5 platform. It is designed to automatically identify specific price movements and to highlight corresponding price zones based on preceding price action. This provides a visualization of key price areas according to the indicator's internal logic. 2. Visual Elements & Their Identification The indicator identifies and draws several types of visual elements on the chart
FREE
The Linear Regression Channel is a powerful technical analysis tool that helps visually identify the prevailing trend and potential price zones. Essentially, the indicator performs two main functions: It draws a trendline through the center of price action over a specified period. This line is calculated using the linear regression method, which results in the best possible "line of best fit" for the price data. From this center line, the indicator plots two parallel lines above and below, creat
FREE
The "Support Resistance Dynamic" indicator is a powerful technical analysis tool for the MetaTrader 5 platform, designed to automatically identify and plot dynamic Support and Resistance zones on price charts. This indicator helps traders easily recognize important price levels, potential reversal points, or breakout areas, thereby enabling more informed trading decisions. 2. Key Features Dynamic S/R Identification : Automatically identifies support and resistance zones based on an advanced Pivo
FREE
SuperTrend Signals
Quang Huy Quach
5 (1)
The Supertrend indicator is a trend-following technical analysis tool designed to help traders identify the direction of market trends and potential entry/exit points. It operates based on price data and Average True Range (ATR) to create a dynamic signal line that changes color depending on the current trend. Green color: Indicates an uptrend. Red color: Indicates a downtrend. Supertrend is a useful indicator for both short-term and long-term trading, helping to filter out market noise and focu
FREE
Welcome to Ultimate MA MTF , a multi-functional Moving Average (MA) indicator converted from the original TradingView version by ChrisMoody and upgraded with many powerful features. This is not just a typical MA line. It is a comprehensive technical analysis tool designed to provide traders with deep insights into trends, volatility, and potential trading signals, all within a single indicator. Key Features 8 Moving Average Types: Full support for the most popular MA types (SMA, EMA, WMA, HullMA
FREE
The Pivot Point Supertrend indicator is a technical analysis tool designed for the MetaTrader 5 (MT5) platform. It combines two popular analytical methods: Pivot Points: Uses significant historical price highs and lows to identify potential support and resistance zones. These points are objective and stable. Supertrend: A well-known trend-following indicator that helps identify the current market trend and provides dynamic stop-loss levels. Indicator's Goal: By using the stability of Pivot Point
FREE
MTF Candles Drawing
Quang Huy Quach
5 (1)
The MTF (Multi-Timeframe) Candles indicator is a powerful tool that allows you to display candles from a higher timeframe (e.g., H1, H4, D1) directly on a lower timeframe chart (e.g., M5, M15, M30). The Problem It Solves: Instead of constantly switching back and forth between charts to analyze the main trend and detailed price action, this indicator merges both perspectives into one. You can instantly see the "big picture" while staying focused on trading signals on your current timeframe. Core
FREE
1. Overview The Scalping PullBack Signal indicator is a powerful technical analysis tool designed to help traders identify scalping opportunities based on potential pullback and reversal signals. This tool is particularly useful on lower timeframes (below 15 minutes) but can also be applied on higher timeframes for longer-term trades. This indicator integrates several key analytical components, providing a comprehensive view of trends and potential entry/exit points, helping you make quick and e
FREE
The MultiFrameRSIIndicator is a powerful MetaTrader 5 (MT5) indicator that leverages the Relative Strength Index (RSI) to analyze trends across multiple timeframes. This indicator synchronizes RSI-based trend signals from up to nine timeframes (M1, M5, M15, M30, H1, H4, D1, W1, MN1) and presents them with clear visual feedback, including a colored RSI line, signal arrows, and a customizable dashboard. Ideal for traders seeking momentum-based trend confirmation. Features Multi-Timeframe Analysis
FREE
The MultiFrameTrendAnalyzer is a versatile MetaTrader 5 (MT5) indicator designed to provide multi-timeframe trend analysis using Moving Average (MA) crossovers. This indicator synchronizes trend signals across multiple timeframes (M1, M5, M15, M30, H1, H4, D1, W1, MN1) and displays them with intuitive visual cues, including a colored trend line, signal arrows, and a customizable dashboard. Features Multi-Timeframe Analysis : Evaluates trends across up to nine timeframes, allowing traders to conf
FREE
Multi-Period EMA is a convenient indicator that displays multiple Exponential Moving Averages (EMAs) on a single chart. It is designed to help traders easily identify market trends and key crossover points without the need to add multiple individual EMA indicators. Key Features: Multiple EMAs in one: Simplifies chart analysis by combining several EMA lines into one indicator. Fully customizable: Easily change the period (default 20, 50, 100, 200), color, and thickness of each EMA line. Clean in
FREE
The WaveTrend Oscillator indicator is an enhanced version of the classic WaveTrend Oscillator, a momentum indicator. It is designed to identify overbought/oversold conditions and provide potential trend reversal signals. The core difference in this version is the application of a data "normalization" algorithm. This ensures the indicator's oscillation lines remain balanced around the zero line, causing the indicator window to always stay naturally centered. This is especially useful when trading
FREE
TMA Overlay
Quang Huy Quach
TMA Overlay Indicator for MT5 - User Guide 1. Introduction TMA Overlay is a versatile technical analysis indicator for the MetaTrader 5 platform. The indicator's goal is to provide traders with a comprehensive overview of the trend, potential entry signals, and key trading sessions, all integrated into a single chart. This is not a trading system, but a comprehensive analysis tool designed to help you make more informed decisions. 2. Core Indicator Components The indicator consists of multiple c
FREE
The "Volume Range Profile with Fair Value" (VRPFV) indicator is a powerful volume analysis tool designed to help traders better understand market structure and identify key price areas where significant institutional activity occurs. Instead of just looking at volume on individual candlesticks, VRPFV analyzes the distribution of volume by price level within a specific time range, providing deep insights into the "footprint" of smart money. VRPFV consists of the following core components: Upper &
FREE
The Multi-Frame MACD Indicator is a robust MetaTrader 5 (MT5) indicator that utilizes the Moving Average Convergence Divergence (MACD) to analyze trends across multiple timeframes. This indicator synchronizes MACD-based trend signals from up to nine timeframes (M1, M5, M15, M30, H1, H4, D1, W1, MN1) and presents them with clear visual cues, including a colored MACD line, signal arrows, and a customizable dashboard. Perfect for traders seeking momentum and trend reversal insights. Features Multi-
FREE
The Vix_Fix indicator, or "Vix Fix," is a tool designed to identify potential market bottoms. It operates on the principle of measuring extreme fear or pessimism among the crowd, which are moments when the market often has a high probability of reversing to the upside. Main Purpose: To help traders find high-probability BUY (Long) entry points by identifying when the market is "oversold." How it Works In simple terms, the Vix Fix measures the distance between the current bar's Low and the Highes
FREE
1. Introduction Smart Volume S/R Pro is a powerful technical analysis tool designed for the MetaTrader 5 platform. Unlike traditional Support & Resistance (S/R) indicators that rely on price peaks and troughs, this indicator automatically identifies critical S/R zones based on a core factor: Trading Volume . Core Principle: Price levels that witnessed exceptionally high trading volume in the past will often become significant psychological zones, where the price is likely to react strongly (eith
FREE
1. Introduction The Market Squeeze Momentum Indicator (SQZMOM_LB) is a powerful technical analysis tool designed to help traders identify periods of low market volatility (the "squeeze" phase) and predict the direction and strength of price momentum after the squeeze ends. This indicator combines the principles of Bollinger Bands and Keltner Channels to detect changes in market volatility, along with a momentum oscillator to measure buying/selling pressure. 2. Key Components of the Indicator The
FREE
RSI Ultimate MTF
Quang Huy Quach
5 (1)
1. Introduction The CM_Ultimate_RSI_MTF is a powerful and versatile custom indicator for MetaTrader 5, designed to enhance your Relative Strength Index (RSI) analysis. It provides multi-timeframe (MTF) capabilities, visual signals, and customizable alerts, making it an invaluable tool for traders seeking to identify overbought/oversold conditions, trend strength, and potential entry/exit points across various timeframes. 2. Key Features Multi-Timeframe (MTF) Analysis: Allows you to view RSI from
FREE
Volume Flow Indicator (VFI) - User Manual 1. General Introduction The Volume Flow Indicator (VFI) is an advanced technical oscillator designed to measure the strength and sustainability of a price trend by incorporating both price and volume data. Developed based on the concepts of On-Balance Volume (OBV) but with significant improvements, the VFI provides deeper insight into money flow and the conviction behind price movements. This indicator is not an automated trading system but a powerful an
FREE
Fibonacci Bollinger Bands (FBB) Indicator - User Manual 1. Introduction Fibonacci Bollinger Bands (FBB) is a technical analysis indicator that combines three tools: Bollinger Bands , Fibonacci Ratios , and the Volume-Weighted Moving Average (VWMA) . The purpose of this indicator is to provide a multi-dimensional view of the market by helping to identify: Dynamic support and resistance zones. The general market trend. Volatility levels and potential accumulation phases (squeezes). Price breakouts
FREE
MultiFrame MA
Quang Huy Quach
5 (1)
MultiFrame MA: A Multi-Timeframe Trend Indicator MultiFrame MA is a trend analysis indicator designed to provide a comprehensive market overview across various timeframes. Instead of relying on a single timeframe, this tool synthesizes information from multiple charts, giving users a holistic and reliable perspective. KEY FEATURES: Multi-Timeframe Analysis: The indicator analyzes data from various timeframes, from M1 up to Monthly, to help users identify trend confluence at different levels. MA
FREE
1. Overview The ATR Dynamic Stop (CE) is a powerful technical indicator designed to help traders identify and follow market trends. Its core function is to provide a dynamic trailing stop-loss based on price volatility, as measured by the Average True Range (ATR) indicator. The main objectives of the ATR Dynamic Stop are: Profit Optimization: It helps you ride a strong trend by setting a reasonable stop-loss, preventing premature exits due to minor market noise and fluctuations. Risk Management:
FREE
MultiFrame Pivot MT5
Quang Huy Quach
5 (1)
MultiFrame Pivot: A Multi-Timeframe Analysis Tool MultiFrame Pivot is an analysis indicator designed to provide an overview of the market based on Pivot Points across multiple timeframes. The indicator synthesizes information from different timeframes to give you a more comprehensive view of important price levels. KEY FEATURES: Multi-Timeframe Analysis: MultiFrame Pivot allows you to simultaneously monitor the price's status relative to Pivot Points (PP), Support 1 (S1), and Resistance 1 (R1)
FREE
MultiFrame Volume Trend (MFVI) is a powerful VWAP-based indicator that displays volume trends across multiple timeframes in a clean, easy-to-read dashboard directly on your chart. Instantly capture the overall market direction in just seconds. Features Multi-timeframe VWAP analysis from M1 to MN1. Dashboard panel shows the trend state of each timeframe at a glance. Plots VWAP line and buy/sell arrows directly on the chart. Fully customizable: colors, line width, panel position, arrow symbols. Bu
FREE
This indicator is a trading strategy designed to find high-probability entry points by combining two very popular indicators: Bollinger Bands (BB) and the Relative Strength Index (RSI) . The core idea is "dual confirmation" : a trade signal is only considered valid when both indicators agree. This helps filter out many of the false signals that occur when using just a single indicator, thereby increasing the reliability of each entry. Bollinger Bands are used to identify relative price value zon
FREE
The Smart Trend Tracker (OTT) is a technical analysis tool designed to help traders identify the direction and strength of a market trend. This indicator functions as an optimized moving average that adapts to market volatility, thereby providing dynamic support and resistance levels. The primary goal of the OTT is to smooth out price action and offer visual cues about potential changes in the trend. Core Components of the Indicator When you add the indicator to your chart, you will see two main
FREE
The EMA Navigator Pro is an advanced version of the popular EMA indicator, designed to provide superior flexibility and multi-timeframe analysis capabilities. This indicator not only displays EMA lines but also offers a powerful alert system to ensure you never miss a crucial signal. Key Features: Multi-Timeframe Support: You can assign a separate timeframe to each individual EMA line, allowing you to analyze long-term (e.g., D1) and short-term (e.g., H1) trends on the same chart. Automatic Cro
FREE
Filtrele:
Değerlendirme yok
Değerlendirmeye yanıt