Smart Trend Tracker
- Indicators
- Quang Huy Quach
- Version: 1.5
The Smart Trend Tracker (OTT) is a technical analysis tool designed to help traders identify the direction and strength of a market trend. This indicator functions as an optimized moving average that adapts to market volatility, thereby providing dynamic support and resistance levels.
The primary goal of the OTT is to smooth out price action and offer visual cues about potential changes in the trend.
Core Components of the Indicator
When you add the indicator to your chart, you will see two main lines:
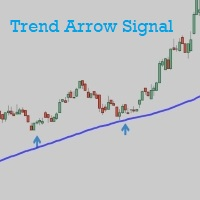
- The OTT Line (Purple): This is the core signal line. It moves below the price during an uptrend and above the price during a downtrend. This line acts as a dynamic trailing stop, helping to identify potential reversal points when the price crosses it.
- The Support Line (Blue): This is the baseline moving average, which is used as the foundation for calculating the OTT line.
How to Interpret and Use
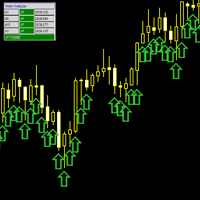
The indicator provides visual signals through green and red arrows that appear on the chart. Below is how to interpret these signal types.
Note: These signals should only be considered as analytical guidance and should be combined with other analysis methods to make trading decisions.
1. Support Line Crossing Signal
This is the default and most significant signal of the indicator.
- Buy Arrow (Green): Appears when the Support Line (blue) crosses above the OTT Line (purple). This suggests a potential shift from a downtrend to an uptrend.
- Sell Arrow (Red): Appears when the Support Line (blue) crosses below the OTT Line (purple). This suggests a potential shift from an uptrend to a downtrend.
2. Price Crossing Signal
This signal provides an earlier indication of a change in momentum.
- Buy Arrow (Green): Appears when the closing price crosses above the OTT Line.
- Sell Arrow (Red): Appears when the closing price crosses below the OTT Line.
3. OTT Color Change Signal
This signal is based on the momentum of the OTT line itself, indicating an acceleration of the trend.
- Buy Arrow (Green): Appears when the OTT line begins to slope upwards after a period of moving down or sideways.
- Sell Arrow (Red): Appears when the OTT line begins to slope downwards after a period of moving up or sideways.
Input Parameters
You can customize the indicator to fit your trading style and timeframe through the following parameters:
OTT Settings
- Source : The price type used for calculations (default: Close).
- OTT Period : The calculation period for the OTT line. A smaller value will make the indicator more sensitive to price, while a larger value will make it smoother.
- OTT Percent : The percentage used to calculate the distance between the MA line and the OTT line. A larger value creates a wider channel, suitable for more volatile markets.
- Moving Average Type : The type of moving average used as the baseline (default: EMA).
Display Settings
- Show Support Line? : Enables/Disables the visibility of the Support Line (blue).
- Show Support Line Crossing Signals? : Enables/Disables the arrows for the Support Line Crossing signals.
- Show Price/OTT Crossing Signals? : Enables/Disables the arrows for the Price Crossing signals.
- Show OTT Color Change Signals? : Enables/Disables the arrows for the OTT Color Change signals.
Alert Settings
- Enable Alerts? : Globally enables or disables all types of alerts.
- Alert on Support Line Crossing? : Enables/Disables alerts for the Support Line Crossing signals.
- Alert on Price Crossing? : Enables/Disables alerts for the Price Crossing signals.
- Alert on OTT Color Change? : Enables/Disables alerts for the OTT Color Change signals.
Disclaimer: Trading in financial markets carries a high level of risk. This indicator is an analysis tool only and does not provide any investment advice or guarantee of profit. The past performance of the indicator does not guarantee future results. Traders are solely responsible for their decisions. Always use appropriate risk management strategies.


