Trend Range Detector MT5 Scanner
- Indicators
-
Duc Hoan Nguyen
 ->| I am a dedicated developer and programmer specializing in MQL4, MQL5, and Pine Script for TradingView, with a strong track record of success in building high-performing, tailored solutions for MT4, MT5, and TradingView platforms. Over the years, I have worked extensively within the financial and
 - Version: 1.0
- Activations: 10
This tool will be FREE for 3 days, don't miss it!
New tools will be $30 for the first week or the first 3 purchases!
Trading Tools Channel on MQL5: Join my MQL5 channel to update the latest news from me
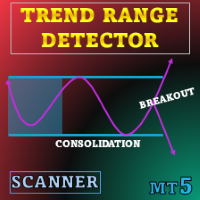
Trend Range Detector was created for users who prefer a structured, data-driven view of price consolidation. Instead of relying on subjective chart reading, it applies clear volatility rules to outline where prices have paused and where breakouts start.
See more MT4 version at: Trend Range Detector MT4 Scanner
See more products at: All Products
Overview
Trend Range Detector Scanner is a technical indicator that marks periods of price compression by drawing range boxes derived from volatility and recent price action. While closing prices remain inside a specified band, the tool plots a box; once price exits that band, the box updates to reflect the change.
Combining a volatility envelope with a weighted centerline, the indicator reduces minor fluctuations and outlines zones of relative stability. It can assist users who monitor accumulation, distribution, breakout assessment and mean-reversion setups.
The same framework suits range trading, analysis of consolidation phases, and observation of volatility contractions that often precede directional movement.
How It Works
Range Formation Engine
- Distance filter – the maximum distance between recent closes and a dynamic centerline must stay within a volatility envelope.
- Volatility envelope – calculated from ATR (default ATR 200) multiplied by a user-defined factor to reflect broader market conditions.
When both criteria hold for the most recent length of bars, a range box is plotted to anchor the zone.
Dynamic Breakout Coloring
If price moves beyond the top or bottom of the active box, the color changes in real time:
- Blue – price stayed inside the envelope for the required number of bars (low-volatility consolidation).
- Green – bullish breakout.
- Red – bearish breakdown.
This visual shift highlights transitions from consolidation to expansion without relying on lagging signals.
Why Use a Weighted Close Instead of Moving Average?
A moving average weights every close equally. Here, a speed-weighted average is applied:
- Bars with larger close-to-close movement carry greater weight.
- Sideways candles contribute less.
The result is a centreline that adapts to changing conditions and better represents market behaviour during volatile periods.
How to Use
- Range Detection: Boxes appear only when price stays close to the speed-weighted mean, outlining sideways phases and low-volatility structures.
- Breakout Confirmation: When price exits the upper or lower boundary, the box immediately highlights direction. Combine this information with personal momentum, volume or trend analysis for trade decisions.
Scanner and Alerts
- Users can turn on/off the scanner to monitor other charts quickly.
- The indicator has signal alerts when Breakout arrows appear, users can easily grasp market information with these alerts (especially when using Scanner)
Trend Range Detector Scanner offers a disciplined way to visualize consolidation and breakout behaviour without clutter. Its volatility-aware boxes, adaptive centreline and real-time colouring keep the chart readable while capturing key structure changes. Users can incorporate the indicator into their own workflows—whether for spotting potential breakout zones or confirming existing trade ideas—while adjusting a small set of parameters to suit different instruments and timeframes.