Swap Information Hunter Indicator
- インディケータ
-
Qui Tuot Nguyen
 市場を深く理解する情熱的な外国為替トレーダーとして、私は取引戦略を最適化するためのカスタム指標とエキスパートアドバイザー (EA) の作成を専門としています。市場トレンドの分析、自動化システムの開発、取引ツールの微調整における長年の経験により、私はトレーダーが一貫した成功を達成できるよう支援することに尽力しています。
取引戦略を強化したい場合でも、精度と効率を高めるために取引を自動化したい場合でも、私はお客様のニーズに合わせたソリューションを提供します。外国為替取引の可能性を最大限に引き出すために一緒に働きましょう! - バージョン: 1.0
- アクティベーション: 5
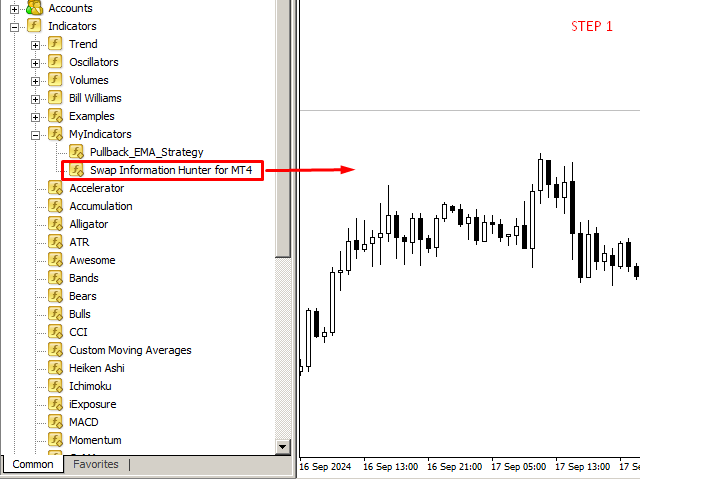
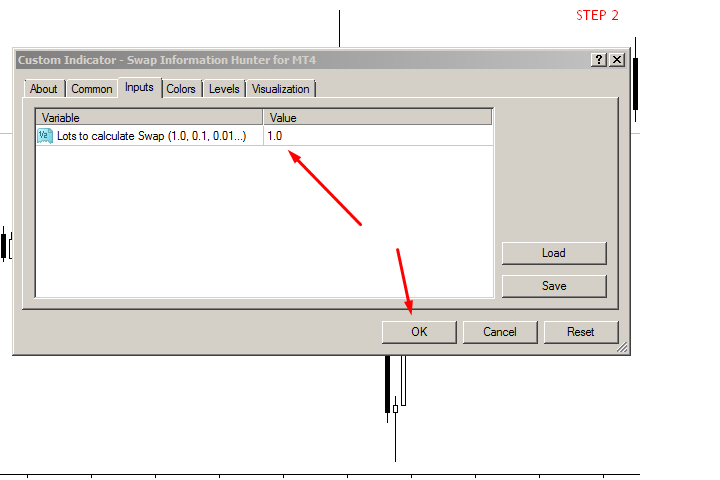
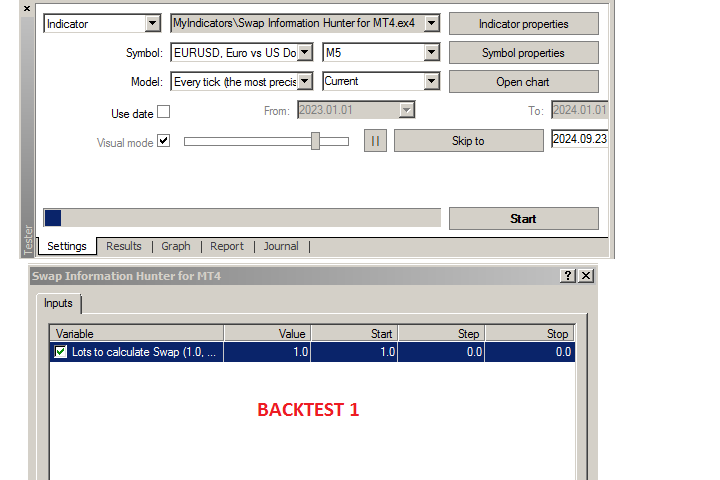
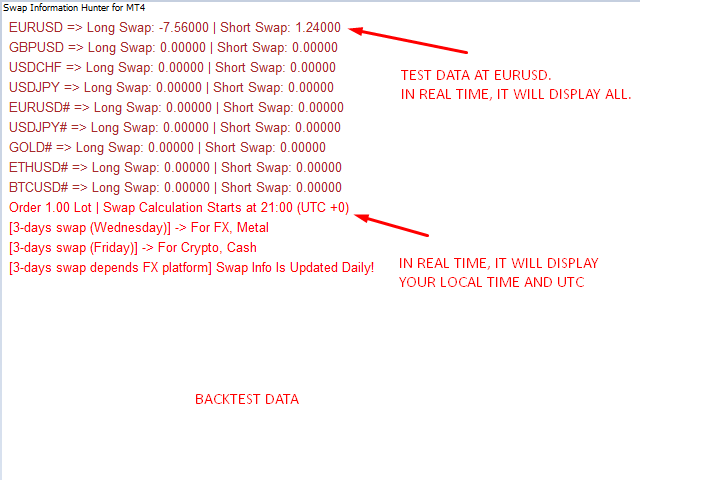
このツールは、取引プラットフォームで利用可能なすべての通貨ペアの詳細なスワップレートを表示するように設計されています。 これにより、トレーダーは視覚的に強化された別個のウィンドウでロングとショートの両方のスワップ値をすばやく確認できます。 このツールは、ロット サイズのユーザー定義の入力を提供し、現在のスワップ レートと取引量に基づいて正確な計算を保証します。 さらに、標準レートと週末調整レートの両方を考慮して、スワップ手数料が適用される時期も提供されます。 注: スワップ情報は取引プラットフォームに応じて毎日変わります。 -------------------------------------------------------------------------------------------------------------------------------------------------------------
このツールは、取引プラットフォームで利用可能なすべての通貨ペアの詳細なスワップレートを表示するように設計されています。 これにより、トレーダーは視覚的に強化された別個のウィンドウでロングとショートの両方のスワップ値をすばやく確認できます。 このツールは、ロット サイズのユーザー定義の入力を提供し、現在のスワップ レートと取引量に基づいて正確な計算を保証します。 さらに、標準レートと週末調整レートの両方を考慮して、スワップ手数料が適用される時期も提供されます。 注: スワップ情報は取引プラットフォームに応じて毎日変わります。