Swap Information Hunter Indicator
- 指标
-
Qui Tuot Nguyen
 作为一名对市场有深刻了解的热情外汇交易者,我专注于创建自定义指标和专家顾问 (EA) 来优化交易策略。凭借多年分析市场趋势、开发自动化系统和微调交易工具的经验,我致力于帮助交易者取得持续的成功。
无论您是希望增强交易策略还是自动化交易以提高准确性和效率,我都能提供适合您需求的解决方案。让我们共同努力,释放外汇交易的全部潜力! - 版本: 1.0
- 激活: 5
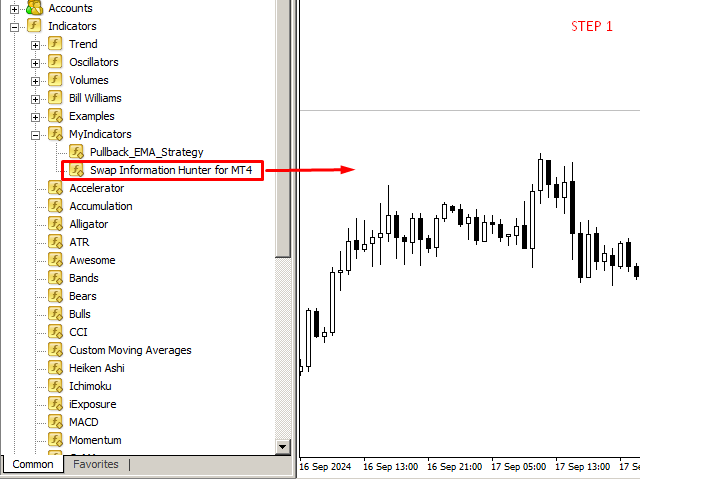
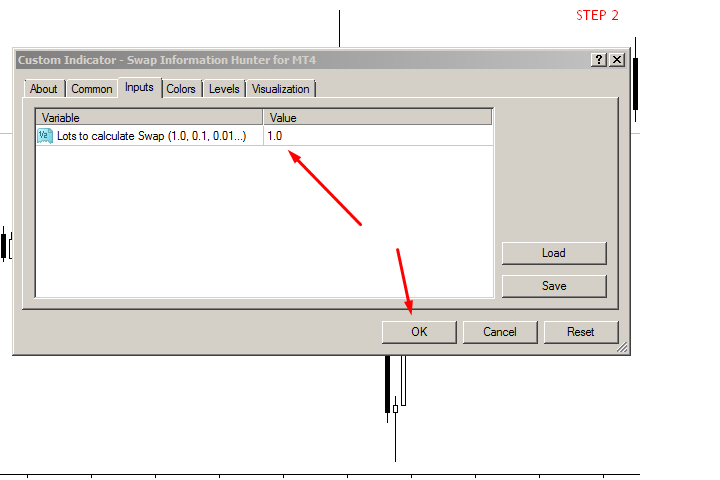
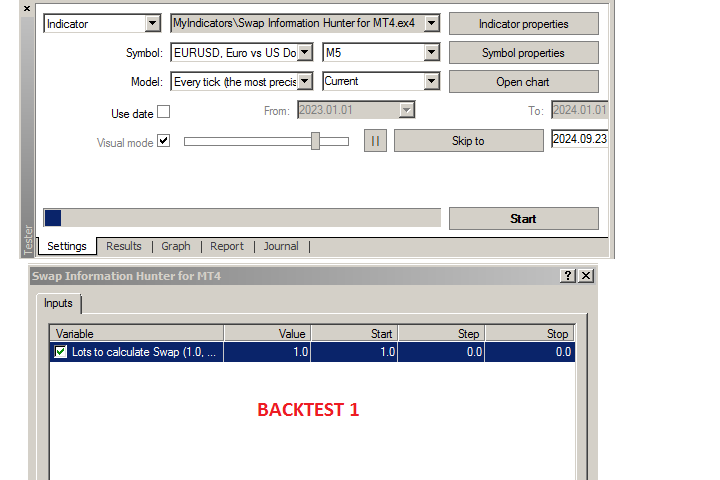
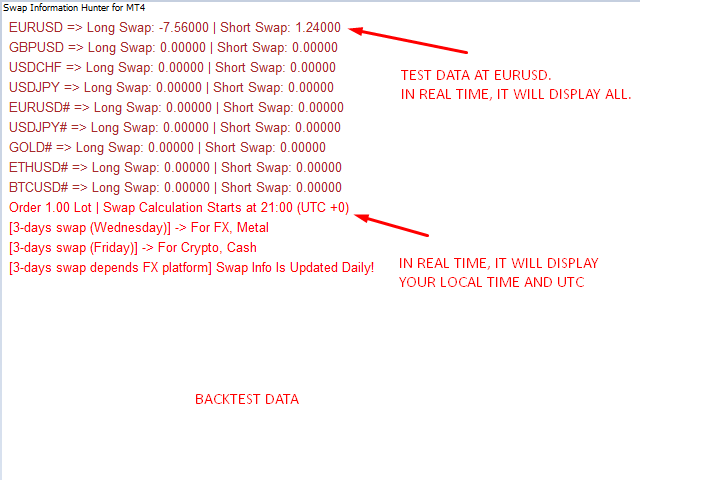
该工具旨在显示交易平台上所有可用货币对的详细掉期汇率。 它允许交易者在一个单独的、视觉增强的窗口中快速查看多头和空头掉期价值。 该工具提供用户定义的手数输入,确保根据当前掉期利率和交易量进行精确计算。 此外,它还提供了考虑标准利率和周末调整利率的情况下应用掉期费用的时间。 注意:交换信息每天都会根据您的交易平台而变化。 -------------------------------------------------------------------------------------------------------------------------------------------------------------
该工具旨在显示交易平台上所有可用货币对的详细掉期汇率。 它允许交易者在一个单独的、视觉增强的窗口中快速查看多头和空头掉期价值。 该工具提供用户定义的手数输入,确保根据当前掉期利率和交易量进行精确计算。 此外,它还提供了考虑标准利率和周末调整利率的情况下应用掉期费用的时间。 注意:交换信息每天都会根据您的交易平台而变化。