Imbalance DOM Pro

5

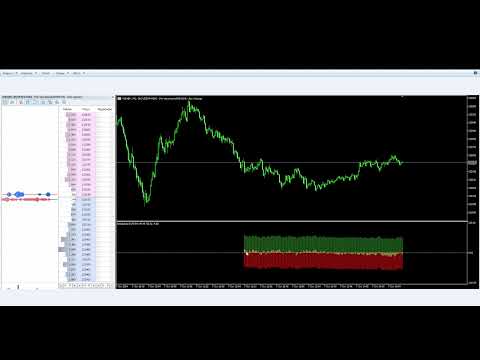
Imbalance DOM Pro: Enhance Your Trades with the Book Imbalance 📊🚀

DO YOU HAVE ACCESS TO THE ORDER BOOK ON MT5? WANT TO TAKE YOUR TRADING TO THE NEXT LEVEL?

If you're a trader who relies on order flow for decision-making, Imbalance DOM Pro can transform your analysis. Designed specifically for scalpers and short-term traders, it identifies imbalances in the order book, uncovering valuable opportunities for quick and precise trades.

🔎 Seize Opportunities in Small Price Movements
Imbalance DOM Pro is the ideal tool for those looking to capture subtle price swings. With advanced calculations, the indicator interprets the order book imbalance, providing crucial insights for quick entries and exits.

💡 IMPORTANT: Check Availability of the Order Book on MT5
Before using Imbalance DOM Pro, make sure your broker provides access to the order book on MT5. The indicator relies on this real-time data, as MT5 does not store historical order book information. Therefore, Imbalance DOM Pro works exclusively in real-time, giving you immediate readings of buy and sell orders in the market.

🚀 Benefits of Imbalance DOM Pro

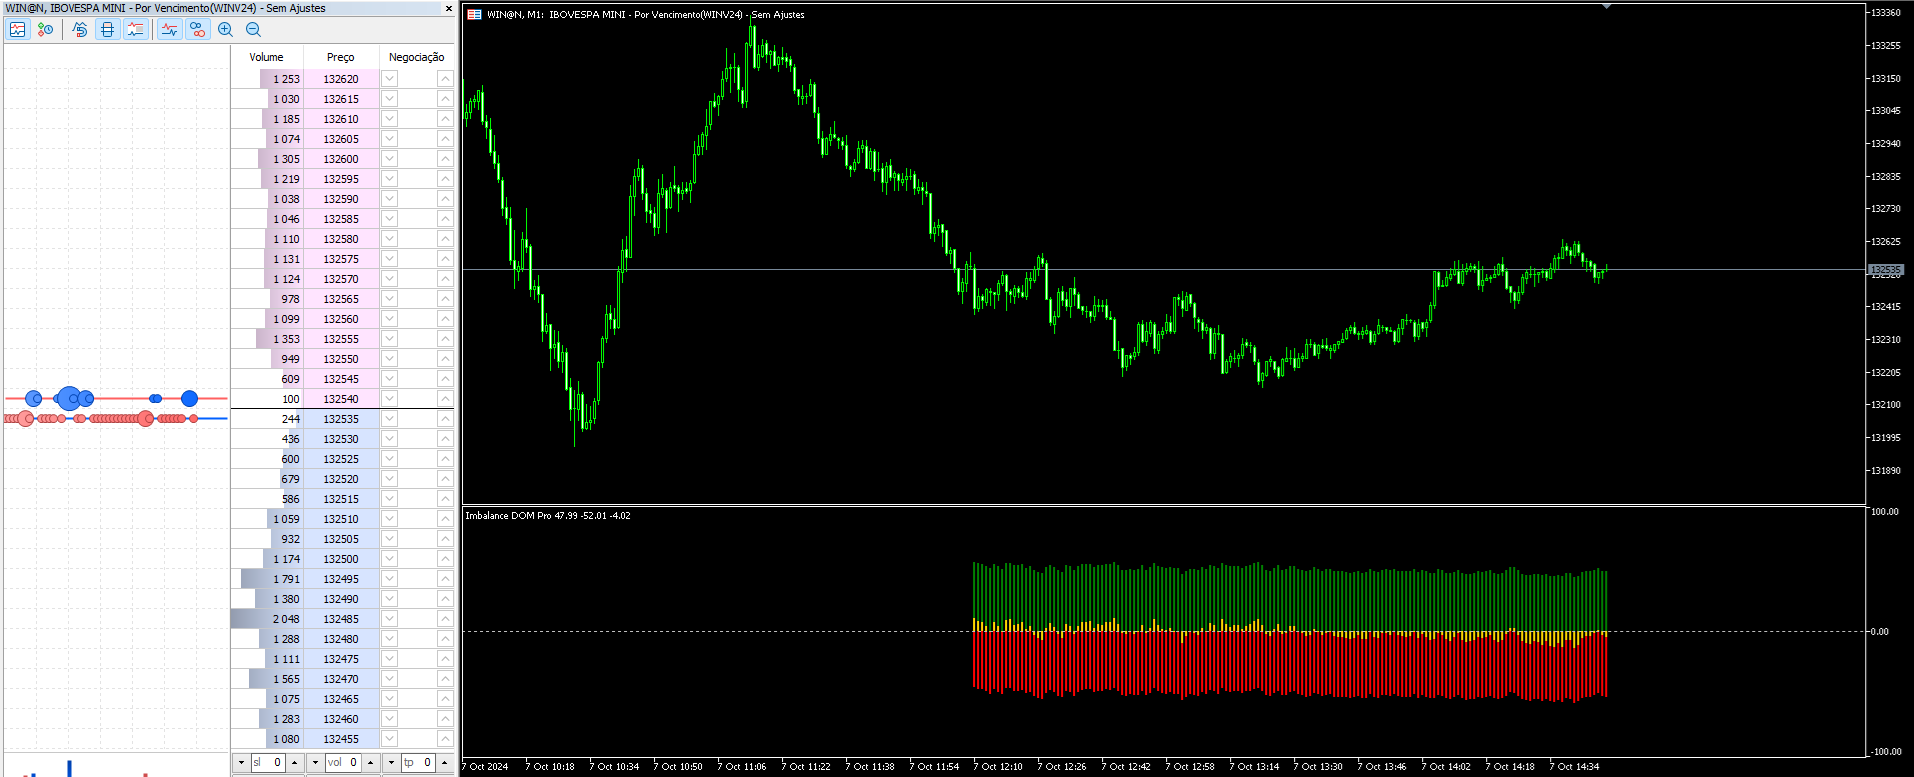
  1. Advanced Order Book Analysis with Specific Colors
    Imbalance DOM Pro makes it easy to read order imbalances with color-coding:

    • Green: Buy orders.
    • Red: Sell orders.
    • Gold: Highlights the imbalance between buy and sell orders.

    This color-coding simplifies the interpretation of order flow, ideal for short-term trading and scalping strategies.

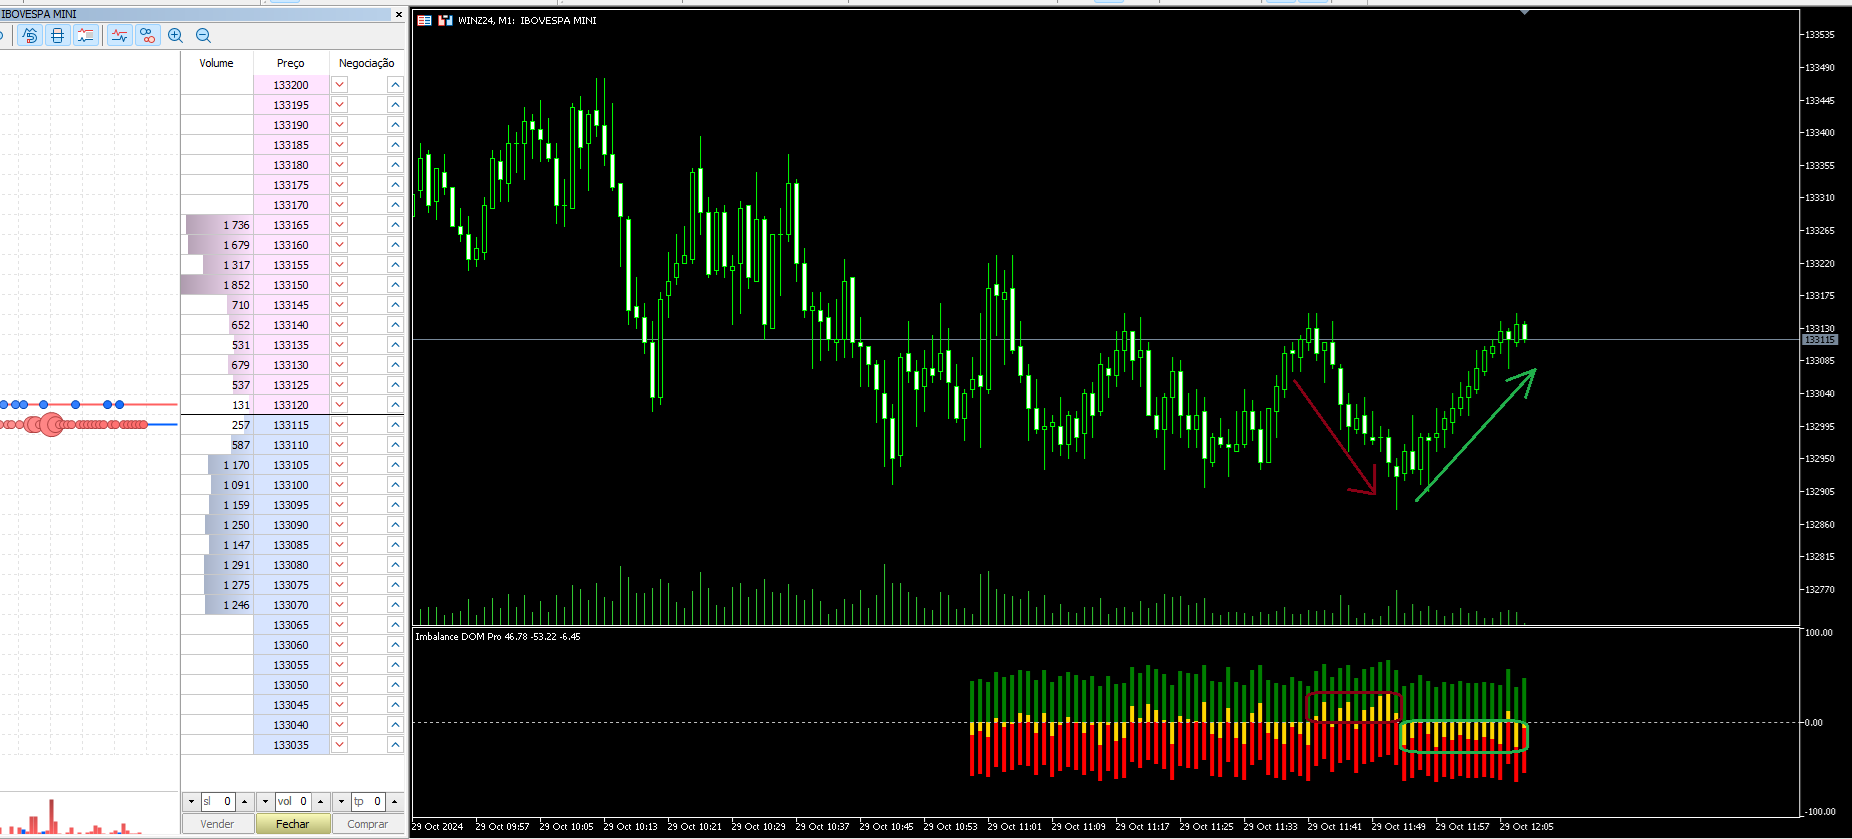
  2. Real-Time Buy and Sell Signals
    Get clear and quick signals directly on your chart, ensuring fast reactions to market flow changes.

  3. Designed for Order Flow Traders
    If your strategy is based on order flow, Imbalance DOM Pro reveals critical imbalances between buy and sell orders, enhancing your decision-making accuracy on every trade.

  4. Compatible with Expert Advisor Creation
    Set up Imbalance DOM Pro to integrate with EAs (Expert Advisors):

    • Buffer 0: Buy Signal
    • Buffer 1: Sell Signal
    • Buffer 2: Imbalance (Gold)

    These buffers allow you to automate strategies and maximize your trading performance.

  5. Intuitive Interface and Easy Setup
    Imbalance DOM Pro provides precise, real-time order flow analysis with an intuitive interface for easy use.

👉 Also check out the Times and Sales Pro for complementary insights into trade flow.


Reviews 1
epadilha
724
epadilha 2024.10.31 14:50 
 

talles parabenizando vc pelos brilhantes endicadores , estão me ajudando demais tres dias ja e olha não fico sem eles mais.

Recommended products
Volume Profile V6
Andrey Kolesnik
4.5 (2)
The volume profile indicator of the market + a smart oscillator. It works on almost all instruments-currency pairs, stocks, futures, cryptocurrency, on real volumes and on tick ones. You can set both the automatic definition of the profile range, for example, for a week or a month, etc., and set the range manually by moving the boundaries (two vertical lines red and blue). It is shown as a histogram. The width of the histogram at this level means, conditionally, the number of transactions condu
ProEngulfing For MT5
Ashkan Hazegh Nikrou
Pro Engulfing Indicator is professional indicator can detect qualified engulf patterns Free version of ProEngulfing is   QuallifiedEngulfing   By One Signal Limitation per day and less features Join   Koala Trading Solution Channel   in mql5 community to find out the latest news about all koala products, join link is below : https://www.mql5.com/en/channels/koalatradingsolution MT4 Version of this product already downable in link below :  https://www.mql5.com/en/market/product/52023 Introducing
Tron MT5
Franck Martin
5 (1)
TRON is the result of several months of development. Featuring an advanced algorithm and a combination of custom indicators, this EA is a blend of profitability, security and simplicity. With its intelligent real-time technology and proven trading strategy for several years now, it offers reliable long-term trading and knows how to adapt to the situations it encounters over time. *** Compatible with Prop Firm ***   (see backtest) Please check your Prop Firm's terms and rules for consistency and
The SMC Venom Model BPR indicator is a professional tool for traders working within the Smart Money (SMC) concept. It automatically identifies two key patterns on the price chart: FVG   (Fair Value Gap) is a combination of three candles, in which there is a gap between the first and third candles. It forms a zone between levels where there is no volume support, which often leads to a price correction. BPR   (Balanced Price Range) is a combination of two FVG patterns that form a “bridge” - a zon
Mine Farm
Maryna Kauzova
Mine Farm is one of the most classic and time-tested scalping strategies based on the breakdown of strong price levels. Mine Farm is the author's modification of the system for determining entry and exit points into the market... Mine Farm - is the combination of great potential with reliability and safety. Why Mine Farm?! - each order has a short dynamic Stop Loss - the advisor does not use any risky methods (averaging, martingale, grid, locking, etc.) - the advisor tries to get the most
Immediate Reversal Indicator
Bruno Rodrigues Paes Dourado Da Silva
This is an Immediate Reversal Indicator, a powerful tool designed to help traders and investors to identify trend reversal points in the financial market quickly and efficiently. Indicator Description: Our immediate reversal indicator is an arrow based on a combination of technical analysis and advanced algorithms, which aims to identify the moments when a market trend is about to reverse, can be used in all TimeFrames, can configure to send an alert when the signal appears. It is designed to
Golden Limit
Renato Fridschtein
There are no limits! Golden Limit is the ultimate indicator to get clear and easy readings of price movements on charts. It projects support and resistance ranges, calculated by statistical models involving Price Action and the Fibonacci sequence, revealing in advance the behavior of prices and the best places to trade and not to trade. It also has two moving averages to help choose the best entries. The Golden Limit method was created from a proven model. In summary: We use the names of precio
The  DYJ MOBILE GAMING TRADING WINNER  can use your various terminals (MOBILE PHONE, WEB, TRADINGVIEW, MT5) for manual trading, and then automatically processed by EA. Mobile trading can use EA's various grid modes, scalp mode, hedging arbitrage mode and independent order mode to open positions manually, EA can automatically set stop loss for mobile opening. And use your mobile phone to open a grid, scalp, and hedge orders. EA can set up fully automatic trading, set up automatic and mobile phone
Provided Trend is a complex signal formation indicator. As a result of the work of internal algorithms, you can see only three types of signals on your chart. The first is a buy signal, the second is a sell signal, and the third is a market exit signal. Options: CalcFlatSlow - The first parameter that controls the main function of splitting the price chart into waves. CalcFlatFast - The second parameter that controls the main function of splitting the price chart into waves. CalcFlatAvg - Para
Our   Basic Support and Resistance   indicator is the solution you need to boost your technical analysis. This indicator allows you to project support and resistance levels on the chart /   MT4 Version Features Integration of Fibonacci Levels:  With the option to display Fibonacci levels alongside support and resistance levels, our indicator gives you an even deeper insight into market behavior and possible reversal areas. Performance Optimization:  With the option to update extended lines onl
Was: $249  Now: $149   Market Profile defines a number of day types that can help the trader to determine market behaviour. A key feature is the Value Area, representing the range of price action where 70% of trading took place. Understanding the Value Area can give traders valuable insight into market direction and establish the higher odds trade. It is an excellent addition to any system you may be using. Inspired by Jim Dalton’s book “Mind Over Markets”, this indicator is designed to suit the
Trade smarter, not harder: Empower your trading with Harmonacci Patterns This is arguably the most complete harmonic price formation auto-recognition indicator you can find for the MetaTrader Platform. It detects 19 different patterns, takes fibonacci projections as seriously as you do, displays the Potential Reversal Zone (PRZ) and finds suitable stop-loss and take-profit levels. [ Installation Guide | Update Guide | Troubleshooting | FAQ | All Products ] It detects 19 different harmonic pri
EZ Trends
Guillermo Pineda
EZ Trends  is a precision trend detection indicator designed to make market structure shifts easier to spot in real time. Using a unique EMA–HMA hybrid band system, it highlights trend direction with adaptive candle coloring, andplots reaction levels at the start of each new trend The result is a practical tool that keeps traders aligned with momentum while filtering out market noise. KEY FEATURES Trend Detection Logic A three-line channel built from the average of an EMA and HMA (midline). Exp
A huge number of traders use the VolumeProfile/MarketProfile analysis method. And I think there is no need to explain such concepts as POC and VAH/VAL. However, the standard VolumeProfile representation has a drawback - we only see the current picture of the market. We see the "convexity" of the volume distribution within the period. But we don't see the main thing - the "migration" of the POC level during the price movement. Our indicator is unique. It is dynamic. The first feature is that the
This tool will perform Trailing stop loss and Break even management for orders. Helps you limit or reduce the time spend watching orders on the screen, especially when you need to go to sleep. Just add this EA to 1 chart, you can manage all pairs. You can filter orders by comment, magic number, symbol and order ticket number. When Breakeven it can add shift/offset pips (to cover the commission...). You can try in strategy tester before purchase. The EA will add Buy and Sell alternately, so you
Supply Demand Volume Zones — Institutional Support & Resistance levels with Bull/Bear Pressure Supply Demand Volume is a precision tool designed to automatically detect key supply and demand zones based on price structure, volume analysis, and real-time volatility. Built for traders who rely on accurate support and resistance levels, supply and demand order flow, Wyckoff schematics , or Smart money concepts , this indicator offers enhanced insights by showing buy vs. sell Volumes and marking pot
TPO Trading Analyzer Indicator MetaTrader 5 The TPO Trading Analyzer Indicator is a specialized tool designed to analyze market behavior using the principles of Time, Price, and Opportunity (TPO). Built upon the Market Profile methodology, this indicator detects and visualizes high-volume trading zones along with hidden support and resistance levels. It uses color-coded histograms to display trading volumes at various price points, with the intensity of the bars indicating the volume traded at
FREE
Awesome Oscillator by Bill Williams with the ability to fine-tune and replace the averaging algorithms of the indicator, which significantly expands the possibilities of using this oscillator in algorithmic trading and brings it closer in its properties to such an indicator as the MACD. To reduce price noise, the final indicator is processed with an additional Smooth averaging. The indicator has the ability to give alerts, send mail messages and push signals when the direction of movement of th
This is my first ExpertAdvisor, but it came along with more than 7 years in experience trading Forex , Crypto and Index.                                                                                SHEERAN: The Advanced Multi-Timeframe EA for Dynamic and Adaptive Trading   EA SHEERAN, is designed for traders who demand precision, flexibility, and reliability across multiple timeframes. Whether you’re targeting short-term gains on the M30 chart or looking for sustained moves on the H4, this E
Visual CrossPulse Dynamics Indicator
AL MOOSAWI ABDULLAH JAFFER BAQER
Visual CrossPulse Dynamics: Trade with the Market's True Rhythm Unlock a new level of market insight with Visual CrossPulse Dynamics, a sophisticated trading indicator designed to adapt to ever-changing volatility and reveal the true direction of the trend. Are you tired of indicators that lag in fast-moving markets or give false signals during consolidation? The Visual CrossPulse Dynamics indicator solves this problem by using an advanced, adaptive algorithm that intelligently adjusts to the m
Advanced Volume Profile Analysis Tool for MetaTrader 5 The Kecia Volume Profile Order Finder provides traders with volume profile analysis capabilities. This MT5 indicator combines volume profile visualization with statistical calculations to help identify potential trading opportunities and suggests entry, stop loss, and take profit levels based on market structure. Market Profile Visualization Transform your chart with customizable volume profile visualizations: Multiple visualization options
# NeuroX Quantum Arbitrage EA: Revolutionizing Automated Forex Trading ## Unleash the Power of Advanced Algorithms and Cutting-Edge Technology,  Load the preset by right-clicking on the EA on your chart, selecting "Properties," and then "Load" to import the   PRESET FILE . In the fast-paced world of forex trading, staying ahead of the curve is not just an advantage—it's a necessity. Introducing the NeuroX Quantum Arbitrage EA, a state-of-the-art Expert Advisor that combines time-tested trading
You can change the time period of the chart at the touch of a button. You can also change multiple charts at the touch of a button. You can also change multiple charts at the touch of a button,   saving you the trouble of changing time periods. We are live-streaming the actual operation of the system. Please check for yourself if it is usable. Please check it out for yourself. https://www.youtube.com/@ganesha_forex We do not guarantee your investment results. Investments should be made at you
Supply and Demand Indicator + FREE Currency Strength Meter ADD-ON Looking for a powerful tool that can help you identify the most reactive zones in the forex market? Our supply and demand indicator for MetaTrader 4 and 5 is exactly what you need. With its advanced algorithms and real-time analysis, this indicator helps traders of all experience levels make informed trading decisions. The supply and demand indicator is a cutting-edge tool that helps traders identify areas where buyers and sellers
Noize Absorption Index - is the manual trading system that measures the difference of pressure between bears forces and bulls forces. Green line - is a noize free index that showing curent situation. Zero value of index shows totally choppy/flat market.Values above zero level shows how powerfull bullish wave is and values below zero measures bearish forces.Up arrow appears on bearish market when it's ready to reverse, dn arrow appears on weak bullish market, as a result of reverse expectation.
Smart Prop Firm Trader
Fhulufhelo Norman Mamushiana
NOTE: FOR SETTINGS AND TECHNICAL SUPPORT HERE IS OUR SMART MONEY TELEGRAM LINK:  https://t.me/ +g51Apb2W5Ck0ZGFk WHAT IS SMART MONEY EA? Smart Money EA is not just another trading robot. It's a high precision trend following EA that leverages the Smart Money concept, price action, and market momentum to enter trades with exceptional accuracy." It's your all-in-one solution for trading EURUSD, Crude Oil, Nasdaq 100, Germany 40, and even volatility indices, including Step index . STAY INFORMED AN
Range Directional Force Indicator – Designed for You to Optimize! The Range Directional Force Indicator is a cutting-edge tool designed to empower traders by visualizing market dynamics and directional strength. Built to offer insights into market trends and reversals, this indicator is an invaluable asset for traders seeking precision in their strategies. However, it is important to note that this indicator is not optimized, leaving room for you to tailor it to your unique trading preferences.
Trading Utility for Forex Currency Pairs Only not for Gold  Functions Auto Lot Calculation based on Risk Auto stoploss  Auto TakeProfit Breakeven Auto Close Half % Close in percentage with respect to the PIPs Pending Orders BuyLimit Sell Limit with distances BuyStop Sell Stop    with distances Trading Informations Risk in percentage For Multiple trades Combine Takeprofit and Combine Stoplosses
Advanced Session Boxes with World Clock This indicator provides a comprehensive solution for visualizing the major forex trading sessions directly on your chart. It is designed to help traders identify the market's most active periods by highlighting the price action during the Sydney, Tokyo, London, and New York sessions. In addition to session boxes, the indicator includes a sleek, on-screen dashboard that acts as a world clock and session status panel, ensuring you're always in sync with glob
The uniqueness of this indicator lies in the volume accounting algorithm: accumulation occurs directly for the selected period without reference to the beginning of the day. The last bars can be excluded from the calculation, then the current data will have less influence on the significant levels (volumes) formed earlier. For a more accurate calculation, data from the M1 graph is used by default. The step of distribution of price volumes is regulated. By default, the right border of the display
Buyers of this product also purchase
How many times have you bought a trading indicator with great back-tests, live account performance proof with fantastic numbers and stats all over the place but after using it, you end up blowing your account? You shouldn't trust a signal by itself, you need to know why it appeared in the first place, and that's what RelicusRoad Pro does best! User Manual + Strategies + Training Videos + Private Group with VIP Access + Mobile Version Available A New Way To Look At The Market RelicusRoad is the
Introduction to X3 Chart Pattern Scanner X3 Cherart Pattern Scanner is the non-repainting and non-lagging indicator detecting X3 chart patterns including Harmonic pattern, Elliott Wave pattern, X3 patterns, and Japanese Candlestick patterns. Historical patterns match with signal patterns. Hence, you can readily develop the solid trading strategy in your chart. More importantly, this superb pattern scanner can detect the optimal pattern of its kind. In addition, you can switch on and off individu
AriX
Temirlan Kdyrkhan
1 (2)
AriX Indicator for MT5 A powerful trend-following and signal-evaluation tool AriX is a custom MT5 indicator that combines Moving Averages and ATR-based risk/reward logic to generate clear buy/sell signals. It visualizes dynamic SL/TP levels, evaluates past trade outcomes, and displays win/loss statistics in a clean on-chart panel. Key features include: Buy/Sell signals based on MA crossovers ATR-based SL/TP1/TP2/TP3 levels with visual lines and labels Signal outcome tracking with real-time stat
ARIPoint
Temirlan Kdyrkhan
ARIPoint is a powerful trading companion designed to generate high-probability entry signals with dynamic TP/SL/DP levels based on volatility. Built-in performance tracking shows win/loss stats, PP1/PP2 hits, and success rates all updated live. Key Features: Buy/Sell signals with adaptive volatility bands Real-time TP/SL/DP levels based on ATR Built-in MA Filter with optional ATR/StdDev volatility Performance stats panel (Success, Profit/Loss, PP1/PP2) Alerts via popup, sound, push, or email Cu
Custom Indictor Signal Scanner for scan your own any custom indicator and template its one click you can open your desire signals(given time frame alert). Also can open same template with particular input indicator just type name of template your created with given indicator and enjoy all time frame scan with your logical signals  input string s2 = "====== Embedded Indicator Settings ======"; input UseEmbeddedIndicator = false; // Use embedded indicator instead of external file ( don't use its n
This indicator identifies and displays zones, as it were areas of strength, where the price will unfold. The indicator can work on any chart, any instrument, at any timeframe. The indicator has two modes. The indicator is equipped with a control panel with buttons for convenience and split into two modes. Manual mode: To work with manual mode, you need to press the NEW button, a segment will appear. This segment is stretched over the movement and the LVL button is pressed. The level is displayed
Get the FREE AUX Indicator, EA Support & full Guide please visit - https://www.mql5.com/en/blogs/post/763955 Spot the Trend. Read the Pattern. Time the Entry. 3 Steps in Under 30 Seconds! Trade effortlessly — no analysis required, Your smart assistant is ready to simplify your workflow No more chart overload. Trade with confidence using smart bias detection. Compatible with all currencies, crypto, stocks, metals, indices, and any timeframe. Just click and execute — it’s that simple. Deal for bu
VTrende Pro
Andrii Diachenko
5 (1)
VTrende Pro - MTF indicator for trend trading with a display panel for MT5 *** Videos can be translated into any language using subtitles (video language - Russian) Although the signals of the VTrende Pro indicator can be used as signals of a full-fledged trading system, it is recommended to use them in conjunction with the Bill Williams TS. VTrende Pro is an extended version of the VTrende indicator. Difference between Pro version and VTrende: - Time zones - Signal V - signal 1-2 waves -    S
SupportResistancePeaks Indicator indicator - is the combination of dynamic support/resitance and price action pattern. As a rule support/resistance indicators uses already calculated, history levels. The most disadvantage of this method - new(incomming) levels always are not the same as were on history, in other words accuracy is not so high as expected. My indicator is looking for dynamic/live levels that are forming right now after trend lost it's power and choppy market starts. As a rule exac
Enigmera MT5
Ivan Stefanov
3.67 (3)
ENIGMERA: The core of the market Introduction This indicator and trading system is a remarkable approach to the   financial markets . ENIGMERA uses the fractal cycles to accurately calculate support and resistance levels.   It shows the authentic accumulation phase and gives direction and targets.    A system that works whether we are in a trend or a correction.   How It Works Most of the indicator’s functionality is controlled through buttons on the left side of the chart, allowing rapid res
Weis Wave with Alert MT5
Trade The Volume Waves Single Member P.C.
4.94 (16)
Rental/Lifetime Package Options and Privileges  Rent Monthly Six Months   Yearly/Lifetime Weis Wave with Speed with Alert+Speed Index x x x Manual  x x x Quick Set up Video x x x Blog x x x Lifetime Updates x x x Setup and Training Material x x Discord Access Channel "The SI traders"          x Rectangle Break Alert Tool      x How to trade with it:    http://www.tradethevolumewaves.com   ** If you purchase please contact me to setup your  : Training Room and  complete manual access.  Wei
The indicator highlights zones where interests are being declared then shows their accumulation zone. It works like an order book in big scale. This is the indicator for the biggest money. It's performance is exceptional. Whatever interest there is in the market you will see it. ( This is a fully rewritten, automated version—manual analysis is no longer required.)  The Transaction Speed is a new concept indicator that shows where and when large orders accumulates on the market and benefits o
SYSTEM INTRODUCTION:   The Binary Options Conqueror System Is Specifically Designed For Binary Options Trading. Unlike Other Systems And Indicators That Were Adopted From Other Trading Environments For Binary Options. Little Wonder Why Many Of Such Systems Fail To Make Money . Many End Up Loosing Money For Their Users.     Forward Testing Of The System Has Shown Remarkable Results . The Results Of Forward Testing On Live Trading Account Is Consistent With The Results Obtained By Back Testing .
A tool for on-chart strategy backtesting and performance analysis. A utility for developing, debugging, and testing custom trading ideas and indicator functions. An indicator designed to quickly test trading concepts and visualize the effectiveness of different input parameters. An all-in-one sandbox for testing everything from simple crossovers to complex, multi-condition trading systems.
The " Dynamic Scalper System MT5 " indicator is designed for the scalping method of trading within trend waves. Tested on major currency pairs and gold, compatibility with other trading instruments is possible. Provides signals for short-term opening of positions along the trend with additional price movement support. The principle of the indicator. Large arrows determine the trend direction. An algorithm for generating signals for scalping in the form of small arrows operates within trend wav
The Second-Level Tick Candlestick Generator is a professional-grade MT5 indicator tool specifically designed for high-frequency trading and short-term scalping. It can convert raw tick data into highly customizable second-level candlestick charts in real-time, helping traders accurately capture micro-market fluctuations and optimize entry and exit timing. This tool provides clear chart displays, allowing you to more intuitively identify price action patterns and improve trading decision efficien
Cycle Maestro MT5
Stefano Frisetti
5 (1)
NOTE: CYCLEMAESTRO is distributed only on this website, there are no other distributors. Demo version is for reference only and is not supported. Full versione is perfectly functional and it is supported. CYCLEMAESTRO , the first and only indicator of Cyclic Analysis, useful for giving signals of TRADING, BUY, SELL, STOP LOSS, ADDING. Created on the logic of   Serghei Istrati   and programmed by   Stefano Frisetti ;   CYCLEMAESTRO   is not an indicator like the others, the challenge was to inter
This indicator is based on the mathematics of the great trader W.D. Ganna. With its help, you can easily find strong levels by analyzing swings to find the optimal entry point. The indicator works on all instruments and all timeframes. The indicator is fully manual and has control buttons. All you need to do is press the NEW button, a segment will appear, which you can place on any movement, swing or even 1 candle that you want to analyze. By placing the segment, press the OK button. A grid (th
Elliot Waves Analyzer Pro
Viktor Weidenthal
2.67 (3)
Elliot Waves Analyzer Pro calculates Elliot Waves to Help Identify Trend direction and Entry Levels. Mainly for Swing Trading Strategies. Usually one would open a Position in trend direction for Wave 3 or a Correction for Wave C . This Indicator draws Target Levels for the current and next wave. Most important Rules for Elliot Wave Analysis are verified by the Indicator.  The Pro version analyzes Multiple Timeframes and shows the Subwaves and Target-Levels.   For an Overview  " Elliot Waves Anal
The indicator is designed to work on any trading platform. The program is based on proprietary algorithms and W.D.Ganna's mathematics, allowing you to calculate target levels of price movement based on three points with the highest degree of certainty. It is a great tool for stock trading. The indicator has three buttons: NEW - call up a triangle for calculation. DEL - delete the selected triangle. DELS - completely remove all constructions. The probability of achieving the goals is more than 80
SYSTEM INTRODUCTION:   The Binary Options Momentum System Is Specifically Designed For Binary Options Trading. Unlike Other Systems And Indicators That Were Adopted From Other Trading Environments For Binary Options. Little Wonder Why Many Of Such Systems Fail To Make Money . Many End Up Loosing Money For Their Users.  A Very Important Fact That Must Be Noted Is The Fact That Application Of Martingale Is not Required. Thus Making It Safer For Traders Usage And Profitability. A Trader Can Use Fi
Financial Indicator SolarTrade Suite: Mercury Market Indicator - Your Reliable Guide in the World of Financial Markets! Our Forex trading program is equipped with a powerful artificial intelligence that analyzes market data in real-time. It accurately predicts price movements, helping traders make informed decisions. With advanced algorithms, our indicator optimizes strategies and minimizes risks for traders. It is a moving average that uses special innovative and advanced algorithms to calcula
Core Concept: Naveen Saroha's Advanced time and price angles are drawn from significant highs or lows at specific geometric ratios that represent the relationship between price movement and time. The Main Gann Angles and Percentage together Most Important: 1x1 Angle : One units of price for one unit of time  1x2 Angle : One unit of price for two units of time  1x3 Angle 1x4 Angle 1x5 Angle 1x6 Angle 1x7 Angle 1x8 Angle: (45) : Eight unit of price for one unit of time - considered the most i
TrendMaestro5
Stefano Frisetti
note: this indicator is for METATRADER4, if you want the version for METATRADER5 this is the link:  https://www.mql5.com/it/market/product/108106 TRENDMAESTRO ver 2.4 TRENDMAESTRO recognizes a new TREND in the bud, he never makes mistakes. The certainty of identifying a new TREND is priceless. DESCRIPTION TRENDMAESTRO identifies a new TREND in the bud, this indicator examines the volatility, volumes and momentum to identify the moment in which there is an explosion of one or more of these data a
Multi Currency Multi Time Market Scan Signals Multi Currency Multi Time Market Scan Signals (MT5 Dashboard) Unlock Smarter Trading with Real-Time Market Insights Across Multiple Currencies & Timeframes! The Multi Currency Multi Time Market Scan Signals dashboard is your all-in-one solution for MetaTrader 5 , designed to simplify complex market analysis and pinpoint high-probability trading opportunities. Say goodbye to manual chart hopping – this powerful tool scans multiple symbols and timef
Tragos
David Chokumanyara
TRAGOS Indicator – The GOAT of All Trading Indicators TRAGOS (Greek for “male goat”) isn’t just a name — it’s the GOAT: Greatest of All Time in trading indicators. Designed for Forex, Indices, Gold, Crypto, and Deriv Synthetic Indices (Boom & Crash, Volatility 75, Step, Jump, etc.), it gives you non-repainting buy, sell, and exit signals with unmatched clarity. Why TRAGOS? Non-Repainting Signals – 100% reliable. Audible, Email & Push Alerts – Never miss a trade. Trend Following – Rid
Pro Thunder V10 Neural Network Indicator for MT5 | Binary Options & OTC Trading Signals Elevate your binary options trading with   Pro Thunder V10 , the ultimate AI-powered indicator engineered for MetaTrader 5. Leveraging cutting-edge Neural Networks and years of market expertise, this non-repaint tool delivers unmatched accuracy across all market conditions—including volatile news events, OTC markets, Deriv indices (Boom 300, Crash 500), and more. Join thousands of traders worldwide who trust
Jeslyn MT5
Justine Kelechi Ekweh
This is a multi-purpose system that suits both Binary options, and Forex. Manual traders can use this either as a scalping system or a strategy to get into very strong momentum, or it can be automated for forex trading with Universal EAs.   This is a less-risky system if you know what to do with it or just use a universal EA. Use on M5 timeframe There is of course no chance of repainting or recalculation. Once the price closes, the arrows remain there forever! This is because prices don't lie.
Viking Strategy Signal Indicator
E Bahamlong Bagoudjare
5 (1)
Viking Strategy Indicator – The Beating Heart of the BT 3.0 System The Viking Strategy Indicator is not just another indicator… It’s one of the pillars of the revolutionary BT 3.0 trading system , built to transform the trading experience for everyone — from beginners to experts . BT 3.0 is much more than a tool: It’s a complete trading solution , both semi-automated and fully automated , integrating 6 powerful indicators and a smart assistant that analyzes, detects, alerts, and executes
IVISTscalp5
Vadym Zhukovskyi
5 (6)
What's new about iVISTscalp5 forecast indicator (Version 10)? iVISTscalp5 is a unique nonlinear forecasting for a week ahead system for any financial instrument which executes fast scalping using time levels. iVISTscalp5 is a tool for easy study and understanding of financial market. 1) iVISTscalp5 forecast indicator has been completely rewritten into another programming language (C++), which has accelerated data loading and processing. As a result, a different graphical display of forecasts
More from author
Radar DI
Thalles Nascimento De Carvalho
Radar DI – Indicador de Taxa de Juros para Mini Índice e Mini Dólar Radar DI é um indicador especializado que transforma as variações da taxa de juros DI (Depósitos Interfinanceiros) em sinais operacionais estratégicos para os ativos mini índice (WIN) e mini dólar (WDO) . Fundamento Econômico por Trás do Indicador O conceito central do Radar DI se apoia na relação direta entre os juros futuros e o comportamento dos mercados de renda variável: Queda na taxa DI: indica menor custo de capital, m
FREE
VWAP FanMaster
Thalles Nascimento De Carvalho
4 (1)
VWAP FanMaster: Master the Pullback Strategy with Precision! The VWAP FanMaster is the ultimate indicator for traders seeking accurate entries and efficient pullbacks . It combines the power of VWAP (Volume Weighted Average Price) with Fibonacci Fan lines , providing a clear map of high-interest zones in the market. Key Features Simple yet powerful : Just move the vertical lines, and the indicator automatically draws both VWAP and Fibonacci Fan lines. Smart trading strategy : Wait f
FREE
Box Weis Wave
Thalles Nascimento De Carvalho
5 (1)
Elevate Your Analysis with the Weis Wave Box ! If you seek precision and clarity in your trading , the Weis Wave Box is the perfect tool. This advanced volume wave indicator provides clear visualization of the effort vs. result dynamics in the market — essential for traders focused on volume and flow reading. Key Features: Customizable Volume Waves – adjust in ticks to fit your strategy. Adjustable History – analyze specific periods with more accuracy. Real Volume vs Ticks – unders
Book Data Binance
Thalles Nascimento De Carvalho
Book Data Binance! Ever wanted direct access to the order book of your favorite cryptocurrency, complete with price levels, volumes, and imbalance analysis, even if your exchange doesn’t provide DOM access? With Book Data Binance, that’s now a reality! This MQL5 script was specially developed for crypto traders seeking an in-depth look at market dynamics. Main Features: Direct access to the order book of any cryptocurrency available in the script menu. Real-time data updates from
FREE
Volume Flow Binance
Thalles Nascimento De Carvalho
Volume Flow Binance! Have you ever imagined accessing the times and trades of your favorite cryptocurrency, with detailed insights into volume flow and price movement analysis, even if your broker doesn’t offer complete trading history access? With Volume Flow Binance , that’s now a reality! This MQL5 script is designed for cryptocurrency traders seeking a detailed view of real-time market dynamics. Key Features: Direct access to the times and trades of any cryptocurrency listed i
FREE
Cumulative Volume Bands
Thalles Nascimento De Carvalho
CVB Cumulative Volume Bands: Maximize Your Trades with Accumulated Volume! The CVB Cumulative Volume Bands is an advanced indicator designed for traders seeking precise insights based on accumulated volume. By using cumulative volume bands, this indicator offers clear readings of market buying and selling pressures, helping to identify reversals and strong price movements. Cumulative Volume Bands for MT5 ! Key Features: Accumulated Volume Analysis : Detect pressure points based
Footprint Hunter
Thalles Nascimento De Carvalho
Footprint Hunter – Your Effort vs. Result Radar on MT4 Footprint Hunter is the ultimate indicator for traders who want to see the real game behind prices on MetaTrader 4 It clearly and intuitively shows the aggressive buy and sell volume based on the POC (Point of Control), giving you the ability to visualize market effort and the actual result on each candle. ️ Why does this matter? Not all volume moves the price! Tape Hunter highlights whether the effort (aggressive volume) is effect
Swing Point Volume
Thalles Nascimento De Carvalho
Swing Point Volume, the indicator that signals weakness and strength at the tops and bottoms. This indicador can be for used the Wyckoff Method. Information provided; - Swing on customized ticks. - Volume and points in each balance sheet. - Percentage of Displacement. - Sound alert option on top and bottom breaks. - Volume in ticks and Real Volume. - Volume HL (extreme) or (opening and closing) - Customized volume shapes.
Atr Projection
Thalles Nascimento De Carvalho
The ATR Projection Indicator stands out as a robust tool in technical analysis, designed to provide accurate insights into potential price movement limits in the financial market. Its flexible approach allows users to customize analysis metrics intuitively, adapting to the specific needs of each traded asset. Customizable Operation: By default, the ATR Projection operates considering 30% of the average of the last 100 candles. This flexibility enables users to adjust metrics according to their
Long Short Pro
Thalles Nascimento De Carvalho
Long & Short Indicator - Pro Version: Unlock Unlimited Market Analysis Potential! No Restrictions for Any Asset The Pro version of the Long & Short Indicator offers complete freedom to use it on any financial asset. No more limits - apply the same indicator to all your favorite assets! No Restrictions Enjoy all the features of the indicator with no limitations. The Pro version provides a full, unrestricted experience, allowing you to maximize every market opportunity. Pro Version
AI Channel
Thalles Nascimento De Carvalho
AI Channel | MT5 Indicator with Artificial Intelligence AI Channel: The Future of Technical Analysis with Artificial Intelligence AI Channel is a powerful tool that leverages artificial intelligence for analyzing price channels in the financial market. In this section, we will explore how this revolutionary indicator can help investors and traders make more informed and strategic decisions. Let’s dive in! What is the AI Channel Indicator? The AI Channel is an indicator developed base
Didi Index Volume
Thalles Nascimento De Carvalho
Introducing the Didi Index Volume, a technical analysis indicator developed by Brazilian trader Odir Aguiar, which stands out for its advanced and powerful approach in identifying opportunities in the financial market. Available on various platforms, the Didi Index Volume has become an essential tool for traders seeking precise insights and valuable information for their trading strategies. The indicator combines the renowned Didi Index, created by Odir Aguiar, with intelligent use of trading v
TimeChannel
Thalles Nascimento De Carvalho
The "Timechannel" is a powerful technical analysis tool designed specifically for traders who want to gain deeper and more accurate insights into price movements across multiple timeframes (multi-timeframe). This indicator is an essential addition to the toolbox of any serious trader seeking to make informed and data-driven trading decisions. Key Features: Advanced Multi-Timeframe Analysis : Timechannel allows traders to analyze price movements on different timeframes simultaneously. This is cr
Big Player Range
Thalles Nascimento De Carvalho
5 (3)
BigPlayerRange — Best Indicator for Micro Index and Micro Dollar | MT5 Unlock the power of BigPlayerRange , widely recognized as the best institutional indicator for the micro index and micro dollar on MetaTrader 5. This powerful tool highlights strategic zones of institutional activity, providing ultra-precise market structure insights. How It Works: BigPlayerRange draws two horizontal zones based on institutional volume action: Green Zone — Where institutional buyers defend the price.
Master OBV
Thalles Nascimento De Carvalho
MasterOBV: Master Market Trends with Precision! The MasterOBV is a technical analysis indicator that combines volume , positive correlation , and a Moving Average (MA) to refine trend identification in financial markets. Key Features: Smart Volume: Analyzes trading volume to identify significant changes in trend strength. Positive Correlation: Incorporates correlated assets for a broader and more accurate view, reinforcing the potential for price displacement based on pair volume.
VolaMetrics VSA
Thalles Nascimento De Carvalho
VolaMetrics VSA | A Powerful Ally in Technical Analysis The VolaMetrics VSA is a technical analysis indicator that combines the Volume Spread Analysis (VSA) methodology with detailed analysis of trading volume . Designed to identify and track significant price movements , VolaMetrics VSA uses the interaction between volume and price spread to provide valuable insights that can aid in trading decisions. Fundamentals of Volume Spread Analysis (VSA) Volume Spread Analysis (VSA) is a respected
SwingVolumePro
Thalles Nascimento De Carvalho
Overview The SwingVolumePro is an advanced and versatile indicator, designed to be applied to a wide range of financial assets and support different trading styles. Developed based on rigorous volume and price analysis, it offers clear and precise signals that allow traders of all levels to make informed decisions based on high-quality data.      SwingVolumePro.PDF Key Features Versatility: SwingVolumePro can be applied to various assets, including stocks, forex, cryptocurrencies, an
CVD SmoothFlow Pro
Thalles Nascimento De Carvalho
CVD SmoothFlow Pro - Unlimited Volume Analysis for Any Asset! CVD SmoothFlow Pro is the ultimate solution for traders seeking precise and unlimited volume analysis. Utilizing Cumulative Volume Delta (CVD) with advanced noise filtering, the Pro Version provides the flexibility and precision needed to trade any financial asset. What does CVD SmoothFlow Pro offer? Clear Analysis : Filters out noise and highlights significant volume movements across any financial asset. ️ Precise Calculation
Cumulative Vol Bands
Thalles Nascimento De Carvalho
CVB Cumulative Volume Bands: Maximize Your Trades with Accumulated Volume! The CVB Cumulative Volume Bands is an advanced indicator designed for traders seeking precise insights based on accumulated volume. By using cumulative volume bands, this indicator offers clear readings of market buying and selling pressures, helping to identify reversals and strong price movements. Key Features: Accumulated Volume Analysis : Detect pressure points based on volume. Clear Entry/Exit Signa
ZigWave Oscillator
Thalles Nascimento De Carvalho
ZigWave Oscillator: Enhance Your Trades with Oscillators and ZigZag! The ZigWave Oscillator is the perfect tool for traders seeking precision and clarity in financial market analysis. This indicator combines the strength of oscillators with the visual simplicity of ZigZag, helping you identify the best buying and selling opportunities quickly and efficiently. Why Choose the ZigWave Oscillator? Precise Oscillator Analysis : Integrate RSI, Williams %R, or CCI to capture key market moveme
Times and Sales Pro
Thalles Nascimento De Carvalho
Times and Sales Pro: Enhance Your Trading with Trade Flow Imbalance Opportunities in Small Price Movements Times and Sales Pro is an essential tool for analysts operating with order flow from Times and Trades . Perfect for scalpers, it was designed for those who seek to capitalize on small price fluctuations with high precision. With advanced calculations, the indicator identifies imbalances in trades, providing valuable signals for quick entries and exits. IMPORTANT: Availability of
Mini Indice Composition
Thalles Nascimento De Carvalho
Mini Índice Composition: A Revolução na Análise do Mini Índice! O Mini Índice Composition é um indicador inovador que monitora em tempo real as principais ações que compõem o mini índice, trazendo uma visão quantitativa poderosa sobre o fluxo de ordens do mercado! Como Funciona? Diferente de outros indicadores que utilizam apenas dados históricos, o Mini Índice Composition faz uma leitura ao vivo das ordens que entram e saem das ações, pesando o impacto direto no mini índice. Com
Tape Hunter
Thalles Nascimento De Carvalho
Tape Hunter – Your Effort vs Result Radar on MT5 Tape Hunter is the ultimate indicator for traders wanting to see the real game behind prices on MetaTrader 5. It clearly and intuitively shows the aggressive buy and sell volume based on the POC (Point of Control), giving you the ability to visualize market effort and actual results in each candle. ️ Why does it matter? Not all volume leads to movement! Tape Hunter highlights whether the effort (aggressive volume) is effectively moving th
Filter:
epadilha
724
epadilha 2024.10.31 14:50 
 

talles parabenizando vc pelos brilhantes endicadores , estão me ajudando demais tres dias ja e olha não fico sem eles mais.

Thalles Nascimento De Carvalho
8084
Reply from developer Thalles Nascimento De Carvalho 2024.10.31 15:00
Obrigado!🙏
Reply to review