Imbalance DOM Pro

5

Imbalance DOM Pro: 주문서의 불균형으로 거래를 강화하세요 📊🚀

MT5에서 주문서에 접근할 수 있나요? 거래를 새로운 수준으로 끌어올리고 싶나요?

주문 흐름을 기반으로 결정을 내리는 트레이더라면, Imbalance DOM Pro가 분석을 혁신적으로 바꿔줄 것입니다. 스캘퍼와 단기 트레이더를 위해 설계된 이 도구는 주문서의 불균형을 식별하고, 빠르고 정확한 진입과 청산을 위한 귀중한 거래 기회를 제공합니다.

🔎 작은 가격 변동에서 기회를 잡으세요
Imbalance DOM Pro는 작은 가격 변동을 잡고자 하는 트레이더에게 이상적인 도구입니다. 고급 계산을 통해 이 지표는 주문서의 불균형을 해석하고, 빠른 진입과 청산을 위한 중요한 정보를 제공합니다.

💡 중요: MT5에서 주문서의 사용 가능 여부를 확인하세요
Imbalance DOM Pro를 사용하기 전에, 브로커가 MT5에서 주문서에 접근할 수 있는지 확인하세요. 이 지표는 실시간 데이터에 의존하기 때문에, MT5는 주문서의 히스토리를 저장하지 않습니다. 따라서 Imbalance DOM Pro는 실시간으로만 작동하며, 시장의 매수 및 매도 주문을 즉시 읽어들입니다.

🚀 Imbalance DOM Pro의 장점
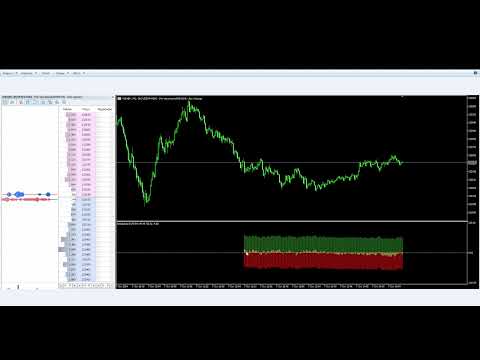
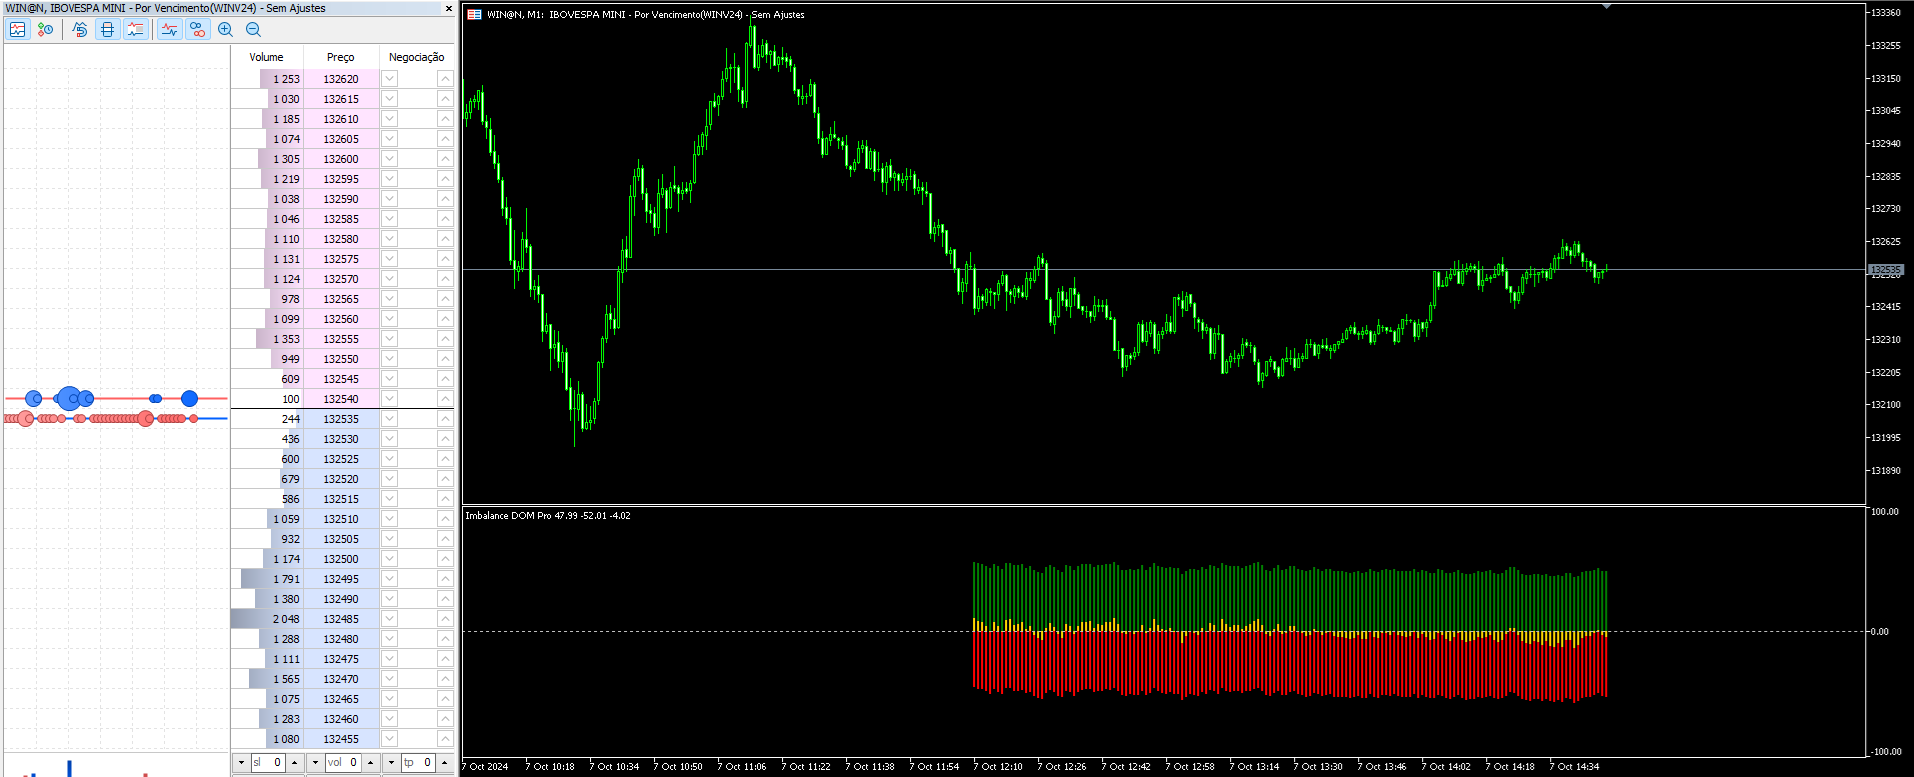
  1. 주문서를 고급 분석하는 색상 표시
    Imbalance DOM Pro는 다음과 같은 색상으로 주문의 불균형을 명확히 시각화합니다:

    • 초록색: 매수 주문
    • 빨간색: 매도 주문
    • 금색 (Gold): 매수 및 매도 주문의 불균형

    이 색상 코드는 주문 흐름을 해석하는 데 도움을 주며, 단기 거래와 스캘핑에 최적입니다.
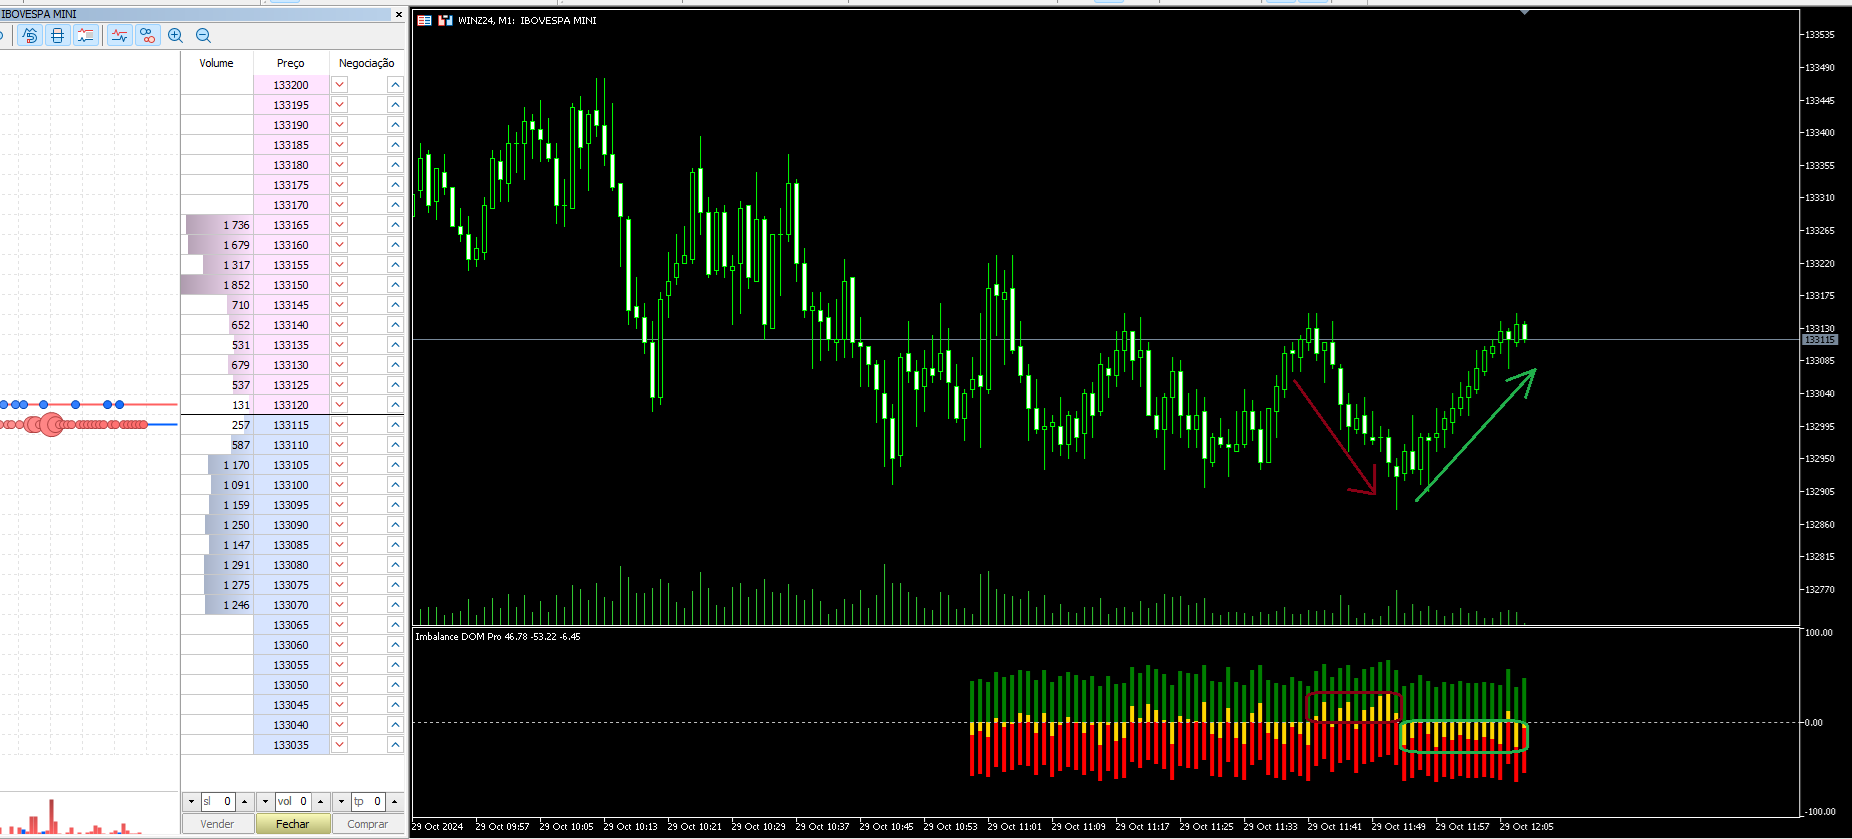
  2. 실시간 매수 및 매도 신호
    차트에서 실시간으로 명확한 신호를 받아, 주문 흐름의 변화를 빠르게 반영할 수 있습니다.

  3. 주문 흐름을 기반으로 하는 트레이더에게 이상적
    주문 흐름을 기반으로 한 전략을 사용하고 있다면, Imbalance DOM Pro는 매수와 매도 주문 간의 불균형을 명확히 보여주어 거래 결정을 더 정확하게 할 수 있도록 돕습니다.

  4. Expert Advisor(EA) 제작과의 호환성
    Imbalance DOM Pro는 EA(Expert Advisors)와 통합할 수 있도록 설정할 수 있습니다:

    • 버퍼 0: 매수 신호
    • 버퍼 1: 매도 신호
    • 버퍼 2: 불균형 (Gold)

    이 버퍼를 통해 전략을 자동화하고, 거래 성과를 극대화할 수 있습니다.

  5. 직관적인 인터페이스와 쉬운 설정
    Imbalance DOM Pro는 실시간으로 주문 흐름을 정밀하게 분석하며, 간단한 인터페이스로 사용하기 쉽습니다.

👉 Times and Sales Pro도 확인하여 거래 흐름에 대한 추가 인사이트를 얻어보세요.


리뷰 1
epadilha
734
epadilha 2024.10.31 14:50 
 

talles parabenizando vc pelos brilhantes endicadores , estão me ajudando demais tres dias ja e olha não fico sem eles mais.

추천 제품
️ Trade Manager oneclick  ( Reverse Trade,  Partial Close,  Breakeven, Close All Running Trade )   control – Smart Manual Trade Control for MT5 Trade Manager oneclick control is a powerful yet lightweight trade management utility built for manual traders who want precise control over their open positions — directly from the MT5 chart. This EA does not open or close trades automatically based on any strategy. It simply provides one-click management tools to handle your running trades efficient
FREE
Volume Profile V6
Andrey Kolesnik
4.67 (3)
시장 매물대 지표(Volume Profile) + 스마트 오실레이터. 통화 쌍, 주식, 선물, 암호화폐 등 거의 모든 종목에서 작동하며, 실제 거래량(Real Volume)과 틱 거래량(Tick Volume)을 모두 지원합니다. 프로파일 생성 범위를 일주일이나 한 달 등으로 자동 설정할 수 있을 뿐만 아니라, 두 개의 수직선(빨간색과 파란색)을 이동하여 수동으로 범위를 설정할 수도 있습니다. 히스트그램 형태로 표시되며, 특정 가격 수준의 히스토그램 너비는 해당 가격대에서 발생한 거래량을 의미합니다. Mode level line color 파라미터를 사용하면 가격이 반등할 가능성이 높은 주요 매물대 수준을 자동으로 표시할 수 있으며, Maximum color 파라미터는 설정된 전체 범위에서 거래가장 많이 발생한 최대 거래량 수준을 별도로 보여줍니다. 스마트 오실레이터는 과매수 및 과매도 구간을 표시합니다. 여러 지표로부터 오는 정보를 분석하고, 처리된 데이터를 바탕으로 과매수 및 과매
Delta Profile Volume
Teresinha Moraes Correia
기술 설명 – MetaTrader 5용 Delta Profile Delta Profile 은 MetaTrader 5에서 정의된 캔들 범위 내의 거래량 흐름을 세부적으로 분석하기 위해 설계된 지표입니다. 이 도구는 각 가격 수준에서 양의 거래량(상승과 관련) 과 음의 거래량(하락과 관련) 간의 불균형을 구조화하고 시각화합니다. 이를 통해 사용자는 실제로 거래가 집중되는 가격 영역과 시장 불균형이 형성되는 구간을 명확하게 파악할 수 있습니다. 핵심 개념 지표는 가격 레벨 을 인식하고 이를 양의 거래량, 음의 거래량 및 순 델타(양-음 차이)로 분류합니다. 각 가격 레벨은 수평 막대 로 차트에 표시되며, 거래가 집중되는 구간을 직관적으로 보여줍니다. 사용자는 분석할 캔들의 개수 , 가격 반올림 정밀도 , 최대 표시 레벨 수 , 표시 옵션 등을 직접 설정할 수 있습니다. 주요 기능 가격 레벨 매핑 : 사용자가 지정한 자릿수에 맞게 가격을 반올림하여 거래량을 집계합니다. 순 델타 계산 : 양
Reverse Trader
ELITE FOREX TRADERS LLC
ELITE REVERSE TRADER (MT5) Instantly hedge or invert any trade opened on your account—manual or EA. Reverse Mirror EA monitors your live positions and opens an opposite trade using your chosen lot mode (Fixed or Multiplier). When the original position is closed (manual close, SL/TP hit, EA exit—any method), the mirrored position closes automatically. Because it runs in the same terminal, it reacts faster than third-party copy tools. WHY THIS MATTERS It is widely cited that a large majority of
Tron MT5
Franck Martin
5 (1)
TRON is the result of several months of development. Featuring an advanced algorithm and a combination of custom indicators, this EA is a blend of profitability, security and simplicity. With its intelligent real-time technology and proven trading strategy for several years now, it offers reliable long-term trading and knows how to adapt to the situations it encounters over time. *** Compatible with Prop Firm ***   (see backtest) Please check your Prop Firm's terms and rules for consistency and
Correlation Matrix Pro - 다중 통화 헤지 스캐너 실시간으로 통화쌍 간의 상관관계를 파악하세요! 최대 6개의 통화쌍 간 통계적 관계를 동시에 시각화하는 강력한 분석 도구입니다. 포트폴리오 관리, 리스크 분산 및 헤지 전략에 완벽합니다. 주요 기능 - 로그 수익률을 사용한 실시간 피어슨 상관관계 - 최대 6개 통화쌍 동시 모니터링 - 자동 타임프레임 감지 - 조정 가능한 룩백 기간 (5-200 봉) - 헤지 기회 자동 감지 - 미니멀하고 접을 수 있는 패널 디자인 - 즉각적인 해석을 위한 색상 코딩 매트릭스 색상 코드 녹색 (+0.70 ~ +1.00) = 강한 양의 상관관계 연녹색 (+0.50 ~ +0.69) = 중간 양의 상관관계 회색 (-0.49 ~ +0.49) = 약한/상관관계 없음 주황색 (-0.50 ~ -0.69) = 중간 음의 상관관계 빨간색 (-0.70 ~ -1.00) = 강한 음의 상관관계 (헤지) 왜 상관관계인가? 리스크 관리 높은 상관관계 포지션을
FREE
SMC Venom Model BPR 지표는 Smart Money(SMC) 개념 내에서 일하는 트레이더를 위한 전문 도구입니다. 가격 차트에서 두 가지 주요 패턴을 자동으로 식별합니다. FVG (공정 가치 갭)는 3개의 캔들의 조합으로, 첫 번째와 세 번째 캔들 사이에 갭이 있습니다. 이는 볼륨 지원이 없는 레벨 사이에 구역을 형성하여 종종 가격 수정으로 이어집니다. BPR (균형 가격 범위)은 두 개의 FVG 패턴의 조합으로, "브리지"를 형성합니다. 이는 가격이 낮은 볼륨 활동으로 움직일 때 브레이크아웃과 레벨로의 복귀 구역으로, 캔들 사이에 갭을 생성합니다. 이러한 패턴은 거래자가 차트에서 거래량과 가격 역학을 분석하여 주요 지지/저항 수준, 돌파 구역 및 진입 지점을 식별하는 데 도움이 되며, 여기서 대형 시장 참여자와 일반 참여자 간의 상호 작용이 발생합니다. 이 지표는 사각형과 화살표 형태로 패턴을 시각화하며 유연한 경고 설정도 지원합니다. 주요 특징: 패턴 표시 모드
Live Forex Trading EA
Aryaman Shah
5 (1)
In trading, Sell or Buy decision is not easy. You need to do a lot of analysis and then wait for suitable entry. Despite this, majority of traders suffer losses and ultimately blow up their accounts. Here comes this AI bot, that will automatically decide to Sell or Buy using its artificial intelligence. It works well with or without News trading. The AI-powered bot is designed to automatically learn from its trades, optimizing its strategy daily to enhance accuracy and maximize profitability in
Mine Farm
Maryna Kauzova
Mine Farm is one of the most classic and time-tested scalping strategies based on the breakdown of strong price levels. Mine Farm is the author's modification of the system for determining entry and exit points into the market... Mine Farm - is the combination of great potential with reliability and safety. Why Mine Farm?! - each order has a short dynamic Stop Loss - the advisor does not use any risky methods (averaging, martingale, grid, locking, etc.) - the advisor tries to get the most
Korean 코드의 장점 설명 (코드 언급 없음) 1. 정밀한 시장 상태 구분 (3차원) 단순한 상승/하락뿐만 아니라 '횡보(Sideways)' 구간을 분리해 줍니다. 매수 우위 (Bullish) 매도 우위 (Bearish) 핵심: 시장의 방향성이 없는 구간을 파악하여 진입 실수를 줄입니다. 2. 오실레이터 강도 측정 (0-100) 과열 구간: 과매수/과매도 구간(예: 80 이상, 20 이하)을 표시합니다. 영역 채우기: 피크 구간에 색상을 입혀 직관적으로 보여줍니다. 3. 노이즈 필터링의 유연성 (스무딩) 거짓 신호 감소: 다양한 이동평균 방식(RMA, EMA 등)을 통해 차트의 노이즈를 제거합니다. 거래량 가중치: **거래량(Volume)**을 계산에 포함시켜 신뢰도를 높일 수 있습니다. 4. 명확한 시각적 신호 교차 화살표: 추세가 전환될 때 화살표로 진입 시점을 알려줍니다. 화면 설정: 차트를 깔끔하게 유지하기 위해 선이나 색상을 켜고 끌 수 있습니다. 5. 성능 및 안정성
ProEngulfing For MT5
Ashkan Hazegh Nikrou
ProEngulfing 무료 버전은 QualifiedEngulfing으로, 하루에 하나의 신호로 제한되며 기능이 적습니다. 모든 Koala 제품에 대한 최신 정보를 확인하려면 mql5 커뮤니티에서 Koala Trading Solution 채널에 가입하세요. 가입 링크는 아래와 같습니다: https ://www .mql5 .com /en /channels /koalatradingsolution 이 제품의 MT4 버전은 아래 링크에서 다운로드 가능합니다: https ://www .mql5 .com /en /market /product /52023 ProEngulfing 소개 – MT4용 전문가 수준의 Engulf 패턴 지표 정확성을 극대화한 ProEngulfing을 소개합니다. 이 최신 지표는 포렉스 시장에서 신뢰할 수 있는 Engulf 패턴을 식별하고 강조하는 데 중점을 둔 제품입니다. MetaTrader 4에 맞게 개발된 ProEngulfing은 신뢰도 높은 신호를 제공하기 위해
Harmonic Pattern Structure Harmonic Pattern Structure is a professional MetaTrader 5 indicator that automatically detects classic harmonic patterns using strict Fibonacci ratio validation and XABCD price structure. Designed for traders who value precision, clean visuals, and structured analysis, the indicator highlights potential reversal zones based on price geometry, supporting consistent and objective decision-making. SUPPORTED HARMONIC PATTERNS Gartley (222) Butterfly Bat Crab Shark Cy
Immediate Reversal Indicator
Bruno Rodrigues Paes Dourado Da Silva
This is an Immediate Reversal Indicator, a powerful tool designed to help traders and investors to identify trend reversal points in the financial market quickly and efficiently. Indicator Description: Our immediate reversal indicator is an arrow based on a combination of technical analysis and advanced algorithms, which aims to identify the moments when a market trend is about to reverse, can be used in all TimeFrames, can configure to send an alert when the signal appears. It is designed to
This Volume Delta Profile is an advanced MetaTrader 5 indicator that visualizes   volume delta (order flow imbalance)   using a volume profile-style histogram. It shows the difference between buying and selling pressure at specific price levels, helping traders identify supply and demand zones. This indicator provides a unique perspective on market dynamics by visualizing the imbalance between buying and selling pressure, offering insights beyond traditional volume analysis. Core Concept Positiv
Golden Limit
Renato Fridschtein
There are no limits! Golden Limit is the ultimate indicator to get clear and easy readings of price movements on charts. It projects support and resistance ranges, calculated by statistical models involving Price Action and the Fibonacci sequence, revealing in advance the behavior of prices and the best places to trade and not to trade. It also has two moving averages to help choose the best entries. The Golden Limit method was created from a proven model. In summary: We use the names of precio
DYJ MOBILE GAMING TRADING WINNER 는 귀하의 다양한 단말기(MOBILE PHONE, WEB, TRADINGVIEW, MT5)를 수동 거래에 사용할 수 있으며 EA에서 자동으로 처리됩니다. 모바일 거래는 EA의 다양한 그리드 모드, 두피 모드, 헤지 차익 거래 모드 및 독립 주문 모드를 사용하여 수동으로 포지션을 열 수 있으며, EA는 모바일 개통을 위한 손절매를 자동으로 설정할 수 있습니다. 그리고 휴대폰을 사용하여 그리드, 두피 및 헤지 주문을 열 수 있습니다. EA는 전자동 거래를 설정하거나, 자동 및 휴대전화 수동 혼합 거래를 설정하거나, 독립적인 휴대전화 수동 거래를 설정할 수 있습니다. 주문 방향이 맞으면 TP는 시장을 떠납니다. 주문 방향이 틀릴 경우 EA는 패배에서 승리로 전환할 수 있습니다. EA는 모든 외환 브로커 및 다양한 거래에 적합합니다. Deriv 중개인 Syntheic 계정 색인과 호환됩니다. EA는 입금액과 레버리지의
Provided Trend
Nadiya Mirosh
Provided Trend is a complex signal formation indicator. As a result of the work of internal algorithms, you can see only three types of signals on your chart. The first is a buy signal, the second is a sell signal, and the third is a market exit signal. Options: CalcFlatSlow - The first parameter that controls the main function of splitting the price chart into waves. CalcFlatFast - The second parameter that controls the main function of splitting the price chart into waves. CalcFlatAvg - Para
우리의   Basic Support and Resistance   표시기는 기술 분석을 향상시키는 데 필요한 솔루션입니다.이 표시기는 차트/ MT4 버전 특징 피보나치 수준의 통합 : 지원 및 저항 수준과 함께 피보나치 수준을 표시하는 옵션과 함께, 우리의 지표는 시장 행동과 가능한 역전 영역에 대한 더 깊은 통찰력을 제공합니다. 성능 최적화 : 각 막대의 개구부에서만 확장 라인을 업데이트하는 옵션을 사용하여, 우리의 지표는 지원 및 저항 수준의 정확도를 희생하지 않고 최적의 성능을 보장합니다. 입력 주요 설정 Timeframe:  이 입력을 통해 차트에 더 높은 기간의 지지선과 저항선을 표시하도록 선택할 수 있습니다. Support/Resistance Strength [Number of Bars]:   이 입력을 사용하면 지지대와 저항의 강도를 결정할 수 있습니다.숫자가 높을수록지지/저항이 더 강해집니다. Price mode:  이 매개 변수를 사용하면 지원 및 저항 수준을
Blahtech Market Profile MT5
Blahtech Limited
5 (10)
Was: $249  Now: $99   Market Profile defines a number of day types that can help the trader to determine market behaviour. A key feature is the Value Area, representing the range of price action where 70% of trading took place. Understanding the Value Area can give traders valuable insight into market direction and establish the higher odds trade. It is an excellent addition to any system you may be using. Inspired by Jim Dalton’s book “Mind Over Markets”, this indicator is designed to suit the
Trade smarter, not harder: Empower your trading with Harmonacci Patterns This is arguably the most complete harmonic price formation auto-recognition indicator you can find for the MetaTrader Platform. It detects 19 different patterns, takes fibonacci projections as seriously as you do, displays the Potential Reversal Zone (PRZ) and finds suitable stop-loss and take-profit levels. [ Installation Guide | Update Guide | Troubleshooting | FAQ | All Products ] It detects 19 different harmonic pri
EZ Trends
Guillermo Pineda
EZ Trends 는 실시간으로 시장 구조 변화를 쉽게 식별할 수 있도록 설계된 정밀 트렌드 탐지 지표입니다. 독창적인 EMA–HMA 하이브리드 밴드 시스템을 사용하여 캔들 색상을 자동으로 변경해 추세 방향을 강조하고, 새로운 추세 시작 시 반응 레벨을 표시합니다. 그 결과, 트레이더가 모멘텀에 맞추어 시장 잡음을 걸러낼 수 있도록 돕는 실용적인 도구가 됩니다. 주요 기능 추세 탐지 로직: EMA와 HMA 평균을 기반으로 한 3라인 채널. 캔들의 평균 범위를 이용해 상/하단을 동적으로 확장. 변동성에 즉각 대응하며, 압축/확장 및 돌파 가능성을 보여줌. 상승 추세: 종가가 상단 밴드 위에서 마감. 하락 추세: 종가가 하단 밴드 아래에서 마감. 캔들이 자동 색상 변경 (라임 = 상승, 파랑 = 하락). 추세 시작 레벨: 새 추세 시작 시 극단적인 고점/저점 고정. 점선 수평선으로 표시해 재테스트/검증 구역 제공. 시각적 레이아웃: 중앙선: EMA + HMA 평균 (점선). 상단/하단:
CvdDeltaVolumes
Parasbhai N Patel
Delta + CVD & CVD Candles Order-flow indicator combining Delta (Ask–Bid), Cumulative Volume Delta (CVD), and a unique CVD-based synthetic candle system. Shows buy/sell pressure, volume aggressiveness, and momentum shifts with optional Delta histogram, CVD line, and CVD+Delta combined candles. Useful for scalping, intraday trading, divergence detection, and understanding buyer/seller dominance. Overview The Delta + CVD & CVD Candles Indicator combines multiple order-flow tools into one clean
Volume Profile Advance
Israr Hussain Shah
Daily & Composite Volume Profile   This is a professional-grade market profile tool designed for MetaTrader 5. It utilizes a   Dual-Profile System   to visualize supply, demand, and liquidity concentrations. Key Features Left Side: Daily Session Profiles Automatically identifies the start and end of every trading day. Generates a unique Volume Profile for each individual day. Allows you to see how value migrated from yesterday to today (e.g., Is today's volume higher or lower than yesterday?).
Point of Control POC
Anton Polkovnikov
A huge number of traders use the VolumeProfile/MarketProfile analysis method. And I think there is no need to explain such concepts as POC and VAH/VAL. However, the standard VolumeProfile representation has a drawback - we only see the current picture of the market. We see the "convexity" of the volume distribution within the period. But we don't see the main thing - the "migration" of the POC level during the price movement. Our indicator is unique. It is dynamic. The first feature is that the
True TrendLines MT5 - Smart Trend Detection & Alerts Overview True TrendLines MT5 is a professional-grade technical analysis tool that automatically identifies and plots high-probability trend lines on your MetaTrader 5 charts. Using a sophisticated swing point detection algorithm, it helps traders visualize key market structure and potential reversal points with precision. Key Features Automatic Trend Line Detection Identifies valid swing highs and lows based on your chosen strength paramet
FREE
This tool will perform Trailing stop loss and Break even management for orders. Helps you limit or reduce the time spend watching orders on the screen, especially when you need to go to sleep. Just add this EA to 1 chart, you can manage all pairs. You can filter orders by comment, magic number, symbol and order ticket number. When Breakeven it can add shift/offset pips (to cover the commission...). You can try in strategy tester before purchase. The EA will add Buy and Sell alternately, so you
수요 공급 볼륨 존 — 기관급 지지/저항 및 매수·매도 압력 표시 Supply Demand Volume 는 가격 구조, 거래량 분석 및 실시간 변동성을 기반으로 주요 수요 및 공급 구역을 자동으로 탐지하는 정밀한 도구입니다. 정확한 지지/저항 레벨, 수급 흐름, Wyckoff 이론 또는 스마트 머니 개념을 사용하는 트레이더를 위해 설계되었으며, 매수/매도 세력 비교 및 잠재적 반전 신호를 시각적으로 제공합니다. 주요 기능: 자동 존 탐지 – 과거 고점/저점 및 ATR(평균 진폭)을 기반으로 주요 기관 거래 구역을 감지합니다.   매수/매도 볼륨 분석 – 실시간으로 매수/매도 세력의 강도를 시각화하여 방향성을 확인합니다.   중간선 및 가격 라벨 – 컬러와 가격 마커가 포함된 중간선 제공.   시간 기반 확장 – 구역이 자동으로 미래까지 확장되어 지속적으로 유효하게 유지됩니다. 추천 대상: 반전 트레이더 돌파 트레이더 볼륨 및 프라이스 액션 기반 트레이더 스캘핑 및 인트라데
Awesome Oscillator by Bill Williams with the ability to fine-tune and replace the averaging algorithms of the indicator, which significantly expands the possibilities of using this oscillator in algorithmic trading and brings it closer in its properties to such an indicator as the MACD. To reduce price noise, the final indicator is processed with an additional Smooth averaging. The indicator has the ability to give alerts, send mail messages and push signals when the direction of movement of th
This is my first ExpertAdvisor, but it came along with more than 7 years in experience trading Forex , Crypto and Index.                                                                                SHEERAN: The Advanced Multi-Timeframe EA for Dynamic and Adaptive Trading   EA SHEERAN, is designed for traders who demand precision, flexibility, and reliability across multiple timeframes. Whether you’re targeting short-term gains on the M30 chart or looking for sustained moves on the H4, this E
Visual CrossPulse Dynamics Indicator
AL MOOSAWI ABDULLAH JAFFER BAQER
Visual CrossPulse Dynamics: Trade with the Market's True Rhythm Unlock a new level of market insight with Visual CrossPulse Dynamics, a sophisticated trading indicator designed to adapt to ever-changing volatility and reveal the true direction of the trend. Are you tired of indicators that lag in fast-moving markets or give false signals during consolidation? The Visual CrossPulse Dynamics indicator solves this problem by using an advanced, adaptive algorithm that intelligently adjusts to the m
이 제품의 구매자들이 또한 구매함
ARIPoint
Temirlan Kdyrkhan
ARIPoint is a powerful trading companion designed to generate high-probability entry signals with dynamic TP/SL/DP levels based on volatility. Built-in performance tracking shows win/loss stats, PP1/PP2 hits, and success rates all updated live. Key Features: Buy/Sell signals with adaptive volatility bands Real-time TP/SL/DP levels based on ATR Built-in MA Filter with optional ATR/StdDev volatility Performance stats panel (Success, Profit/Loss, PP1/PP2) Alerts via popup, sound, push, or email Cu
Azimuth Pro
Ottaviano De Cicco
5 (4)
LAUNCH PROMO Azimuth Pro price is initially set at 299$ for the first 100 buyers. Final price will be 499$ . THE DIFFERENCE BETWEEN RETAIL AND INSTITUTIONAL ENTRIES ISN'T THE INDICATOR — IT'S THE LOCATION. Most traders enter at arbitrary price levels, chasing momentum or reacting to lagging signals. Institutions wait for price to reach structured levels where supply and demand actually shift. Azimuth Pro maps these levels automatically: swing-anchored VWAP, multi-timeframe structure lines, an
Pointer Trend Switch — precision trend reversal indicator Pointer Trend Switch is a high-precision arrow indicator designed to detect key moments of trend reversal based on asymmetric price behavior within a selected range of bars. It identifies localized price impulses by analyzing how far price deviates from the opening level, helping traders find accurate entry points before a trend visibly shifts. This indicator is ideal for scalping, intraday strategies, and swing trading, and performs equa
" Dynamic Scalper System MT5 " 지표는 추세 파동 내에서 스캘핑 방식으로 거래하도록 설계되었습니다. 주요 통화쌍 및 금에서 테스트되었으며, 다른 거래 상품과의 호환성이 가능합니다. 추가적인 가격 변동 지원을 통해 추세에 따라 단기 포지션 진입 신호를 제공합니다. 지표의 원리 큰 화살표는 추세 방향을 결정합니다. 작은 화살표 형태의 스캘핑 신호를 생성하는 알고리즘은 추세 파동 내에서 작동합니다. 빨간색 화살표는 상승 방향을, 파란색 화살표는 하락 방향을 나타냅니다. 민감한 가격 변동선은 추세 방향으로 그려지며, 작은 화살표의 신호와 함께 작용합니다. 신호는 다음과 같이 작동합니다. 적절한 시점에 선이 나타나면 진입 신호가 형성되고, 선이 있는 동안 미결제 포지션을 유지하며, 완료되면 거래를 종료합니다. 권장되는 작업 시간대는 M1~H4입니다. 화살표는 현재 캔들에 형성되며, 다음 캔들이 이미 시작되었더라도 이전 캔들의 화살표는 다시 그려지지 않습니다. 입
Transaction Speed MT5
Ivan Stefanov
5 (3)
이 지표는 시장에서 관심이 나타나는 영역 을 강조 표시한 후, 주문이 누적되는 영역 을 보여줍니다. 이는 **대규모 오더북(호가창)**처럼 작동합니다. 이것은 거대한 자금 을 위한 인디케이터입니다. 성능은 탁월하며, 시장에서 어떤 관심이 있든 반드시 포착할 수 있습니다 . (이것은 완전히 새로 작성되고 자동화된 버전 입니다 – 이제 수동 분석은 필요하지 않습니다.) **거래 속도(Transaction Speed)**는 새로운 개념의 인디케이터로, 시장에 대규모 주문이 언제, 어디에 쌓이는지를 보여주며 , 그 이점을 분석합니다. 매우 초기 단계에서 트렌드 전환 을 감지할 수 있습니다. FX 시장에서 흔히 사용하는 "거래량(volume)"은 오해입니다. 실제로는 시간당 가격 변화량 이므로, 올바른 용어는 거래 속도 입니다. 우리가 어떻게 사고하고, 행동하며, 분석하느냐 가 가장 중요합니다. 분석 패러다임의 전환 은 필수적입니다. 이 인디케이터는 외환 시장에서의 볼륨 개념을 논리적으로
TrendMaestro5
Stefano Frisetti
note: this indicator is for METATRADER4, if you want the version for METATRADER5 this is the link:  https://www.mql5.com/it/market/product/108106 TRENDMAESTRO ver 2.5 TRENDMAESTRO recognizes a new TREND from the start, he never makes mistakes. The certainty of identifying a new TREND is priceless. DESCRIPTION TRENDMAESTRO identifies a new TREND in the bud, this indicator examines the volatility, volumes and momentum to identify the moment in which there is an explosion of one or more of these da
RelicusRoad Pro MT5
Relicus LLC
5 (24)
RelicusRoad Pro: 퀀트 시장 운영 체제 70% 할인 평생 이용권 (한정 시간) - 2,000명 이상의 트레이더와 함께하세요 왜 대부분의 트레이더는 "완벽한" 지표를 가지고도 실패할까요? 진공 상태에서 단일 개념 만으로 거래하기 때문입니다. 문맥 없는 신호는 도박입니다. 지속적인 승리를 위해서는 컨플루언스(중첩) 가 필요합니다. RelicusRoad Pro는 단순한 화살표 지표가 아닙니다. 완전한 퀀트 시장 생태계 입니다. 독점적인 변동성 모델링을 사용하여 가격이 이동하는 "공정 가치 로드"를 매핑하고, 단순 노이즈와 실제 구조적 돌파를 구분합니다. 추측은 그만두세요. 기관급 로드 로직으로 거래를 시작하세요. 핵심 엔진: "Road" 알고리즘 시스템의 중심에는 시장 상황에 실시간으로 적응하는 동적 변동성 채널인 Road Algo 가 있습니다. 세이프 라인(평형) 과 가격이 수학적으로 반전될 가능성이 높은 확장 레벨 을 투영합니다. Simple Road: 일반적인 시장을 위
Scalping Winning Signals Pro SWS
Muhammad Usman Siddique
5 (1)
UZFX SWS {스캘핑 승리 신호} 프로 v1.0은 빠르게 움직이는 시장에서 정확한 진입 신호를 찾는 스캘퍼, 데이 트레이더, 스윙 트레이더를 위해 Usman Zabir(UZFX LABS)가 특별히 개발한 강력하고 재도색되지 않는 지표입니다. 지연이나 잘못된 재도색 없이 신뢰할 수 있는 실시간 신호를 요구하는 트레이더에게 이상적입니다. 추천* 최적 시간대: 30분 이상. {1시간}이 가장 선호하며, 결과는 놀라울 정도입니다...! 주요 기능: 최근 및 과거 신호를 명확한 시각적 화살표로 표시(오래된 신호는 점으로 표시 옵션 포함). 자동 계산 및 그리기 기능: 진입선, 손절선(최근 스윙 저점/고점 기준), 다중 이익실현선(RRR 1:1, 2:1, 3.5:1 – 완전 커스터마이징 가능). 최신 신호 세부사항, 진입가, 손절선, 이익실현선을 표시하는 차트 내 정보 패널. 종합 알림: 팝업, 소리, 푸시 알림, 이메일. 차트 커스터마이징 옵션(색상, 배경, 캔들 스타일). 안전한
ARIScalping
Temirlan Kdyrkhan
ARIScalp is a powerful trading companion designed to generate high-probability entry signals with dynamic TP/SL/DP levels based on volatility. Built-in performance tracking shows win/loss stats, PP1/PP2 hits, and success rates all updated live. Key Features: Buy/Sell signals with adaptive volatility bands Real-time TP/SL/DP levels based on ATR Built-in MA Filter with optional ATR/StdDev volatility Performance stats panel (Success, Profit/Loss, PP1/PP2) Alerts via popup, sound, push, or email Cus
ARICoins
Temirlan Kdyrkhan
ARICoin is a powerful trading companion designed to generate high-probability entry signals with dynamic TP/SL/DP levels based on volatility. Built-in performance tracking shows win/loss stats, PP1/PP2 hits, and success rates all updated live. Key Features: Buy/Sell signals with adaptive volatility bands Real-time TP/SL/DP levels based on ATR Built-in MA Filter with optional ATR/StdDev volatility Performance stats panel (Success, Profit/Loss, PP1/PP2) Alerts via popup, sound, push, or email Cust
AriX
Temirlan Kdyrkhan
AriX Indicator for MT5 A powerful trend-following and signal-evaluation tool AriX is a custom MT5 indicator that combines Moving Averages and ATR-based risk/reward logic to generate clear buy/sell signals. It visualizes dynamic SL/TP levels, evaluates past trade outcomes, and displays win/loss statistics in a clean on-chart panel. Key features include: Buy/Sell signals based on MA crossovers ATR-based SL/TP1/TP2/TP3 levels with visual lines and labels Signal outcome tracking with real-time stat
Weis Wave with Alert MT5
Trade The Volume Waves Single Member P.C.
4.94 (17)
Rental/Lifetime Package Options and Privileges  Rent Monthly Six Months   Yearly/Lifetime Weis Wave with Speed with Alert+Speed Index x x x Manual  x x x Quick Set up Video x x x Blog x x x Lifetime Updates x x x Setup and Training Material x x Discord Access Channel "The SI traders"          x Rectangle Break Alert Tool      x How to trade with it:    http://www.tradethevolumewaves.com   ** If you purchase please contact me to setup your  : Training Room and  complete manual access.  Wei
Introduction to X3 Chart Pattern Scanner X3 Cherart Pattern Scanner is the non-repainting and non-lagging indicator detecting X3 chart patterns including Harmonic pattern, Elliott Wave pattern, X3 patterns, and Japanese Candlestick patterns. Historical patterns match with signal patterns. Hence, you can readily develop the solid trading strategy in your chart. More importantly, this superb pattern scanner can detect the optimal pattern of its kind. In addition, you can switch on and off individu
Recommended TimeFrame >= H1. 100% Non Repainted at any moment.  Use it carefully, only with Trend Direction. Trading Usage: 2 Variants: as Range System or as BreakOut System (Both Only With Trend Direction)::: (Always use StopLoss for minimise Risk); [1] as Range System: (Recommended) in UP TREND:  - BUY in Blue Line , then if price goes down by 50 points (on H1) open Second BUY.   Close in any Profit you wish: TrailingStop(45 points) or Close when Price touches upper Gold Line. in DOWN TREND
WVAP Scalping
Domantas Juodenis
VWAP Scalping Pro – Advanced VWAP & Market Profile System Professional-Grade VWAP + Market Profile Technology for Precision Trading VWAP Scalping Pro is an advanced analytical tool that integrates Volume-Weighted Average Price (VWAP) analysis with professional Market Profile visualization. It provides traders with institutional-style insights into price structure, volume distribution, and session dynamics — ideal for scalping, intraday, and swing trading strategies. Key Features Triple VWAP St
Big Player Range
Thalles Nascimento De Carvalho
5 (3)
BigPlayerRange – MT5 최고의 지표 BigPlayerRange 는 MetaTrader 5에서 미니 인덱스와 미니 달러를 위한 최고의 지표 로 평가받고 있습니다. 이 도구는 주요 기관 투자자들의 전략적 영역을 강조하여 높은 정확도의 기관 기술 분석을 제공합니다. BigPlayerRange 사용법: 이 지표는 매수 구간(녹색선)과 매도 구간(빨간선)을 표시합니다. 가격이 이 구간 밖에서 마감되면 추세 움직임이 예상됩니다. 녹색선 위에서 마감: 강한 매수세와 상승 추세 가능성. 빨간선 아래에서 마감: 매도 압력과 하락 가능성. 범위 내에서 마감: 횡보 시장, 돌파 신호 대기. 주요 혜택: 기관 투자자 영역 매핑: 주요 투자자들의 활동 구간을 식별합니다. 자동 목표 지점 산출: 거래 종료에 적합한 목표 지점을 제공합니다. 풀백 분석: 리스크 관리를 위한 가격 반등 가능성 평가. 활용 방법: BigPlayerRange와 함께 Imba
UZFX {SSS} 스캘핑 스마트 시그널 MT5는 빠르게 움직이는 시장에서 정확한 실시간 신호를 요구하는 스캘퍼, 데이 트레이더, 스윙 트레이더를 위해 설계된 리페인팅 없는 고성능 트레이딩 지표입니다. (UZFX-LABS)에서 개발한 이 지표는 가격 행동 분석, 추세 확인, 스마트 필터링을 결합하여 모든 통화 쌍과 시간대에서 높은 확률의 매수 및 매도 신호를 생성합니다. 주요 기능 스마트 신호 감지 – 강력한 추세 반전 및 지속 패턴을 정밀하게 식별합니다. 다중 시간대 스캘핑 – 모든 시간대에서 완벽하게 작동합니다. 사용자 지정 알림 – 모든 신호에 대해 팝업, 이메일 및 모바일 알림을 받습니다(구성 가능). 명확한 시각적 화살표 – 차트에서 쉽게 식별할 수 있는 파란색(매수) 및 빨간색(매도) 화살표. 신호 강도 조정 – 단기, 중기, 장기 거래에 맞춰 신호 강도 조절 가능. 사용자 친화적 인터페이스 – 재그리기나 지연 없는 깔끔한 차트 표시. 작동 원리 UZFX SSS 지표는
IVISTscalp5
Vadym Zhukovskyi
5 (6)
당신에게 소개하는 iVISTscalp5 지표는 독특하면서도 거래 작업에서 효과적입니다. 이 지표는 시간 데이터를 기반으로 하며 금융 시장의 많은 경험과 깊은 분석의 결과입니다. iVISTscalp5 지표는 수동 거래에 뛰어난 도구입니다. 편리성, 간단함 및 시각화 - 모든 복잡성은 숨겨져 있습니다. 우리는 iVISTscalp5 지표의 설정과 사용을 최대한 단순화했습니다. 이 지표는 MT5 터미널에서 가지고 있는 모든 금융 상품에 적합합니다. 시간 기준으로 작동하는 시간은 4am에서 8pm (UTC+3)입니다. iVISTscalp5 지표 메뉴 (스크린샷 1 참조): History - 표시할 주간 수 계산 dT_min - 시간 설정 간격 선택 (분) TFline - 수평 볼륨 생성 (타임프레임) BARSline - 수평 볼륨 생성 (바 수) TFtrend1 - 매일 채널 생성 (타임프레임) BARStrend1 - 매일 채널 생성 (바 수) TFtrend2 - 주간 채널 생성 (타임프레임
Silver Trade
Metin Erkamoglu
MATADOR SILVER – XAGUSD MT5 M5 Timeframe Scalp Signals MATADOR SILVER is a professional signal and decision-support indicator developed specifically for XAGUSD (Silver) scalping on the M5 timeframe , designed for real market conditions and disciplined execution. This indicator does NOT open, manage, or close trades automatically . It provides structured BUY & SELL signals , intelligent filtering, and alerts, allowing traders to execute trades using their own strategy and risk management rules .
LTL Long Trend Locator
Muhammad Usman Siddique
LTL 장기 추세 탐지기 v2.0 - 전문 추세 거래 지표 LTL 장기 추세 탐지기는 강력하고 지속적인 추세를 식별하여 트레이더가 시장에 진입하고 퇴출할 최적의 시점을 찾는 데 도움을 줍니다. 추세가 시작되고 끝나는 시점에 명확한 신호를 제공하여 올바른 방향으로 적시에 거래할 수 있도록 지원합니다. 강력한 시장 추세를 발견하고 명확한 진입점, 손절매 수준, 목표수익 수준을 통해 거래를 배치할 정확한 위치를 보여줍니다. 주요 기능: 명확한 매수/매도 신호: 시장이 상승 또는 하락할 준비가 되었을 때 화살표 표시 거래 라인 표시: 차트에 모든 수준이 명확히 표시된 완전한 거래 설정을 그립니다 추세 구역: 차트를 강세(녹색) 또는 약세(분홍색) 기간으로 색상 구분 통계 표시: 각 추세가 지속된 바 수와 포인트 수 표시 정보 패널: 현재 추세 상태 및 마지막 신호 시간 표시 알림 시스템: 새로운 신호 발생 시 팝업, 이메일 또는 소리 알림 수신 신호당 한 번만 알림(성가신 반복
Rtc ML Ai Predictor
Muhammad Faisal Sagala
Rtc ML Ai | Predictor CORE MACHINE LEARNING ENGINE Adaptive ML Market Predictor – Multi-Bar Trend & Candle Forecast What This Indicator Does This indicator is a  real-time market prediction engine  designed to analyze price behavior and estimate  future market tendencies . Unlike conventional indicators, this system  does not rely on static parameters or historical curve-fitting , but adapts its internal state dynamically during live market operation. Instead of using static rules, the indic
Hunter Spike
Jaime Humberto Gomez Arias
Hunter Spike This indicator consists of two regression channels calibrated with the current movement of the synthetic index algorithm, for any Deriv or Weltrade broker. Each channel has a signal, a target that alerts us when the price touches them, indicating buys on booms or gains and sells on crashes or pains. -configuration for booms or gains: Channel zone 1 (30) Channel zone 2 (0) -configuration for crashes or pains: Channel zone 1 (100) Channel zone 2 (70) Zones freely configurable by
무료 AUX 지표, EA 지원 및 전체 가이드를 얻으시려면 방문하세요 – https://www.mql5.com/en/blogs/post/763955 트렌드를 포착하세요. 패턴을 읽으세요. 진입 시점을 타이밍하세요. 30초 이내의 3단계! 분석 없이도 쉽게 거래하세요 — 당신의 스마트 어시스턴트가 워크플로우를 단순화해 드립니다. 더 이상 차트 과부하 없음. 스마트 바이어스 감지로 자신감 있게 거래하세요. 모든 통화, 암호화폐, 주식, 금속, 지수 및 모든 시간대와 호환됩니다. 그냥 클릭하고 실행하세요 — 정말 간단합니다. 속도와 명확성을 원하는 바쁜 트레이더에게 이상적입니다. TPTSyncX는 추세, 패턴, 그리고 캔들스틱 트리거 분석을 하나로 통합하여 깨끗하고 지능적인 시각 시스템으로 동기화하는 강력한 올인원 MetaTrader 5 인디케이터입니다. 명확성, 정밀성, 속도를 원하는 트레이더를 위해 설계되었으며, 가격 행동, 구조적 패턴 및 시장 타이밍 도구의 조합을 통해 높은 확
물론입니다. 아래는 제공해주신 텍스트의 한국어 번역입니다: MT4용 천문학 지표 소개: 귀하의 최상급 하늘 트레이딩 동반자 트레이딩 경험을 천체의 높이로 끌어올리기 준비가 되셨나요? MT4용 천문학 지표를 소개합니다. 이 혁신적인 도구는 복잡한 알고리즘의 힘을 활용하여 탁월한 천문학적 통찰과 정밀한 계산을 제공합니다. 정보의 우주를 손에 담다:   천문학적 데이터의 보물함을 드러내는 포괄적인 패널을 살펴보세요. 행성의 지오/헬리오센트릭 좌표, 태양/지구 거리, 크기, 길이, 별자리, 황도 좌표 및 적도 좌표, 심지어 수평 좌표 등 각각이 정밀하게 계산되고 아름답게 제시됩니다. 지표에 의해 생성된 수직선은 시간 값에 해당하여 트레이딩 여정에 우주적인 시각을 부여합니다. 행성 라인과 관계:   수정 가능한 스케일과 각도로 차트를 장식하는 행성 라인의 마법을 경험해보세요. 직관적인 컨트롤 패널을 통해 각 행성의 라인의 가시성을 손쉽게 전환할 수 있습니다. 쥰션이나 섹스타일, 사분각, 삼분
VTrende Pro
Andrii Diachenko
5 (1)
VTrende Pro - MTF indicator for trend trading with a display panel for MT5 *** Videos can be translated into any language using subtitles (video language - Russian) Although the signals of the VTrende Pro indicator can be used as signals of a full-fledged trading system, it is recommended to use them in conjunction with the Bill Williams TS. VTrende Pro is an extended version of the VTrende indicator. Difference between Pro version and VTrende: - Time zones - Signal V - signal 1-2 waves -    S
Prices move for many reasons and these can vary from one operator to another: software, private and institutional traders simultaneously contribute to the formation of the price, making predictive art very difficult. However, there are measurable factors that bind the price to an underlying trend in line with the physical reality that the financial asset represents: these are the macroeconomic indicators. Large investors use this information wisely to set their strategies. Understanding these m
Max Ribbon Mt5
Stefano Frisetti
WARNING: This indicator is distributed EXCLUSIVELY on MQL5.com MT4 version:   https://www.mql5.com/it/market/product/160363 MT5 version:   https://www.mql5.com/it/market/product/160410 ============================================================================================= MAX RIBBON ver 1.00 The indicator that shows you the TREND clearly and unambiguously! ============================================================================================= DESCRIPTION MAX RIBBON is an advanced tre
Matreshka
Dimitr Trifonov
5 (2)
Matreshka self-testing and self-optimizing indicator: 1. Is an interpretation of the Elliott Wave Analysis Theory. 2. Based on the principle of the indicator type ZigZag, and the waves are based on the principle of interpretation of the theory of DeMark. 3. Filters waves in length and height. 4. Draws up to six levels of ZigZag at the same time, tracking waves of different orders. 5. Marks Pulsed and Recoil Waves. 6. Draws arrows to open positions 7. Draws three channels. 8. Notes support and re
The iChannels
BeeXXI Corporation
5 (2)
Ultra-fast recognition of parabolic channels (as well as linear, horizontal and wavy channels) throughout the depth of history, creating a hierarchy of channels. Required setting: Max bars in chart: Unlimited This indicator is designed primarily for algorithmic trading, but can also be used for manual trading.  This indicator will have a very active evolution in the near future and detailed descriptions on how to apply to create robots
TREND HARMONY MT5 – Multi Timeframe Trend and Phase and Pullback Level Visualizer indicator for Metatrader5 The TREND HARMONY indicator automates deep trend analysis and generates visualizations for you. Take control of your trades by eliminating uncertainty! Revolutionize your trading experience with precision and insight through the TREND HARMONY Multi Timeframe indicator – your ultimate MT5 trend visualization indicator. [  Features and Manual   | MT4 version |   All Products   ] Are you tir
제작자의 제품 더 보기
Big Player Range
Thalles Nascimento De Carvalho
5 (3)
BigPlayerRange – MT5 최고의 지표 BigPlayerRange 는 MetaTrader 5에서 미니 인덱스와 미니 달러를 위한 최고의 지표 로 평가받고 있습니다. 이 도구는 주요 기관 투자자들의 전략적 영역을 강조하여 높은 정확도의 기관 기술 분석을 제공합니다. BigPlayerRange 사용법: 이 지표는 매수 구간(녹색선)과 매도 구간(빨간선)을 표시합니다. 가격이 이 구간 밖에서 마감되면 추세 움직임이 예상됩니다. 녹색선 위에서 마감: 강한 매수세와 상승 추세 가능성. 빨간선 아래에서 마감: 매도 압력과 하락 가능성. 범위 내에서 마감: 횡보 시장, 돌파 신호 대기. 주요 혜택: 기관 투자자 영역 매핑: 주요 투자자들의 활동 구간을 식별합니다. 자동 목표 지점 산출: 거래 종료에 적합한 목표 지점을 제공합니다. 풀백 분석: 리스크 관리를 위한 가격 반등 가능성 평가. 활용 방법: BigPlayerRange와 함께 Imba
Box Weis Wave
Thalles Nascimento De Carvalho
5 (1)
Weis Wave Box 와 함께 분석을 업그레이드하세요! 정확하고 명확한 트레이딩 을 원하신다면, Weis Wave Box 가 이상적인 도구입니다. 이 고급 볼륨 웨이브 지표 는 시장에서 노력과 결과 간의 역학을 명확하게 시각화하여, 주문 흐름과 볼륨 분석을 사용하는 트레이더에게 필수적입니다. 주요 기능: 사용자 지정 가능한 볼륨 웨이브 – 전략에 맞게 틱 단위로 조절 가능. 조정 가능한 히스토리 – 특정 기간을 더 정확하게 분석. 실제 거래량 vs 틱 수 – 시장에 미치는 실제 영향 이해. 시각적 에너지 박스 – 시장의 높은 노력과 낮은 움직임 영역 확인. ️ 5가지 스윙 유형 – totalVol, length, width, barDVol, lengthDVol 기반 맞춤 설정 가능. 실제 혜택: 볼륨 로직에 대한 시각적 명확성 주도하는 매수 또는 매도 세력 식별 잠재적 반전 또는 지속 신호 제공 관련 지표 Big Player Range – 기
VWAP FanMaster
Thalles Nascimento De Carvalho
3.5 (2)
VWAP FanMaster: 정확한 풀백 전략을 마스터하자! VWAP FanMaster 는 정확한 진입점 과 효율적인 풀백 을 찾는 트레이더를 위한 궁극적인 지표입니다. **VWAP(거래량 가중 평균 가격)**과 피보나치 팬 라인 을 결합하여 시장에서 중요한 가격 영역을 명확하게 표시합니다. 주요 기능 간단하고 강력함 : 수직선을 이동시키기만 하면 자동으로 VWAP 과 피보나치 팬 라인 이 그려집니다. 스마트한 거래 전략 : 가격이 그려진 영역으로 되돌아오는 것을 기다린 후, 완벽한 풀백 을 지원 및 저항 레벨에서 포착하세요. 고급 시각적 도구 : 가격의 융합 영역 을 즉시 찾아서 신속하고 정확한 거래 결정을 내리세요. VWAP FanMaster를 선택해야 하는 이유 초보자도 쉽게 사용할 수 있음 . 두 가지 강력한 분석 도구 를 결합하여 거래 정확도를 높입니다. 위험 관리 개선 을 위한 명확하고 일관된 가격 예측 제공. VWAP F
FREE
Tape Hunter
Thalles Nascimento De Carvalho
Tape Hunter – MT5에서 노력과 결과를 확인하는 레이더 Tape Hunter는 MetaTrader 5에서 가격 뒤에 숨겨진 진짜 움직임을 보고자 하는 트레이더를 위한 최고의 인디케이터입니다. POC(Point of Control)를 기반으로 매수와 매도의 공격적인 거래량을 명확하고 직관적으로 보여주며, 각 캔들에서 시장의 노력과 실제 결과를 시각화할 수 있습니다. ️ 왜 중요한가요? 모든 거래량이 가격을 움직이는 것은 아닙니다! Tape Hunter는 노력(공격적인 거래량)이 실제로 가격을 움직이고 있는지 강조하며, 다음을 파악하는 데 도움을 줍니다: 진짜 공격과 함정이 어디에 있는지 시장이 흡수되고 있는지, 아니면 밀리고 있는지 지배적인 거래량과 가격 방향의 일치 여부 Tape Hunter를 사용하면 프로페셔널한 테이프 리딩 관점을 얻어 더 정확한 진입과 청산 결정을 내릴 수 있습니다. 관련 인디케이터 – 플로우 분석 강화하기 보다 효율적인 트레
Swing Point Volume
Thalles Nascimento De Carvalho
Swing Point Volume, the indicator that signals weakness and strength at the tops and bottoms. This indicador can be for used the Wyckoff Method. Information provided; - Swing on customized ticks. - Volume and points in each balance sheet. - Percentage of Displacement. - Sound alert option on top and bottom breaks. - Volume in ticks and Real Volume. - Volume HL (extreme) or (opening and closing) - Customized volume shapes.
Volume Flow Binance
Thalles Nascimento De Carvalho
Volume Flow Binance! 당신이 선호하는 암호화폐의 times and trades 데이터에 접근하고, 거래량 흐름과 가격 변동 분석에 대한 세부 정보를 얻을 수 있다고 상상해 본 적이 있나요? 심지어 브로커가 거래 기록에 대한 완전한 접근을 제공하지 않더라도 말이죠? Volume Flow Binance 로 이제 그것이 현실이 됩니다! 이 MQL5 스크립트는 실시간 시장 동향에 대한 상세한 뷰를 원하는 암호화폐 트레이더를 위해 설계되었습니다. 주요 특징: 스크립트 메뉴에서 사용 가능한 모든 암호화폐의 times and trades 데이터에 직접 접근. 세계적인 거래소인 Binance에서 실시간 데이터 업데이트. 가격 변동을 예측하고 거래량 흐름을 정확하게 분석. Times and Sales Crypto 인디케이터 와의 통합으로 시장 분석을 다음 수준으로 향상. 왜 Volume Flow Binance를 선택해야 할까요? 실시간으로 매
FREE
Book Data Binance
Thalles Nascimento De Carvalho
Book Data Binance! 좋아하는 암호화폐의 오더북에 접근하여 가격, 거래량, 불균형 분석의 세부 정보를 확인할 수 있다고 상상해 보세요. 거래소에서 DOM에 대한 접근을 제공하지 않더라도 말이죠. Book Data Binance와 함께라면 이제 그 꿈이 현실이 됩니다! 이 MQL5 스크립트는 시장의 역학을 깊이 이해하고자 하는 암호화폐 트레이더를 위해 특별히 개발되었습니다. 주요 기능: 스크립트 메뉴에서 사용할 수 있는 모든 암호화폐의 오더북에 직접 접근. 세계 최고의 거래소 중 하나인 Binance에서 제공하는 실시간 데이터 업데이트. 오더북의 불균형을 정확하게 분석하여 가격 변동을 식별하고 예측할 수 있습니다. Imbalance DOM Crypto 지표 와 통합되어 시장 분석을 다음 단계로 끌어올립니다. 왜 Book Data Binance를 선택해야 할까요? 각 가격 수준에서 구매자와 판매자의 행동을 이해하고자 하는 모든 분들에
FREE
Cumulative Volume Bands
Thalles Nascimento De Carvalho
CVB Cumulative Volume Bands: 누적 거래량으로 트레이드를 강화하세요! CVB Cumulative Volume Bands 는 누적 거래량에 기반한 정확한 신호를 찾는 트레이더를 위해 설계된 고급 지표입니다. 이 지표는 누적 거래량 밴드를 사용하여 시장의 매수 및 매도 압력을 명확하게 읽고, 반전 및 강력한 가격 변동을 식별하는 데 도움을 줍니다. Cumulative Volume Bands for MT5 ! 주요 특징: 누적 거래량 분석 : 거래량을 기반으로 주요 압력 지점을 감지합니다. 명확한 진입/퇴출 신호 : 실시간으로 기회를 포착하세요. 쉬운 해석 : 사용자 친화적인 인터페이스와 간단한 시각적 표현. 모든 자산 및 시간 프레임에 적합 : 모든 시장에서 언제든지 사용 가능합니다. CVB Cumulative Volume Bands 로 한 발 앞서 나가며 자신감을 가지고 트레이딩 결정을 개선하세요! 피드백
Footprint Hunter
Thalles Nascimento De Carvalho
Footprint Hunter – MT4에서 노력과 결과를 확인하는 레이더 Tape Hunter는 MetaTrader 4에서 가격 뒤에 숨겨진 진짜 움직임을 보고자 하는 트레이더를 위한 최고의 인디케이터입니다. POC(Point of Control)를 기반으로 매수와 매도의 공격적인 거래량을 명확하고 직관적으로 보여주며, 각 캔들에서 시장의 노력과 실제 결과를 시각화할 수 있습니다. ️ 왜 중요한가요? 모든 거래량이 가격을 움직이는 것은 아닙니다! Tape Hunter는 노력(공격적인 거래량)이 실제로 가격을 움직이고 있는지 강조하며, 다음을 파악하는 데 도움을 줍니다: 진짜 공격과 함정이 어디에 있는지 시장이 흡수되고 있는지, 아니면 밀리고 있는지 지배적인 거래량과 가격 방향의 일치 여부 Tape Hunter를 사용하면 프로페셔널한 테이프 리딩 관점을 얻어 더 정확한 진입과 청산 결정을 내릴 수 있습니다. 관련 인디케이터 – 플로우 분석 강화하기 보다 효율
Atr Projection
Thalles Nascimento De Carvalho
ATR 프로젝션 지표는 금융 시장에서 가격 움직임의 잠재적 한계에 대한 정확한 통찰을 제공하도록 설계된 강력한 도구로, 기술적 분석에서 두드러지고 있습니다. 유연한 접근 방식으로 사용자는 각 거래 자산의 특정한 요구에 맞게 분석 메트릭스를 직관적으로 사용자 정의할 수 있습니다. 사용자 정의 가능한 운영: 기본 설정으로 ATR 프로젝션은 최근 100개의 캔들의 평균 중 30%를 고려하여 작동합니다. 이러한 유연성은 사용자가 각 자산의 특징과 선호도에 따라 메트릭스를 조정할 수 있도록 하여 더 개인화된 분석을 제공합니다. 30%와 100개 캔들의 선택에 대한 논리: 선택된 백분율과 캔들 수의 신중한 선택은 최근의 중요한 움직임을 포착하여 더 정확한 예측을 제공하려는 것입니다. 이 전략적 접근은 가격이 이동할 가능성이 높은 지역을 강조하여 트레이더에게 더 잘 통찰력을 제공합니다. ATR 프로젝션의 이점: 1. 사용자 정의 가능한 기술적 정확성: 사용자는 각 거래 자산의 특정 조
Long Short Pro
Thalles Nascimento De Carvalho
Long & Short 지표 - Pro 버전: 무한한 시장 분석 잠재력을 열어보세요! 모든 자산에 제한 없이 사용 Long & Short 지표의 Pro 버전은 모든 금융 자산에서 완전한 자유를 제공합니다. 이제 제한 없이 동일한 지표를 모든 선호 자산에 적용할 수 있습니다! 제한 없음 지표의 모든 기능을 제한 없이 사용하세요. Pro 버전은 완전하고 무제한의 경험을 제공하며, 모든 시장 기회를 최대한 활용할 수 있게 해줍니다. Pro 버전의 특징 무제한 접근 : 모든 금융 자산에서 지표를 사용하고 그 잠재력을 최대한 발휘하세요. 고급 정밀도 : 상세한 분석과 명확한 신호를 통해 정보에 기반한 안전한 결정을 내리세요. 완전한 유연성 : 자산이나 전략에 관계없이 거래 요구에 맞게 지표를 조정하세요. 중요한 기회에 대한 알림 받기 알림을 활성화하여 중요한 수준을 주의 깊게 모니터링하고 시장 기회에서 항상 앞서 나가세요. EA 구축을 위한 버퍼 파라미터
AI Channel
Thalles Nascimento De Carvalho
AI Channel | MT5용 인공지능 기반 가격 채널 지표 AI Channel: 진보된 기술 분석을 위한 인공지능 기반 도구 AI Channel 은 금융 시장에서 가격 채널을 분석하기 위해 인공지능 을 활용하는 강력한 도구입니다. 이 섹션에서는 이 혁신적인 지표가 투자자와 트레이더가 더 정보에 기반한 전략적 결정을 내리는 데 어떻게 도움을 주는지 살펴봅니다. AI Channel이란? AI Channel 은 고급 인공지능 알고리즘을 기반으로 개발된 지표입니다. 과거 가격 데이터를 사용하여 거래 채널을 식별하고 차트에서 중요한 지지선과 저항선을 강조 표시합니다. 이 분석을 바탕으로 시장 진입 및 청산의 유용한 인사이트를 제공합니다. ️ AI Channel 작동 원리 AI Channel은 인공지능을 가격 채널에 적용하여 자산의 추세, 패턴 및 과거 움직임을 분석합니다. 이 지표는 시장 변화에 따라 동적으로 적응하며 다양한 시간대와 금융 상품에 적용 가능합
Didi Index Volume
Thalles Nascimento De Carvalho
디디 지수 볼륨(Didi Index Volume)을 소개합니다. 이는 브라질 트레이더 오디르 아기아르(Odir Aguiar)이 개발한 기술적 분석 지표로, 금융 시장에서 기회를 식별하는 고급이고 강력한 접근 방식으로 주목받고 있습니다. 다양한 플랫폼에서 이용 가능한 디디 지수 볼륨은 정확한 통찰력과 가치 있는 정보를 찾는 트레이더들에게 필수적인 도구가 되었습니다. 이 지표는 오디르 아기아르가 개발한 유명한 디디 지수(Didi Index)와 거래량의 지능적인 활용을 결합합니다. 이 조합은 가격 동작과 거래량의 상호작용을 더 깊게 분석하여 자산의 움직임에 대한 독특한 시각을 제공합니다. 정교한 알고리즘과 가중 평균 계산을 통해 디디 지수 볼륨은 거래량을 기반으로 가격 변동을 예측할 수 있습니다. 이 기능은 신흥 트렌드, 시장 반전 및 적시적인 진입 및 청산 시점을 파악하는 데 매우 중요합니다. 디디 지수 볼륨을 사용하면 정확한 시장 해석을 돕고 허무맹랑한 결정을 피할 수 있는 객관
TimeChannel
Thalles Nascimento De Carvalho
The "Timechannel" is a powerful technical analysis tool designed specifically for traders who want to gain deeper and more accurate insights into price movements across multiple timeframes (multi-timeframe). This indicator is an essential addition to the toolbox of any serious trader seeking to make informed and data-driven trading decisions. Key Features: Advanced Multi-Timeframe Analysis : Timechannel allows traders to analyze price movements on different timeframes simultaneously. This is cr
Master OBV
Thalles Nascimento De Carvalho
MasterOBV: 시장 트렌드를 정확하게 파악하세요! MasterOBV 는 거래량 , 긍정적 상관관계 및 **이동 평균선(MA)**을 결합한 기술 분석 지표 로, 금융 시장에서 트렌드를 식별하는 능력을 향상시킵니다. 주요 기능: 스마트 거래량: 거래량을 분석하여 트렌드 강도의 중요한 변화를 식별합니다. 긍정적 상관관계: 상관된 자산을 포함하여 보다 넓고 정확한 시각을 제공하며, 쌍의 거래량을 기반으로 가격 이동 잠재력을 강화합니다. 비주얼 채널: 비주얼 채널을 사용하여 트렌드의 지속성과 반전 가능성을 명확하고 정확하게 평가하며 직관적인 시각 분석을 제공합니다. 스무딩 이동 평균선: MA는 가격의 변동을 부드럽게 하여 기본 트렌드 방향을 더 쉽게 식별할 수 있게 합니다. 왜 MasterOBV를 선택해야 하는가? 결정에 대한 자신감: 여러 요소를 통합하여 신뢰를 가지고 진입 및 퇴출 결정을 내릴 수 있도록 도와줍니다. 종합 분석: 가격뿐만
VolaMetrics VSA
Thalles Nascimento De Carvalho
VolaMetrics VSA | 기술 분석의 강력한 동반자 VolaMetrics VSA 는 Volume Spread Analysis (VSA) 방법론과 자세한 거래량 분석 을 결합한 기술 분석 지표입니다. 중요한 가격 변동 을 식별 하고 추적 하기 위해 설계된 이 도구는 거래량 과 가격 스프레드 의 상호작용을 활용하여 트레이딩 결정에 도움이 되는 귀중한 통찰을 제공합니다. Volume Spread Analysis (VSA)의 기초 **Volume Spread Analysis (VSA)**는 기술 분석에서 존경받는 방법으로, 거래량 , 가격 스프레드 및 종가 간의 관계를 특정 기간 내에 이해하는 데 중점을 둡니다. 가장 정보가 풍부한 운영자 ( 스마트 머니 )가 가격 움직임에 영향을 미친다는 개념에 기반하여, VSA는 축적 또는 분배 신호 를 식별하고 가격의 중요한 변화를 예측합니다. VolaMetrics VSA의 작동 원리 ️ VolaMetrics VSA 는 전통적인 V
SwingVolumePro
Thalles Nascimento De Carvalho
개요 SwingVolumePro 는 다양한 금융 자산에 적용할 수 있도록 설계된 고급 다목적 지표입니다. 엄격한 거래량과 가격 분석을 기반으로 개발되었으며, 모든 수준의 트레이더가 고품질 데이터에 기반하여 정보에 입각한 결정을 내릴 수 있도록 명확하고 정확한 신호를 제공합니다. SwingVolumePro.PDF 주요 특징 다재다능성: SwingVolumePro는 주식, 외환, 암호화폐 등 다양한 자산에 적용할 수 있습니다. 스캘핑에서 장기 포지션까지 다양한 거래 전략에 적합합니다. 정확하고 신뢰할 수 있는 신호: SwingVolumePro는 가격 흡수 패턴과 시장 공격을 식별하기 위해 복잡한 기술을 사용하여 높은 정확도의 신호를 제공합니다. 이러한 신호는 명확하게 표시되어 신속하고 효과적인 의사 결정을 돕습니다. 고급 거래량 및 가격 분석: 이 지표는 거래량과 가격 간의 상호 작용을 상세히 분석하여 노력과 결과 간의 불일치를 감지하고, 잠재적인 시장 움
CVD SmoothFlow Pro
Thalles Nascimento De Carvalho
CVD SmoothFlow Pro - 모든 자산에 대한 무제한 볼륨 분석! CVD SmoothFlow Pro 는 정밀하고 무제한의 볼륨 분석을 원하는 트레이더를 위한 최적의 솔루션입니다. Cumulative Volume Delta (CVD) 계산과 고급 노이즈 필터링을 활용하여, Pro 버전은 모든 금융 자산 거래에 필요한 유연성과 정확성을 제공합니다. CVD SmoothFlow Pro가 제공하는 기능: 명확한 분석 : 시장 노이즈를 필터링하고 모든 금융 자산에서 중요한 볼륨 변동을 강조합니다. ️ 정확한 계산 : 매수와 매도 차이를 모니터링하여 외환, 지수, 암호화폐 등 자산의 볼륨 행동을 상세히 제공합니다. 직관적인 인터페이스 : 데이터가 명확하게 제시되어 분석이 쉽고 효율적입니다. 트렌드 식별 : 시장 트렌드를 자신 있게 식별하여 정보에 기반한 결정을 지원합니다. 실용적인 적용: 모든 자산의 실시간 매수자와 매도자 균형을 모니터링합니다. 볼륨을 기반
Cumulative Vol Bands
Thalles Nascimento De Carvalho
CVB Cumulative Volume Bands: 누적 거래량으로 트레이드를 강화하세요! CVB Cumulative Volume Bands 는 누적 거래량에 기반한 정확한 신호를 찾는 트레이더를 위해 설계된 고급 지표입니다. 이 지표는 누적 거래량 밴드를 사용하여 시장의 매수 및 매도 압력을 명확하게 읽고, 반전 및 강력한 가격 변동을 식별하는 데 도움을 줍니다. 주요 특징: 누적 거래량 분석 : 거래량을 기반으로 주요 압력 지점을 감지합니다. 명확한 진입/퇴출 신호 : 실시간으로 기회를 포착하세요. 쉬운 해석 : 사용자 친화적인 인터페이스와 간단한 시각적 표현. 모든 자산 및 시간 프레임에 적합 : 모든 시장에서 언제든지 사용 가능합니다. CVB Cumulative Volume Bands 로 한 발 앞서 나가며 자신감을 가지고 트레이딩 결정을 개선하세요! 피드백을 남기시고 개선에 도움을 주세요!
ZigWave Oscillator
Thalles Nascimento De Carvalho
ZigWave Oscillator: 오실레이터와 ZigZag로 거래를 강화하세요! ZigWave Oscillator는 금융 시장 분석에서 정확성과 명확성을 추구하는 트레이더를 위한 완벽한 도구입니다. 이 지표는 오실레이터의 강점과 ZigZag의 시각적 단순성을 결합하여 최고의 매수 및 매도 기회를 신속하고 효율적으로 식별할 수 있도록 도와줍니다. ZigWave Oscillator를 선택해야 하는 이유 정밀한 오실레이터 분석 : RSI, Williams %R 또는 CCI를 통합하여 시장의 주요 움직임을 포착합니다. 동적 ZigZag와 세밀한 조정 : ZigZag 스윙은 오실레이터의 과매수 및 과매도 영역에서 세밀하게 조정되어 반전 포인트를 명확히 강조합니다. 완전한 커스터마이즈 ️: 오실레이터와 ZigZag의 설정을 조정하여 자신의 전략에 맞게 최적화할 수 있습니다. 직관적이고 사용하기 쉬운 디자인 세련되고 사용자 정의 가능한 시각적 레이아웃으로 Zig
Times and Sales Pro
Thalles Nascimento De Carvalho
Times and Sales Pro: 거래 흐름의 불균형으로 거래를 강화하세요 작은 가격 변동의 기회 Times and Sales Pro 는 Times and Trades 를 통해 주문 흐름을 운영하는 분석가들에게 필수적인 도구입니다. 스캘퍼에게 이상적이며, 높은 정확도로 작은 가격 변동을 활용하고자 하는 분들을 위해 설계되었습니다. 고급 계산을 통해 이 지표는 거래의 불균형을 식별하여 빠른 진입 및 퇴출을 위한 귀중한 신호를 제공합니다. 중요: MT5에서의 Times and Trades 이용 가능성 Times and Sales Pro 를 사용하기 전에 브로커가 MT5에서 Times and Trades 에 대한 접근을 제공하는지 확인하세요. 이 지표는 실시간으로 정확한 계산을 생성하기 위해 이 데이터에 의존하며, MT5는 거래 이력을 저장하지 않습니다. 따라서 이 지표는 실시간에서만 작동하며, 시장에서 실행된 거래에 대한 즉각적인 통찰을 제공합니다. Ti
Mini Indice Composition
Thalles Nascimento De Carvalho
Mini Índice Composition: A Revolução na Análise do Mini Índice! O Mini Índice Composition é um indicador inovador que monitora em tempo real as principais ações que compõem o mini índice, trazendo uma visão quantitativa poderosa sobre o fluxo de ordens do mercado! Como Funciona? Diferente de outros indicadores que utilizam apenas dados históricos, o Mini Índice Composition faz uma leitura ao vivo das ordens que entram e saem das ações, pesando o impacto direto no mini índice. Com
Radar DI
Thalles Nascimento De Carvalho
Radar DI – Indicador de Taxa de Juros para Mini Índice e Mini Dólar com Exportação CSV e Integração IA Radar DI é um indicador especializado que transforma as variações da taxa de juros DI (Depósitos Interfinanceiros) em sinais operacionais estratégicos para os ativos mini índice (WIN) e mini dólar (WDO) . NOVA FUNCIONALIDADE: Exportação CSV + Integração com IA Agora o Radar DI permite exportar todos os dados em formato CSV , incluindo: Variações dos DIs Variação do Mini Índice (WIN)
LSTM Library
Thalles Nascimento De Carvalho
LSTM Library - MetaTrader 5용 고급 신경망 알고리즘 트레이딩을 위한 전문 신경망 라이브러리 LSTM Library는 MQL5 트레이딩 전략에 순환 신경망의 힘을 가져다줍니다. 이 전문적인 구현에는 일반적으로 특수 기계 학습 프레임워크에서만 볼 수 있는 고급 기능을 갖춘 LSTM, BiLSTM 및 GRU 네트워크가 포함되어 있습니다. "트레이딩을 위한 기계 학습의 성공 비결은 적절한 데이터 처리에 있습니다. 쓰레기를 넣으면 쓰레기가 나옵니다 – 예측의 품질은 절대 훈련 데이터의 품질을 넘을 수 없습니다." — 마르코스 로페즈 데 프라도 박사, Advances in Financial Machine Learning 주요 기능 LSTM, BiLSTM 및 GRU의 완전한 구현 더 나은 일반화를 위한 재귀 드롭아웃 다양한 최적화 알고리즘(Adam, AdamW, RAdam) 고급 정규화 기술 포괄적인 지표 평가 시스템 훈련 진행 시각화 클래스 가중치를 통한 불균형 데이터 지
Cvd Divergence
Thalles Nascimento De Carvalho
CVD Divergence – 전문적인 주문 흐름 및 다이버전스 분석 CVD Divergence는 가격과 Cumulative Delta Volume(CVD) 사이의 신뢰할 수 있는 다이버전스를 감지하기 위해 개발된 기술적 지표입니다. 실제 주문 흐름이 가격 움직임을 확인하지 않을 때를 정확하게 포착하여, 잠재적 추세 전환, 매수·매도 세력의 소진, 기관의 시장 조작 가능성을 보여줍니다. 이 지표는 공격적인 거래량 분석과 가격 구조 해석을 결합해 명확하고 객관적이며 빠른 신호를 제공합니다. 지표 기능 CVD Divergence는 누적 델타 거래량을 사용하여 주문 흐름의 방향과 가격 방향을 비교합니다. 두 값이 크게 괴리될 경우 차트에 시각적 표시를 남기고 다이버전스 방향을 명확하게 보여줍니다. 다음과 같은 상황을 감지합니다: 강세 다이버전스 (가격이 하락하지만 CVD가 상승할 때) 약세 다이버전스 (가격이 상승하지만 CVD가 하락할 때) 매수·매도 세력의 힘 고갈 기관 주문 불균형으로
필터:
epadilha
734
epadilha 2024.10.31 14:50 
 

talles parabenizando vc pelos brilhantes endicadores , estão me ajudando demais tres dias ja e olha não fico sem eles mais.

Thalles Nascimento De Carvalho
8458
개발자의 답변 Thalles Nascimento De Carvalho 2024.10.31 15:00
Obrigado!🙏
리뷰 답변