PTS Divergence Sell Finder V2

The PTS Divergence Finder Sell Indicator by Roger Medcalf  -  Precision Trading Systems.


This indicator only give Bearish - Sell Indications.

First and foremost, I have been asked many times why I did not provide a sell divergence indicator while happily providing a buy signal divergence finder for many years.

I gave the answer that sell divergences are less reliable than the buy divergences, which is still true.

Some solutions to change this were found, not by giving in to peer pressure or by modification of this indicator which I made more than fifteen years ago, but by changing the default settings to be more strict.


How does the PTS Divergence Finder Sell Indicator work?


The PTS Divergence Finder Sell Indicator accurately measures the number of divergences which have occurred in Demand Index, which is a volume based

indicator. As MT4 provided tick volume rather than trade volume, the swings occurring in the underlying Demand Index indicator as about 10 times smaller so the difference input has to be reduced as stated below.

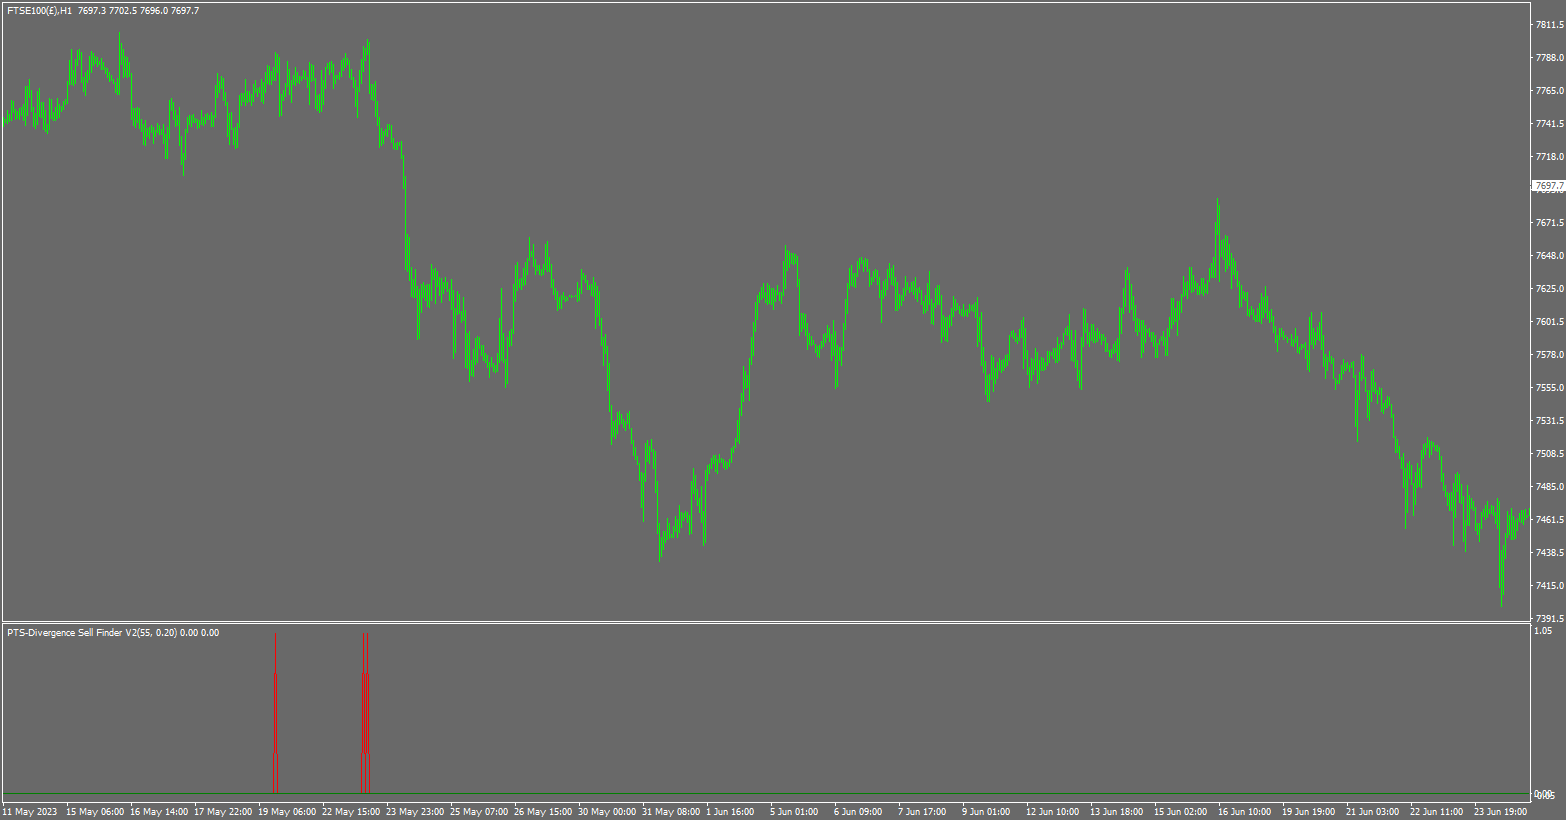
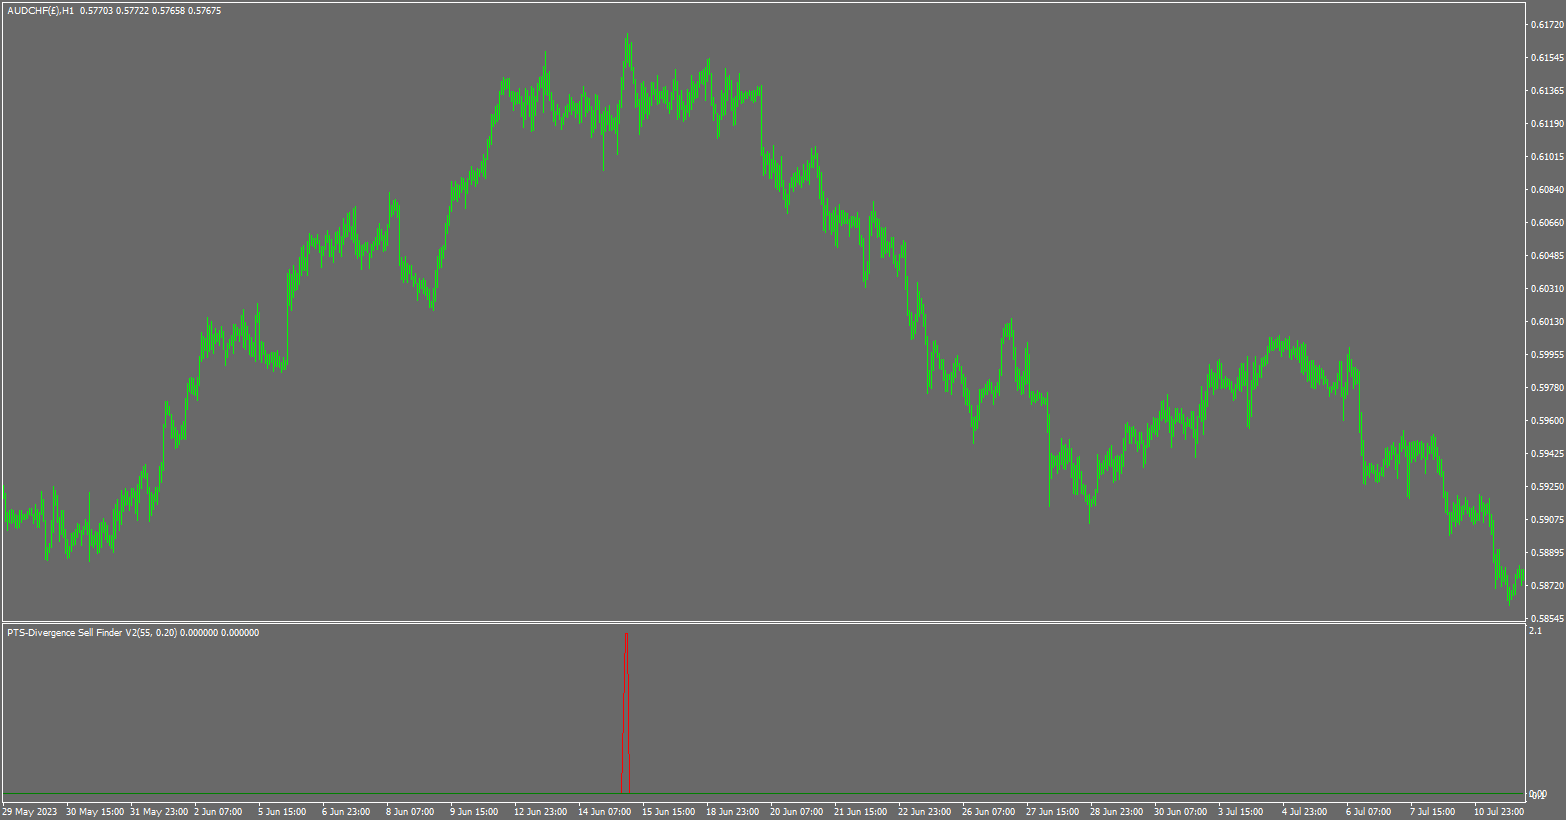
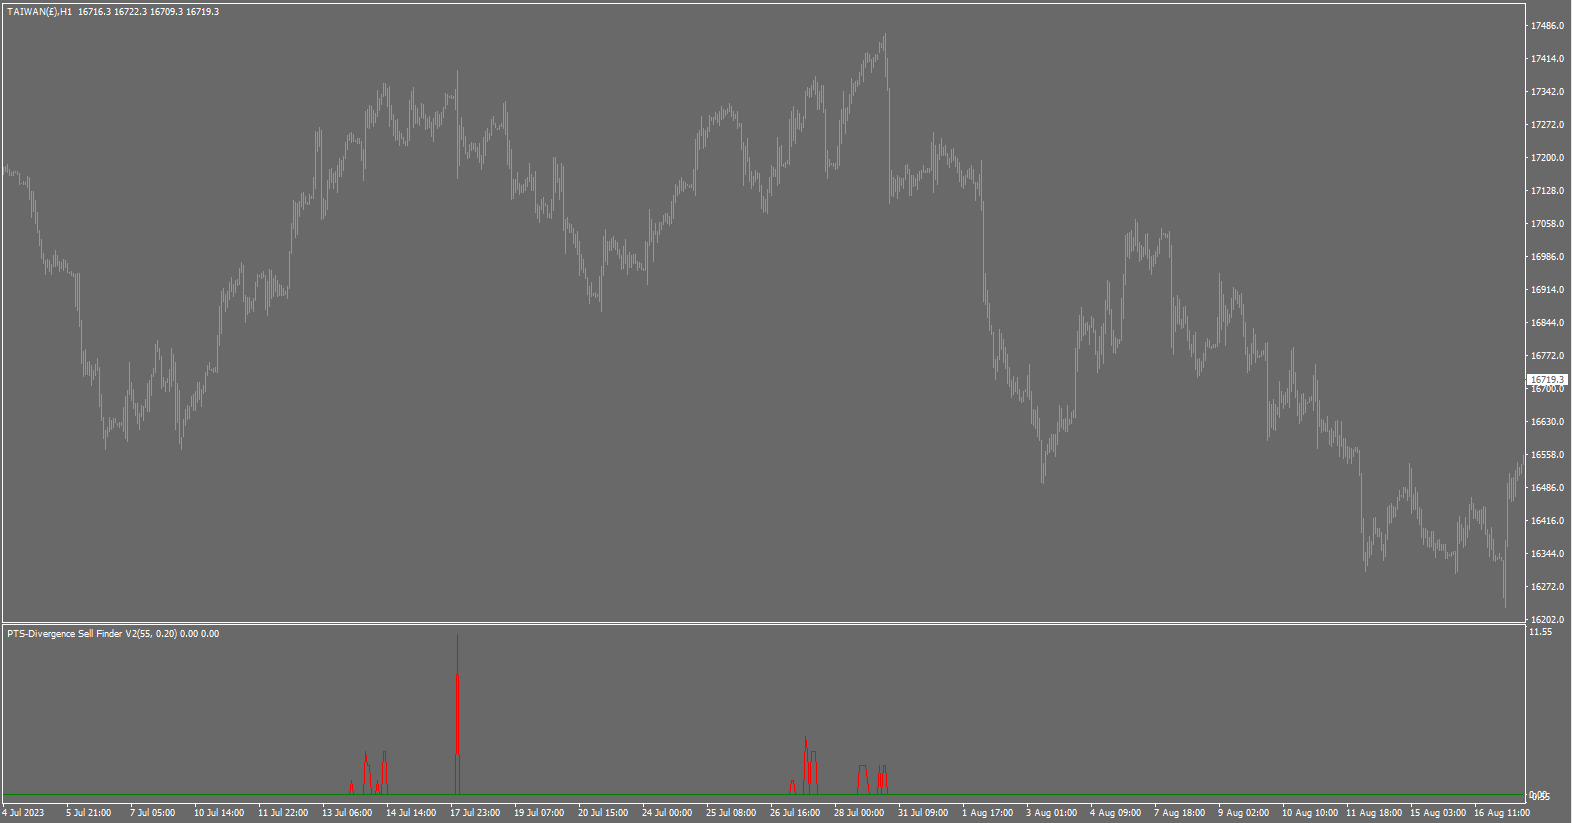
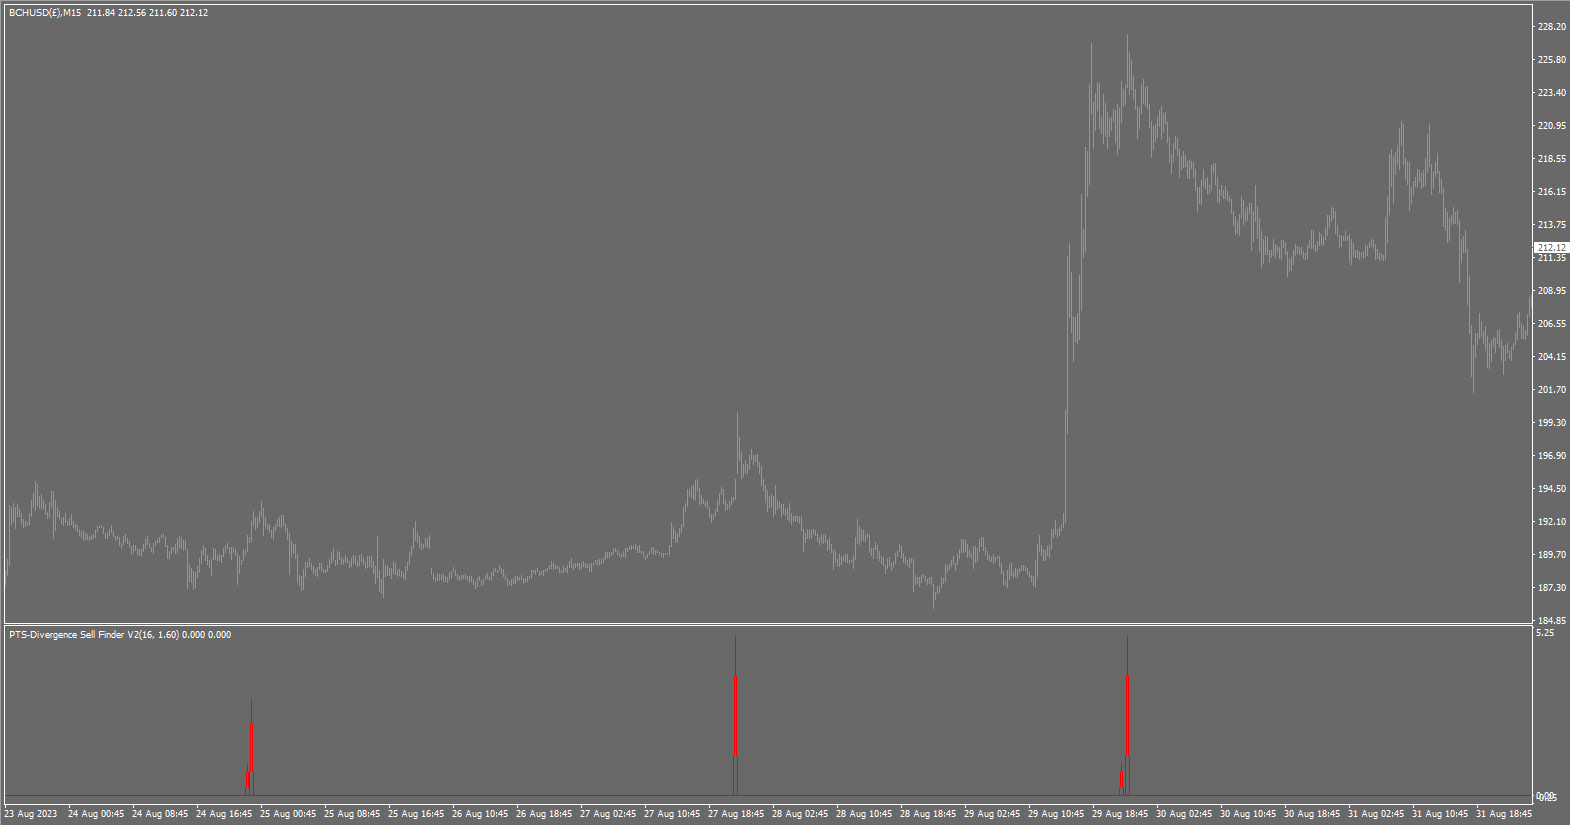
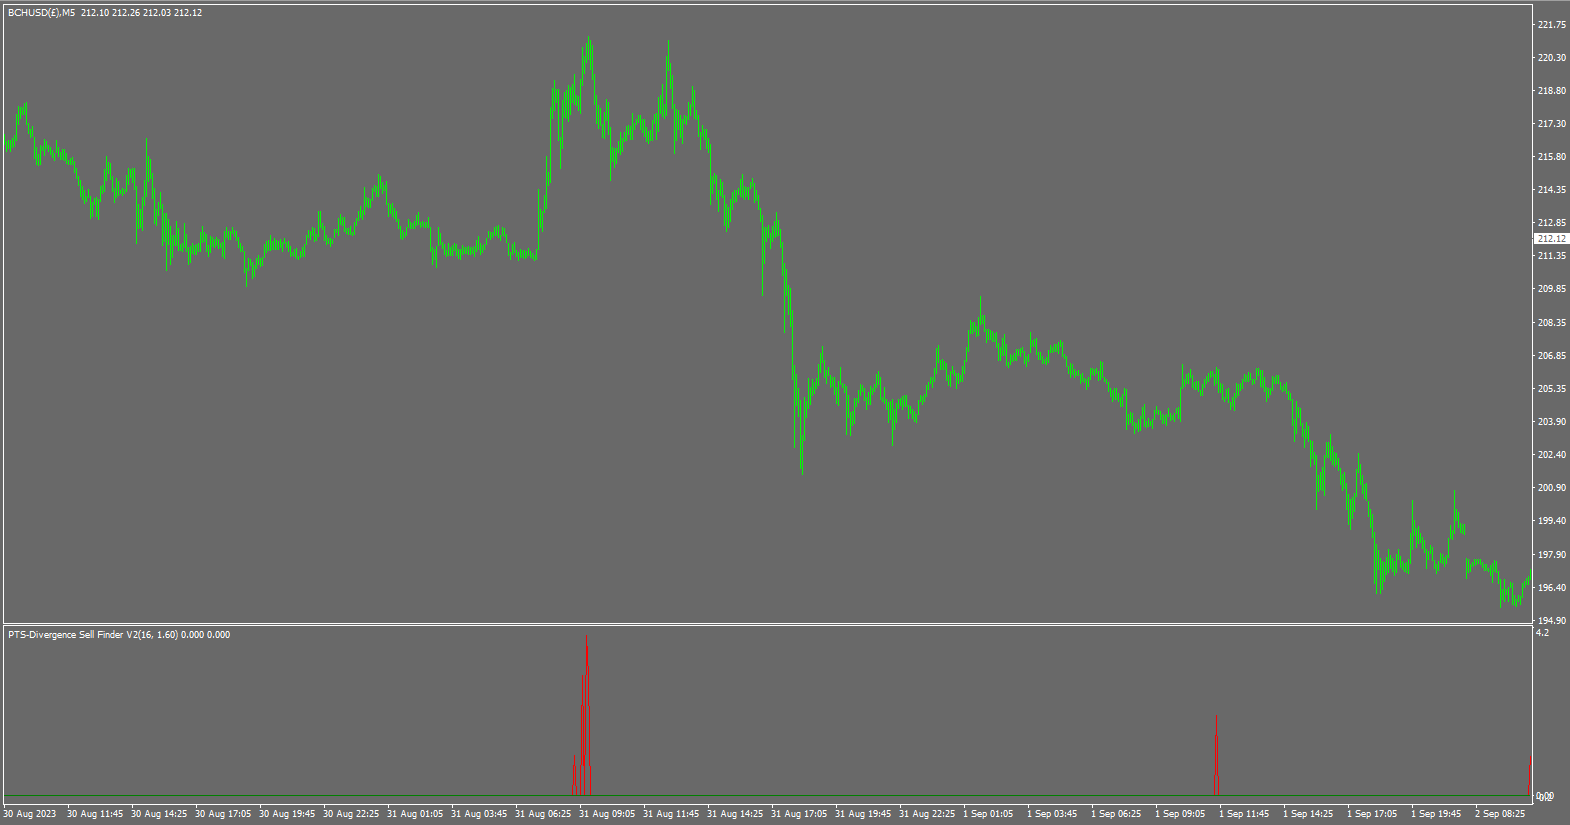
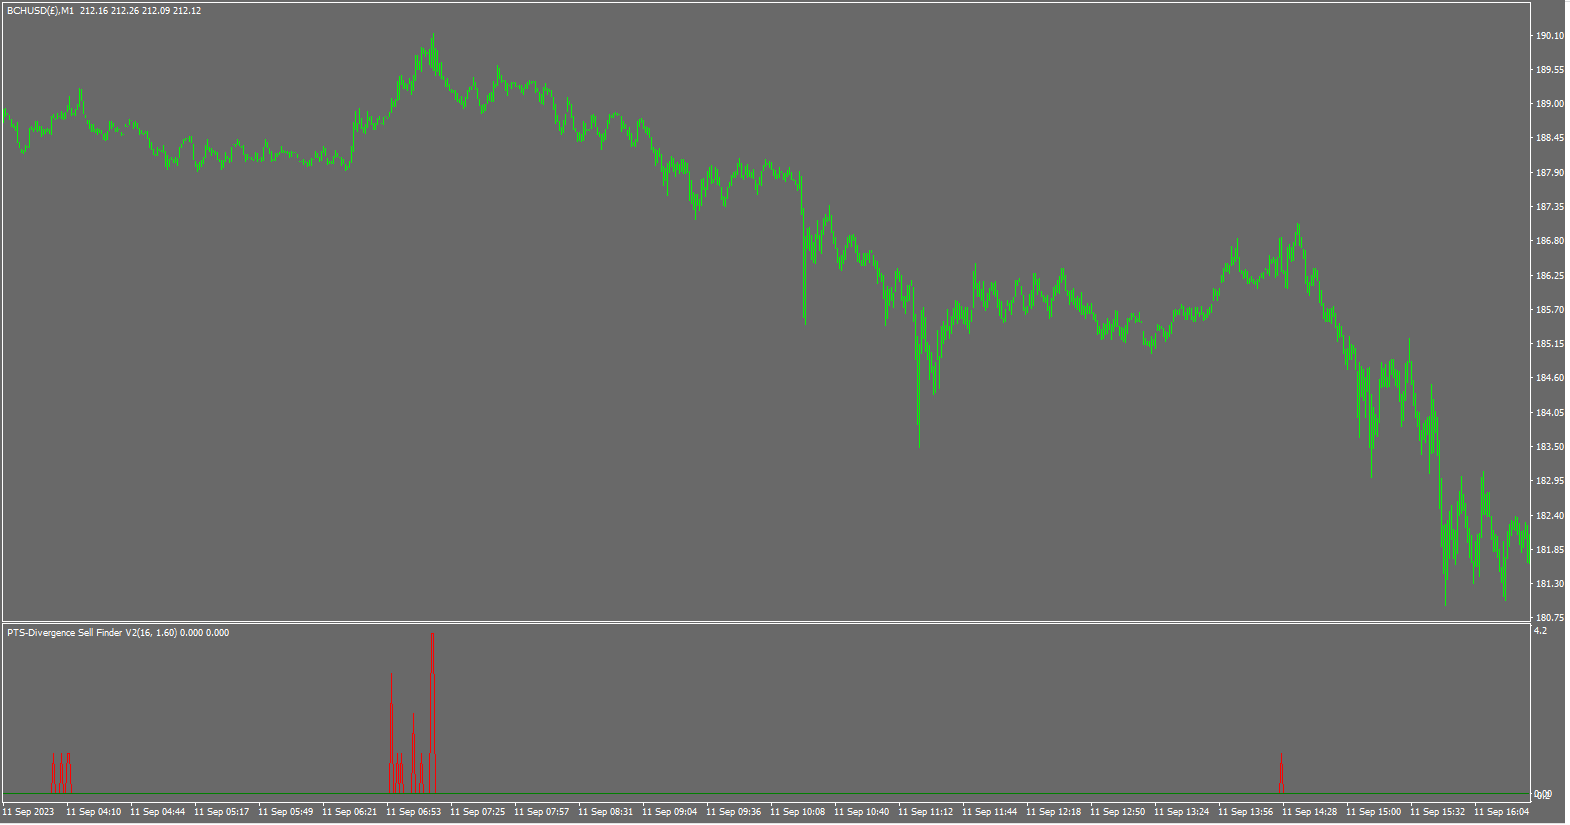
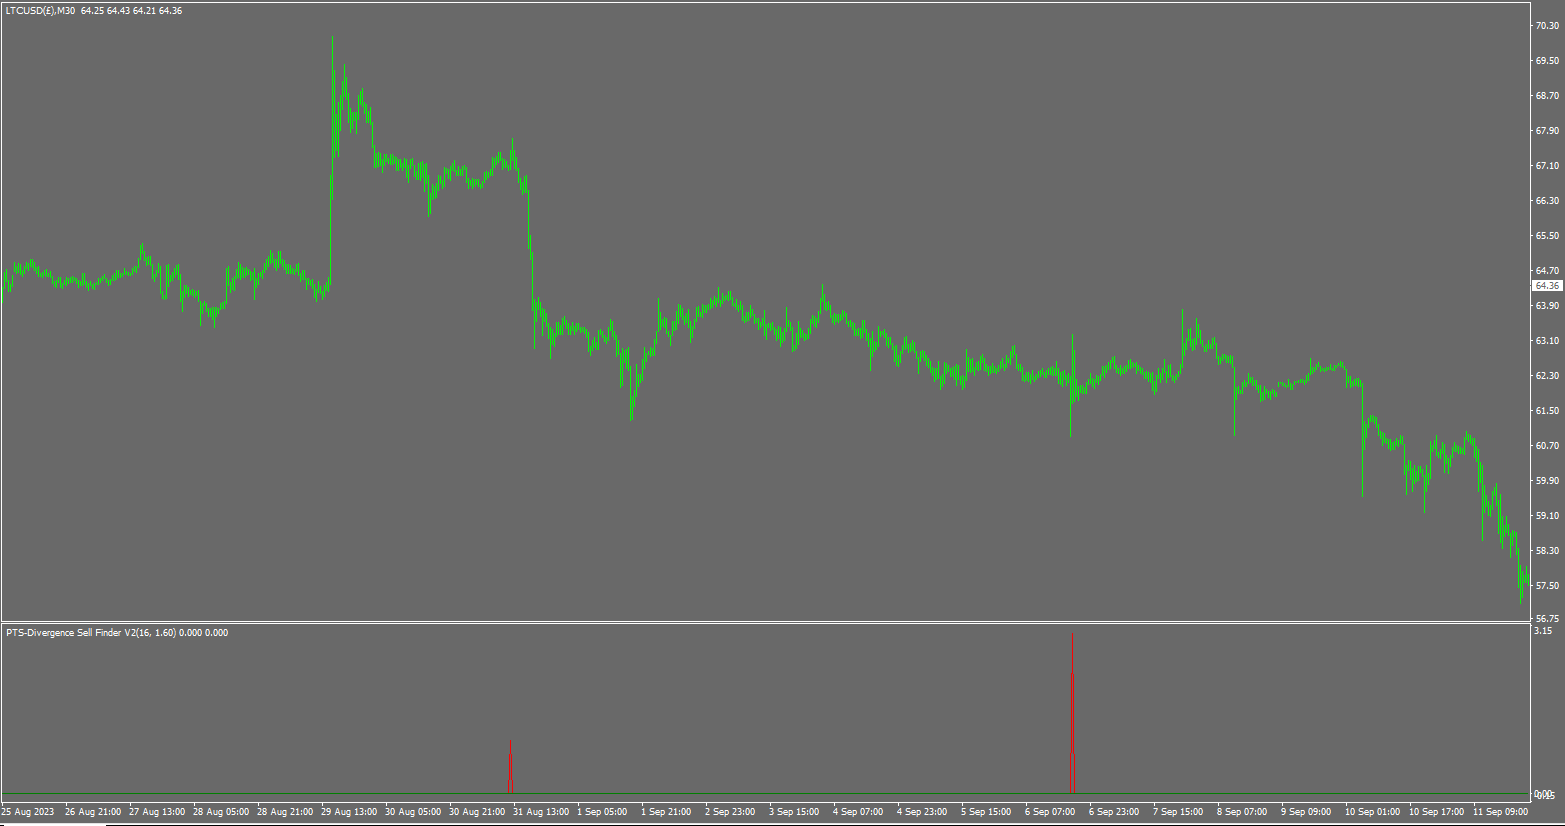
This is a histogram style indicator for subgraph two, which plots spikes which appear like stalagmites coming up from the base.

The indicator examines multiple lookback periods of the volume based Demand Index Indicator for the length that you specify. It finds high points in prices where the DI is not making a new "local" high and missing it by the "difference" setting you input.

Liquid markets where many people are voting on the market direction give the best results.

A total of twenty look back periods are scanned on every bar and these are hard coded and non adjustable. The length of Demand Index is user adjustable

but it is suggested not to wander too far below the default setting of length 55.

The second user adjustable field is difference and this represents the difference between Demand Index now and Demand Index N bars ago. (N being 20 different look back periods of various periods)

You will understand that a length 18 Demand Index produces a much more volatile plot than a 80 period plot.

For this reason you can find short lengths of Demand Index and small difference values will produce many more signals of divergences as there is higher volatility in the underlying indicator. (Statement repeated for emphasis)

You will observe this when you use it. You can set it to give hundreds of insignificant values but it is best used so you just see the significant ones by following the guidelines below.


The nature of fear and greed are entirely different as fear is fast and instinct driven at market tops as the opposite emotions of fear and euphoria can instantly lead a human brain into the survival mode of fight or flight.

In the bottoming or oversold conditions in markets greed propagates slowly in buyers as they consider picking up value purchases at market lows with a mindset of having a low expectation of success.

This is what causes the asymmetry in market tops versus bottoms. Therefore the asymmetric settings of the buy and sell versions of this product are now explained for clarity.


I have decided to release the sell divergence indicator with "stricter" default settings. 

The Demand Index length used is 55 and the difference it needs to trigger a signal is 0.25. These of course are user adjustable. The strictness means there are less insignificant signals.

The results are many tops and intermediate high points defined with pinpoint accuracy. As expected there are some disastrous signals in the midst of

violent up trends which a trader can lose on if not using risk management and stops. Likewise it frequently finds the exact top.

DI Length 20 = difference of 0.95 - 3

DI Length 30 = difference of 0.85 - 2.3

DI Length 40 = difference of 0.75 - 2.1

DI Length 50 = difference of 0.25 - 1.8

DI Length 60 = difference of 0.2  - 1.5

DI Length 70 = difference of 0.15  - 1.2

DI Length 80 = difference of 0.1  - 1.1

DI Length 90 = difference of 0.1   - 0.9

DI Length 100 = difference of 0.1 - 0.8


Maximum length =100. 


How to use. 

Observe the divergence, then wait for the trend to break down before selling. This measurement can be defined as a 20 bar low, or a moving average turning down for example. 

Timeframes which do well are varied, some good results on M1 and H1 have been recently observed. 


If you have any questions, it is best to email me via my site which you can find by searching as I do not have push notifications enabled here on MT4. If you message me here it might be a week or two before I see it. 

Recommended products
Alpha Trend sign has been a very popular trading tool in our company for a long time. It can verify our trading system and clearly indicate trading signals, and the signals will not drift. Main functions: Based on the market display of active areas, indicators can be used to intuitively determine whether the current market trend belongs to a trend market or a volatile market. And enter the market according to the indicator arrows, with green arrows indicating buy and red arrows indicating se
Infinity Trend Pro
Yaroslav Varankin
1 (1)
This is a trend indicator without redrawing Developed instead of the binary options strategy (by the color of the Martingale candlestick) Also works well in forex trading When to open trades (binary options) A signal will appear in the place with a candle signaling the current candle It is recommended to open a deal for one candle of the current timeframe M1 and M5 When a blue dot appears, open a deal up When a red dot appears, open a trade down. How to open trades on Forex. When a signal is rec
Owl smart levels
Sergey Ermolov
4.24 (37)
MT5 version  |  FAQ The Owl Smart Levels Indicator  is a complete trading system within the one indicator that includes such popular market analysis tools as  Bill Williams' advanced fractals , Valable ZigZag which builds  the correct wave structure  of the market, and  Fibonacci levels  which mark the exact levels of entry into the market and places to take profits. Detailed description of the strategy Instructions for working with the indicator Advisor-assistant in trading Owl Helper Private
Binary Options Support Resistance Indicator This indicator is designed for binary options trading and effectively shows retracements from support and resistance levels. Signals appear on the current candle. A red arrow pointing downwards indicates a potential selling opportunity, while a blue arrow pointing upwards suggests buying opportunities. All that needs adjustment is the color of the signal arrows. It is recommended to use it on the M1-M5 timeframes as signals are frequent on these timef
Heiken Ashi Smoothed Strategy is a very simple but powerful system to get forex market trend direction. This indicator is actually 2 indicators in 1 pack, Heiken Ashi and Heiken Ashi Smoothed Moving Average both included. Because HA (Heiken Ashi) and HAS (Heiken Ashi Smoothed) are calculated in the same one system event with necessary buffers and loop only, so it is the FAST, OPTIMIZED and EFFICIENT HA having the combined indicator of MetaTrader 4. You can choose to display HA and HAS in the sam
Line Magnit
Aleksey Trenin
The LineMagnit Indicator for MT4 is a highly precise tool that builds support and resistance levels which magnetically attract prices. This feature allows traders to easily determine the most probable entry and exit points in the market, as well as identify the market's directional forces, as levels are based on capital inflows into the instrument. Equipped with an intuitively understandable graphical interface, the LineMagnit Indicator enables users to quickly locate and analyze support and res
Renko, Heiken Ashi, Ticks Bar, Range Bar.    Easy switching, easy setup, all in one window.        Place the Custom Chart indicator and view Renko, Heiken Ashi, Tick bar, Range bar charts in real time at real chart.    Position the offline chart window so that the indicator control panel is visible.    Switch the chart mode by click of a button.    Connect to the output chart any indicator, expert advisor without any restrictions.    No, it doesn't work in the tester.    Yes, you can use an
Insider Scalper Binary This tool is designed to trade binary options. for short temporary spends. to make a deal is worth the moment of receiving the signal and only 1 candle if it is m1 then only for a minute and so in accordance with the timeframe. for better results, you need to select well-volatile charts.... recommended currency pairs eur | usd, usd | jpy .... the indicator is already configured, you just have to add it to the chart and trade .... The indicator signals the next candle.
Trend Oscillator - is an advanced custom  Crypto_Forex indicator, efficient trading tool! Advanced new calculation method is used - 20 options for parameter "Price for calculation". Smoothest oscillator ever developed. Green color for upward trends,  Red color for downward trends. Oversold values: below 5, O verbought values: over 95. There are plenty of opportunities to upgrade even standard strategies with this indicator. With PC and Mobile alerts. // Great Trading Robots and Indicators are a
Chart Patterns Detect 15 patterns (Ascending Triangle, Descending Triangle, Rising Wedge, Falling Wedge, Bullish Flag, Bearish Flag, Bullish Rectangle, Bearish Rectangle Symmetrical triangle, Head and Shoulders, Inverted Head and Shoulders, Triple top, Triple Bottom, Double Top, Double Bottom) Use historical data to calculate the probability of each pattern to succeed (possibility to filter notification according to the chance of success) gives graphic indication about the invalidation level and
PABT Pattern Indicator - it's classical system one of the signal patterns. Indicator logic - the Hi & Lo of the bar is fully within the range of the preceding bar, look to trade them as pullback in trend. In the way if indicator found PABT pattern it's drawing two lines and arrow what showing trend way.  - First line - it's entry point and drawing at: 1. On the high of signal bar or on middle of the signal bar (depending from indicator mode) for buy; 2. On the low of signal bar or on middle of t
EZZ Zig Zag MT4
Paulo Rocha
5 (1)
EZZ Elite Zig Zag is an indicator for the MetaTrader 4 terminal. This indicator traces the peak of the trend based on the market reversal, thus showing various opportunities in the financial market. EZZ Elite Zig Zag is a visual tool, intuitive, and easy to understand and use.  Test it Yourself by Downloading it for Free. Author Paulo Rocha all rights reserved
SystemBinaryM1
Andrey Spiridonov
SystemBinaryM1 - a professional indicator for trading short-term binary options, is a complete, self-contained author's strategy for working in the binary options market. The unique algorithm for analyzing the foreign exchange market is based on the calculation of reference points on three different time periods M15, M5. M1. Thus, the indicator simultaneously analyzes the long-term, medium-term and short-term price behavior before issuing a signal. The indicator is set in the usual way and work
[ZhiBiCCI] indicators are suitable for all cycle use, and are also suitable for all market varieties. [ZhiBiCCI] Green solid line is a reversal of bullish divergence. The green dotted line is a classic bullish divergence. [ZhiBiCCI] The solid line to the red is a reverse bearish divergence. The red dotted line is a classical bearish divergence. [ZhiBiCCI] can be set in the parameters (Alert, Send mail, Send notification), set to (true) to send instant signals to the alarm window, email, insta
Fibonacci retracement and extension line drawing tool Fibonacci retracement and extended line drawing tool for MT4 platform is suitable for traders who use  golden section trading Advantages: There is no extra line, no too long line, and it is easy to observe and find trading opportunities Trial version: https://www.mql5.com/zh/market/product/35884 Main functions: 1. Multiple groups of Fibonacci turns can be drawn directly, and the relationship between important turning points can be seen
Alpha Trend
Evgeny Belyaev
3 (4)
Alpha Trend is a trend indicator for the MetaTrader 4 platform; it has been developed by a group of professional traders. The Alpha Trend indicator finds the most probable tendency reversal points, which allows making trades at the very beginning of a trend. This indicator features notifications, which are generated whenever a new signal appears (alert, email, push-notification). This allows you to open a position in a timely manner. Alpha Trend does not redraw, which makes it possible to evalua
Happy Scalping Indicator
Leandro Bernardez Camero
This indicator was designed for aggressive scalping and quick entries in binary options , generating signals on every candle , so you can know exactly what is happening at all times. Join the Happy Scalping channel: MQL5 It does not repaint : the current candle's signal is generated in REAL TIME , which means it may change while the candle is still forming, depending on whether the price rises or falls compared to the previous candle's close. But once the candle closes , the signal color becom
PipFinite Trend PRO
Karlo Wilson Vendiola
4.88 (2245)
Breakthrough Solution For Trend Trading And Filtering With All Important Features Built Inside One Tool! Trend PRO's smart algorithm detects the trend, filters out market noise and gives entry signals with exit levels. The new features with enhanced rules for statistical calculation improved the overall performance of this indicator. Important Information Revealed Maximize the potential of Trend Pro, please visit www.mql5.com/en/blogs/post/713938 The Powerful Expert Advisor Version Automatin
Capernaum
Andriy Sydoruk
Visually, Capernaum, on the chart, appears as small arrows indicating the direction of the trend movement and the opening of trading positions. The appearance of a blue up arrow indicates that the market is beginning to rise and it is time to buy. And the appearance of a red down arrow means that the market is falling and it is high time to sell. When a suitable moment for buying appears, the indicator generates a signal exactly at the moment of its appearance and not below or above the current
Trendiness Index
Libertas LLC
5 (3)
"The trend is your friend" is one of the best known sayings in investing, because capturing large trendy price movements can be extremely profitable. However, trading with the trend is often easier said than done, because many indicators are based on price reversals not trends. These aren't very effective at identifying trendy periods, or predicting whether trends will continue. We developed the Trendiness Index to help address this problem by indicating the strength and direction of price trend
Stepping Trend
Mpendulo Chiliza
The Stepping Trend Indicator     The Steppi ng Trend indicator uses the  average true range  (ATR indicator) in its calculation. This gives you control to set your own average true range period, I set the Default as 10.   Indicator Details. Green Arrow Up: This means you are at the starting point of a new bullish trend, it’s time to buy.   Red  Arrow  Down : This means you are at the starting point of a new  bearish  trend, it’ s time to sell .   What if you miss the Arrow Signal?   No prob
Super Reversal Pattern
Parfait Mujinga Ndalika
Super Reversal Pattern Indicator Unlock the power of advanced pattern recognition with our Super Reversal Pattern Indicator. Designed for traders seeking precision and reliability, this indicator identifies one of the most effective reversal patterns in technical analysis, offering a significant edge in your trading strategy. Key Features: Non-Repainting Accuracy: Enjoy the confidence of non-repainting technology. Once a Super Reversal Pattern is detected, it remains static, providing consiste
Forex Gump Booster Scalping is a forex signal indicator. Shows on the Metatrader4 chart signals when to open trades to buy and sell. Also sends signals to the phone and email. EA works on all currency pairs and timeframes. The default parameters are set to EURUSD D1. But you can customize to any currency pair. The indicator will help you with this. You select the parameters in the settings, and the indicator displays the predicted profit / loss for the last 1000 bars. If the projected profit sui
Signal Undefeated   indicator is designed for trend and signal trading. This indicator generates trend signals.  It uses many algorithms and indicators to generate this signal. It tries to generate a signal from the points with the highest trend potential. This indicator is a complete trading product. This indicator does not need any additional indicators.  You can only trade with this indicator. The generated signals are displayed on the graphical screen.  Thanks to the alert features you can g
Auto Fibo Pro m
DMITRII GRIDASOV
"Auto FIBO Pro"   Crypto_Forex  indicator  - is great auxiliary tool in trading! Indicator automatically calculate and place on chart Fibo levels and local trend lines (red color). Fibonacci levels indicate key areas where price can reverse. Most important levels are 23.6%, 38.2%, 50% and 61.8%. You can use it   for reversal scalping  or for zone grid trading. There are plenty of opportunities to  improve your current system using Auto FIBO Pro indicator as well. It has Info Spread Swap Displa
The Th3Eng PipFinite indicator is based on a very excellent analysis of the right trend direction with perfect custom algorithms. It show the true direction and the best point to start trading. With StopLoss point and Three Take Profit points. Also it show the right pivot of the price and small points to order to replace the dynamic support and resistance channel, Which surrounds the price. And Finally it draws a very helpful Box on the left side on the chart includes (take profits and Stop loss
Naturu MT4
Ivan Stefanov
'Naturu' is a manual indicator that uses nature’s symmetry as its algorithm. Master the market with a simple strategy and hidden wisdom!   ( This is a manual indicator and contains features that are not supported by the MetaTrader testing environment ) When you load the indicator, you’ll see two lines—Top and Bottom. Click once on a line to activate it. To move it, simply click on the candlestick where you want it placed. You define a high point and a low point, and the indicator then calcula
Market Vortex
Adolfina Denysenko
Market Vortex.mq4 is a powerful arrow indicator designed to accurately identify reversal points and trend continuations. Built on a smoothed oscillator and adaptive moving averages, it helps traders quickly find market entry and exit points without complex calculations. Key Features: Clear arrow signals: The indicator displays Buy/Sell arrows directly on the chart. Real-time operation: Signals are generated without delays or repainting. Adaptive calculation: The indicator uses a do
The indicator displays the data of the Stochastic oscillator from a higher timeframe on the chart. The main and signal lines are displayed in a separate window. The stepped response is not smoothed. The indicator is useful for practicing "manual" forex trading strategies, which use the data from several screens with different timeframes of a single symbol. The indicator uses the settings that are identical to the standard ones, and a drop-down list for selecting the timeframe. Indicator Paramet
Macd Trend System   indicator is designed for trend and signal trading. This indicator generates trend signals.  It uses many algorithms and indicators to generate this signal. It tries to generate a signal from the points with the highest trend potential. This indicator is a complete trading product. This indicator does not need any additional indicators.  You can only trade with this indicator. The generated signals are displayed on the graphical screen.  Thanks to the alert features you can g
Buyers of this product also purchase
Currently 20% OFF ! Best Solution for any Newbie or Expert Trader! This dashboard software is working on 28 currency pairs plus one. It is based on 2 of our main indicators (Advanced Currency Strength 28 and Advanced Currency Impulse). It gives a great overview of the entire Forex market plus Gold or 1 indices. It shows Advanced Currency Strength values, currency speed of movement and signals for 28 Forex pairs in all (9) timeframes. Imagine how your trading will improve when you can watch the e
Dynamic Forex28 Navigator
Bernhard Schweigert
5 (6)
Specials Discount now. The Next Generation Forex Trading Tool. Dynamic Forex28 Navigator is the evolution of our long-time, popular indicators, combining the power of three into one: Advanced Currency Strength28 Indicator (695 reviews) + Advanced Currency IMPULSE with ALERT (520 reviews) + CS28 Combo Signals (recent Bonus) Details about the indicator  https://www.mql5.com/en/blogs/post/758844 What Does The Next-Generation Strength Indicator Offer? Everything you loved about the originals, now
The " Dynamic Scalper System " indicator is designed for the scalping method of trading within trend waves. Tested on major currency pairs and gold, compatibility with other trading instruments is possible. Provides signals for short-term opening of positions along the trend with additional price movement support. The principle of the indicator. Large arrows determine the trend direction. An algorithm for generating signals for scalping in the form of small arrows operates within trend waves.
Supply and Demand Dashboard PRO
Bernhard Schweigert
4.8 (20)
Currently 20% OFF ! This dashboard is a very powerful piece of software working on multiple symbols and up to 9 timeframes. It is based on our main indicator (Best reviews:   Advanced Supply Demand ). The dashboard gives a great overview. It shows: Filtered Supply and Demand values including zone strength rating, Pips distances to/and within zones, It highlights nested zones, It gives 4 kind of alerts for the chosen symbols in all (9) time-frames. It is highly configurable for your personal n
GoldRush Trend Arrow Signal The GoldRush Trend Arrow Signal indicator provides precise, real-time trend analysis tailored for high-speed, short-term scalpers in XAU/USD . Built specifically for the 1-minute time frame, this tool displays directional arrows for clear entry points, allowing scalpers to navigate volatile market conditions with confidence. The indicator consists of PRIMARY and SECONDARY alert arrows. The PRIMARY signals are White and Black directional arrows which signal a change in
"Dragon's Tail" is an integrated trading system, not just an indicator. This system analyzes each candle on a minute-by-minute basis, which is particularly effective in high market volatility conditions. The "Dragon's Tail" system identifies key market moments referred to as "bull and bear battles". Based on these "battles", the system gives trade direction recommendations. In the case of an arrow appearing on the chart, this signals the possibility of opening two trades in the indicated directi
Elliott Wave Trend was designed for the scientific wave counting. This tool focuses to get rid of the vagueness of the classic Elliott Wave Counting using the guideline from the template and pattern approach. In doing so, firstly Elliott Wave Trend offers the template for your wave counting. Secondly, it offers Wave Structural Score to assist to identify accurate wave formation. It offers both impulse wave Structural Score and corrective wave Structure Score. Structural Score is the rating to sh
Key level wedge pro
Presley Annais Tatenda Meck
5 (1)
We have combined all of our beloved indicators the likes of: Key level order block , Key level supply and demand , Key level liquidity grab and Key level wedge into one single indicator and dashboard. Whats new Dashboard : There is an easy access dashboard for all your needs. Multi-timeframe button : There is now a multi-timeframe option for Order Blocks and Supply and demand zones, making it easy to see higher timeframe zones easily on the current timeframe by just clicking the desired timefra
The Super Arrow Indicator provides non-repainting buy and sell signals with exceptional accuracy. Key Features No repainting – confirmed signals remain fixed Clear visual arrows: green for buy, red for sell Real-time alerts via pop-up, sound, and optional email Clean chart view with no unnecessary clutter Works on all markets: Forex, gold, oil, indices, crypto Adjustable Parameters TimeFrame Default: "current time frame" Function: Sets the time frame for indicator calculation Options: Can be set
Gold Channel is a volatility-based indicator, developed with a specific timing algorithm for the XAUUSD pair, which consists of finding possible corrections in the market. This indicator shows two outer lines, an inner line (retracement line) and an arrow sign, where the theory of the channel is to help identify overbought and oversold conditions in the market. The market price will generally fall between the boundaries of the channel. If prices touch or move outside the channel it is a tradi
RelicusRoad Pro
Relicus LLC
4.63 (106)
How many times have you bought a trading indicator with great back-tests, live account performance proof with fantastic numbers and stats all over the place but after using it, you end up blowing your account? You shouldn't trust a signal by itself, you need to know why it appeared in the first place, and that's what RelicusRoad Pro does best! User Manual + Strategies + Training Videos + Private Group with VIP Access + Mobile Version Available A New Way To Look At The Market RelicusRoad is th
Introduction to X3 Chart Pattern Scanner X3 Cherart Pattern Scanner is the non-repainting and non-lagging indicator detecting X3 chart patterns including Harmonic pattern, Elliott Wave pattern, X3 patterns, and Japanese Candlestick patterns. Historical patterns match with signal patterns. Hence, you can readily develop the solid trading strategy in your chart. More importantly, this superb pattern scanner can detect the optimal pattern of its kind. In addition, you can switch on and off individu
Scientific trade
Aleksey Ivanov
5 (1)
An extremely convenient indicator that truly makes the process of making money on the exchange easy. It is based on the scientifically rigorous theory of the market developed by the author, the beginning of which is presented here .                The full algorithm of this indicator operation is presented in the article .               The indicator calculates the most probable price movement trajectory and displays it on the chart. Based on the predicted price movement trajectory
PTS Precision Index Oscillator V2
PrecisionTradingSystems
5 (1)
The Precision Index Oscillator (Pi-Osc) by Roger Medcalf of Precision Trading Systems First of all, if you have any questions please contact me via my website which you can find by searching the above title. Version 2 has been carefully recoded to be super fast to load up on your chart and some other technical improvements have been incorporated to enhance experience. Pi-Osc was created to provide accurate trade timing signals designed to find extreme   exhaustion points, the points that markets
Core Principles Swing Angle Measurement   Swing angles are calculated by measuring the degree of price movement between swing highs and lows over time. Steeper angles (typically 45+ degrees) indicate stronger momentum and potentially more profitable trading opportunities. Traders use various timeframes to identify these patterns, from intraday charts to weekly swings. Momentum Confirmation   High degree swing angles often coincide with strong momentum indicators like RSI breakouts, volume spikes
The "Binary Smart Eye" MT4 indicator is designed to provide trading signals for both binary options and forex markets, operating across a wide range of timeframes from M1 to W1. It employs a proprietary strategy that combines trend levels, an intelligent moving average, and optimized trading periods to identify potential entry points. Here's a breakdown of its key features: Multi-Timeframe Analysis: The indicator's versatility allows traders to utilize it on various timeframes, catering to diffe
POWR Rise Coming
Trade Indicators LLC
This indicator is SO SIMPLE… when the green Rise Coming arrow appears, a price drop may be on the way! Plain and easy profits! As you receive more than one 'Rise Coming' text signal in a downtrend, it means momentum is building larger for a bull run. HOW TO USE 1. When the green "Rise Coming" text appears, a price jump may be on the way! This indicator Never Repaints! To get the best setting it's a matter of tweaking the indicator until it gives you the best results. Our recommendation, and what
Hidden Cycles
Lev Vladimirovic Marushkin
5 (1)
Based on Universal Laws — NOT Some Guy’s Algorithm: Let the market adjust to the Hidden Cycles Geometry — not the other way around. Most indicators are based on a man-made formula. They often lag, fail over time, or need constant re-optimization.  Hidden Cycles is different. It’s the first and only MT4 indicator rooted in universal proportion and perfect relation — the invisible structure that governs all market behavior. Inspired by ideas from Fibonacci, Gann, and Murrey — and built as somethi
Enigmera
Ivan Stefanov
5 (8)
ENIGMERA: The core of the market (This is a manual indicator and contains features that may not supported by the MetaTrader current testing environment) Introduction This indicator and trading system is a remarkable approach to the financial markets . ENIGMERA uses the fractal cycles to accurately calculate support and resistance levels. It shows the authentic accumulation phase and gives direction and targets.  A system that works whether we are in a trend or a correction.   How It Works Most
Introduction to Fractal Pattern Scanner Fractal Indicator refers to the technical indicator that makes use of the fractal geometry found in the financial market. Fractal Pattern Scanner is the advanced Fractal Indicator that brings the latest trading technology after the extensive research and development work in the fractal geometry in the financial market. The most important feature in Fractal Pattern Scanner is the ability to measure the turning point probability as well as the trend probabi
[V 2.00] MTF NRPA 5 Moving Average RTD has been released! ( New sub buttons 2025 ) Non repaint arrow real time dashboard. If you are looking for the best moving average indicator then you are on the right page. Generally people will install two moving averages because the intersection of the two moving averages (the crossover) will determine the direction of the next price trend. If the fast moving average intersects with the slow moving average and fast > slow then the trend is up. Conversely,
WeSpread
Anchor Trading S.R.L.S.
The We-Spread mt4 indicator is a spread trading tools and it is suitable for those who want to study the markets with a different approach to the contents that are normally available in online trading bookstores. I think the Spread Trading strategy is one of the best I've ever used in the last few years. This is a unique indicator for spread trading because allow you to study till 3 spreads in one time. What is Spread Trading on forex The Spread Trading is the study of the strength of 2 currency
IQ FX Gann Levels a precision trading indicator based on W.D. Gann’s square root methods. It plots real-time, non-repainting support and resistance levels to help traders confidently spot intraday and scalping opportunities with high accuracy. William Delbert Gann (W.D. Gann) was an exceptional market analyst, whose trading technique was based on a complex blend of mathematics, geometry, astrology, and ancient mathematics which proved to be extremely accurate. Download the Metatrader 5 Version M
Wall Street Indicator – Your Key to Trading Success! Tired of tools that promise the world but fail to deliver results? Designed for MT4, the Wall Street Indicator is the ultimate solution to elevate your trading to the next level. This indicator has been meticulously developed to provide clear, reliable, and precise signals. Here's why the Wall Street Indicator is the perfect choice for both beginners and experienced traders: Unmatched Performance – Proven Results 1-year detailed backtest: With
BinaryUniversal
Andrey Spiridonov
BinaryUniversal is a signal indicator for binary options and Forex. In its work, the indicator uses a complex algorithm for generating signals. Before forming a signal, the indicator analyzes volatility, candlestick patterns, important support and resistance levels. The indicator has the ability to adjust the accuracy of the signals, which makes it possible to apply this indicator for both aggressive and conservative trading. The indicator is set in the usual way, it works on any time period and
Predictive Levels
Satya Prakash Mishra
Market predictive price levels are key technical analysis tools is my finest invention through mathematics to predict automatically next price is where to reach after break any levels. A unique name quality it automatically calculate price range its my own invention according price value to predict what's is next price came than after it not fixed levels like Fibonacci or pivots Its Naveen's Predictive Levels .used to forecast where an asset's price might find support (stop falling) or resistanc
Gold Titan King Scalper
Dodong Christian Arnon
Indicator Description GOLD TITAN KING SIGNAL INDICATOR High-Precision Gold Scalping Buy/Sell Signals – Manual Trading Assistant Overview The Gold Titan King Signal Indicator is a manual trading assistant tool designed for high-frequency scalping on Gold (XAUUSD) and other major pairs. It generates clear BUY/SELL signals with precise entry levels, along with adjustable Stop Loss and Take Profit levels displayed directly on the chart. ️ This tool is NOT an EA. It does not execute trades
TREND HARMONY MT4 –  Multi Timeframe Trend and Phase and Pullback Level Visualizer indicator for Metatrader4 The TREND HARMONY indicator automates deep trend analysis and generates visualizations for you. Take control of your trades by eliminating uncertainty! Revolutionize your trading experience with precision and insight through the TREND HARMONY Multi Timeframe Trend Indicator – your ultimate MT4 trend visualization indicator. Are you tired of missing trading opportunities or consistently e
Beast Super Signal
Dustin Vlok
4.73 (89)
Limited Sale now on! Get 20% OFF! Was $249, now only $199! The Beast Super Signal indicator is a straightforward, trend-based indicator that's easy to use. It continuously monitors current market conditions, looking for new trends or opportunities to join existing ones. When all of its internal strategies align perfectly, the indicator provides a buy or sell signal. Just act on the signal arrow alert; no additional confirmation is needed. This versatile trading tool works across all currency p
Hit Rate Top Bottom Signal
Martin Alejandro Bamonte
Hit Rate Top Bottom Signal Hit Rate Top Bottom Signal Hit Rate Top Bottom Signal offers a completely innovative approach. It's ideal for those who want to evaluate beforehand how the signal performs with a specific TP-SL and in which PAIRS/TFs it performs best. The Hit Rate Top Bottom Signal strategy is a fundamental tool for any trader and any type of trading because it not only emits precise, non-repainting signals , clearly indicating when and in which direction to trade, but also keeps a det
More from author
PTS Precision Index Oscillator V2
PrecisionTradingSystems
5 (1)
The Precision Index Oscillator (Pi-Osc) by Roger Medcalf of Precision Trading Systems First of all, if you have any questions please contact me via my website which you can find by searching the above title. Version 2 has been carefully recoded to be super fast to load up on your chart and some other technical improvements have been incorporated to enhance experience. Pi-Osc was created to provide accurate trade timing signals designed to find extreme   exhaustion points, the points that markets
PTS Divergence Buy Finder
PrecisionTradingSystems
PTS - Divergence Buy Finder by Precision Trading Systems Precision Divergence Finder was designed to find market bottoms with pinpoint accuracy and frequently does so. In technical analysis, the art of picking bottoms is generally much easier than picking tops this item is designed precisely for this task. After a bullish divergence is identified then it is wise to wait for the trend to turn up before buying. You can use a 10 or 20 bar high to enter or a moving average 15-30 to be rising to ide
Demand Index
PrecisionTradingSystems
PTS Demand Index code by Precision Trading Systems Demand Index was the creation of James Sibbet and uses complex code to make simple work of the interpretation of volume and price as a combination. Understanding volumes is never an easy task but this beautiful piece of programming certainly makes like a lot easier. There are several ways in which this indicator can benefit traders and investors alike. Divergences (As a Leading indicator) Having studied many technical indicators over the years
The Precision Index Oscillator (Pi-Osc) for MT5 by Roger Medcalf of Precision Trading Systems First of all, if you have any questions please contact me via my website which you can find by searching the above title. Version 2 has been carefully recoded to be super fast to load up on your chart and some other technical improvements have been incorporated to enhance experience. Pi-Osc was created to provide accurate trade timing signals designed to find   extreme     exhaustion points, the points
PTS - Divergence Buy Finder by Precision Trading Systems Precision Divergence Finder was designed to find market bottoms with pinpoint accuracy and frequently does so. In technical analysis, the art of picking bottoms is generally much easier than picking tops this item is designed precisely for this task. After a bullish divergence is identified then it is wise to wait for the trend to turn up before buying. You can use a 10 or 20 bar high to enter or a moving average 15-30 to be rising to ide
PTS Demand Index MT5
PrecisionTradingSystems
PTS Demand Index code by Precision Trading Systems Demand Index was the creation of James Sibbet and uses complex code to make simple work of the interpretation of volume and price as a combination. Understanding volumes is never an easy task but this beautiful piece of programming certainly makes like a lot easier. There are several ways in which this indicator can benefit traders and investors alike. Divergences (As a Leading indicator) Having studied many technical indicators over the years
Filter:
No reviews
Reply to review