Смотри обучающее видео по маркету на YouTube
Как купить торгового робота или индикатор
Запусти робота на
виртуальном хостинге
виртуальном хостинге
Протестируй индикатор/робота перед покупкой
Хочешь зарабатывать в Маркете?
Как подать продукт, чтобы его покупали
Бесплатные технические индикаторы для MetaTrader 4 - 7

A trend indicator showing the strength of bulls and bears in a trading range.
Consists of two lines:
The green line is a balanced overbought/oversold condition. The red line is the direction of trading activity. Does not redraw calculations.
Can be used on all Symbols/Instruments/Time Frames.
Easy to use and set up.
How to use the indicator and what it determines.
The basic rule is to follow the direction of the red line:
if it crosses the green line from the bottom up, the market i
FREE

This indicator is a simple tool to spot a possible trend.
When the ribbon below the price bars, It will turn to Green color and the trend is seen to be bullish When the ribbon above the price bars, it will turn to Red color and the trend is seen to be bearish. It can be used a either Entry Signal Exit Signal or trailing stop, so it is very versatile. By default color : Green is UP trend and Red is Down trend and this work perfect with Bar4Colors.ex4
FREE

Time Range Separator - полезный инструмент для отображения разделителей периодов в платформе. Нужно только открыть настройки индикатора, выбрать необходимый диапазон и все. На наш взгляд, это очень полезно, поэтому мы хотели бы поделиться им бесплатно со всеми нашими подписчиками.
Входные параметры: TimeFrame Period Separator - таймфрейм
VLine_Color - цвет вертикальной линии VLine_Style - стиль вертикальной линии VLine_Width - ширина вертикальной линии Удачной торговли и до скорых встреч.
FREE
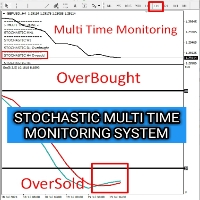
I made this Stochastic Indicator into multi time frame monitoring to monitor the occurrence of OverBuy and OverSell in real time on one monitor screen. My hope is that this indicator can help friends in the analysis process and also take trading moments with the system that friends have If this indicator is useful, friends can help me by giving likes to my channel and 5 stars on this indicator
Indicator Stochastic ini saya buat menjadi multi time frame monitoring untuk memantau terjadi nya
FREE

PLEASE TAKE NOTICE: This indicator is in current development. final version will be free.
This is a simple indicator that uses 3 timeframes in its formula to create Possible buy and sell signals. This indicator is optimized for the M1 timeframe Only. It has 2 types of Alerts: Push Notifications Audio Alerts UPDATES:
3/19/24: Still testing the final code
Troubleshooting: When loading the indicator, if you don't see the arrows on the current chart that means that MT4 has not loaded all the h
FREE
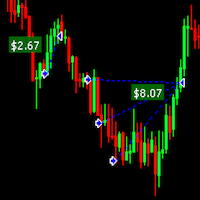
Draw Profit indicator can efficiently help those traders who want to see on the chart all closed positions output: profit or loss. If set DrawProfit on your chart managed by an Expert Advisor (EA) you will see clearly it’s performance by its profits & losses. My other products: https://www.mql5.com/en/users/hoangvudb/seller
Input parameters: Show Profit Labels : show profit of orders with a label (true/false). Profit Mode : available options: Show in currency. Show in pips. Show in currency
FREE

Уровни Central Pivot Range формируются вокруг центральной точки разворота.
Эти уровни по отношению к центральной оси могут использоваться для определения поведения многих рынков и возможных результатов.
Расстояние от центральной точки поворота и цена, которую формируют новые уровни по отношению к уровням предыдущего дня, можно использовать для определения направления и силы тренда следующих дней.
Диапазоны центральных пивот могут выступать в роли поддержки и сопротивления, предлагать орие
FREE

Indicator ini berdasarkan Gain ADX - Follow Trend - Disertai Pivot, Support & Resistant Daily
Dengan indicator ini semoga menjadikan indicator yang porofit able, selama mengikuti signal yang tampil, apabila berwarna Hijau siap2 untuk Buy, dan berwarna Merah siap2 untuk Sell.
Akan tampil signal Sell/Buy di saat gain mencukupi, baik TF Kecil maupun TF Besar TF Besar / High TF adalah Trend Kuat TF Kecil / Low TF adalah Trend Lemah
Open Posisi pada High TF, signal akan menunjukkan Sell/Buy.
FREE
Эта программа сделает анализ нескольких таймфреймов более удобным.
Это поможет синхронизировать все графики на разных графиках синхронизации таймфреймов, чтобы отображать один и тот же символ, тот же определенный период времени и синхронизация объектов чертежа Показать на всех диаграммах одновременно
Поддержка синхронизации объектов: вертикальная/горизонтальная линия, линия тренда, прямоугольник, стрелка, коррекция Фибоначчи
Дополнительная функция: оповещение о линии тренда
Как им польз
FREE

Round Numbers Levels indicator for MT4 Round Numbers indicator is a simple but useful indicator to draw 00 and 50 price levels in your chart.
These levels act as supports and resistances, and therefore should be taken into account when trading.
These levels can be used as profit targets or entry points.
Inputs of the indicator are:
TGridColor00: color to be used for xx00 levels GridStyle00: line style to be used for xx00 levels GridWidth00: line width to be used for xx00 levels GridCol
FREE
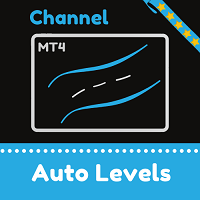
Динамический канал. Ширина канала автоматически изменяется в зависимости от движения цены. Чем сильнее отклонение от середины канала, тем шире становятся границы. Индикатор подстраивается под движения на заданном вами участке графика (параметр "Bars for calculations"). Соответственно если цена сделала резкое колебание на заданном промежутке, то канал расширится, ожидая дальнейшие сильные колебания. То есть его параметры всегда будут соответствовать текущей ситуации на рынке. Канал не предназначе
FREE

ИНДИКАТОР C ДВОЙНОЙ СКОЛЬЗЯЩЕЙ СРЕДНЕЙ (МА).
Рекомендации:
Индикатор лучше работает, если две линии одновременно одного цвета.
(если одна зеленая, а другая красная - Цена в зоне флэта (лучше ничего не делать)).
Входные параметры: 1. Период первой и второй МА.
2. Толщина линии первой и второй МА.
3. Цвет линии первой и второй МА.
Буду признателен, если оцените и другие мои продукты!
С Уважением, NoVak Production.
FREE

Не секрет что у разных брокеров и на разных типах счетов могут быть различные значения спреда (разница между Bid и Ask ценой). В таких условиях один и тот же советник будет торговать с совершенно разными результатами. Ч ем больше спред символа тем меньше прибыли в сделке получаете вы и тем больше прибыли с вас получает брокер. Поэтому измерение спреда очень важно для выбора брокера и типа счета, особенно для scalping, midnight и intraday стратегий. Простой но надежный индикатор от INFINITY по
FREE

Этот индикатор представляет собой метод анализа рынка, основанный на статье «Математическая формула для прогнозов рынка», написанной У.Д. Ганном, в зависимости от метода квадрата девяти и квадрата 144.
Руководство пользователя: Add Your review And contact us to get it
Вы можете купить полную версию MT5 у:
https://www.mql5.com/ru/market/product/28669
Вы можете бесплатно протестировать на МТ4:
https://www.mql5.com/en/market/product/15316
Этот продукт может нарисовать для вас к
FREE

Ищет точки входа по локальному тренду без перерисовки! Стрелками отображаются точки входа. Основан на классических индикаторах. Индикатор легкий в использовании. Подпишись на мой telegram канал, ссылка в контактах моего профиля . Настройки Наименование Описание Frequency factor Частота сигнала. Чем меньше, тем чаще.
Соответственно, это влияет на качество.
Рекомендации: Рекомендуется использовать на мажорных валютных парах. Таймфрем от м5, м15, м30
FREE

Session Killzone Indicator
Indicator that helps you to identify the killzone times of both London and NewYork sessions which usually is the most times for high volatility and taking liquidity from the market. Killzone times are configurable through indicator parameters. The indicator adjusts the range of the killzones based on the daily trading range.
FREE
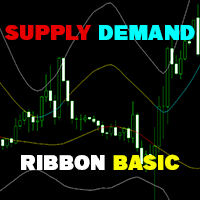
Supply Demand Ribbon is an indicator with moving supply and demand lines that help you identify price zones more easily. The indicator helps you determine flexible entry, stop loss, and take profit areas. There are also strategies for algorithmically changing ribbon colors. From there you can come up with many trading strategies for yourself! MT5 Version: Click here!
You can explore many feature in Advanced version here ! You can combine it with our indicators below to make your trad
FREE

This indicator will detect harmonic patterns that are drawn on the chart by manual and automatic methods. You can see user manual from this link: https://www.mql5.com/en/blogs/post/719257 There is a free version (it detect only Gartley and Nenstar Patterns) to try this product. You can buy the full MT4 version from: https://www.mql5.com/en/market/product/104689
Notes When you use this indicator and change the settings, add indicators like Moving Average or Bollinger Bands, this indicator will
FREE

Please check the " What's new " tab regularly for a complete and up-to-date list of all improvements + parameters. FREE indicator for my trading utility Take a Break . This indicator allows you to manage multiple other EAs with just one Take a Break EA instance. Simply specify the corresponding Chart Group in the indicator(s) and Take a Break EA settings and you are good to go.
Setup examples (Indicator + EA)
As a prerequisite, add the URL https://trading.custom-solutions.it to the list of
FREE

Индикатор объединил 5 популярных стратегий. Рисует стрелку после подтверждения сигнала по выбранной стратегии. Есть оповещения по сигналам. Не перерисовывает свои значения. Рекомендую посмотреть моего советника - Night Zen EA
Подпишись на мой telegram канал, ссылка в контактах моего профиля .
5 стратегий. Главная линия пересекает сигнальную. Главная линия пересекает сигнальную в зоне перепроданности (для покупок) / перекупленности (для продаж). Главная линия входит в зону перепроданности
FREE

This is Free product you are welcome to use for your needs! Also I very appreciate your positive feedbacks! Thanks a lot! // More great Expert Advisors and Indicators are available here: https://www.mql5.com/en/users/def1380/seller Forex Indicator Spread Display for MT4 , Trading Support . Spread Display indicator shows current spread of forex pair where it is attached. It is possible to locate Spread display value in any corner of the chart: 0 - for top-left corner, 1 - top-right, 2 - bottom-
FREE

ADX Channel - это индикатор, который рисует канал в зависимости от показаний индикатора ADX (Average Directional Movement Index). Канал получается немного похож на Envelopes, однако его линии зависят от волатильности рынка. Сделка на продажу обычно осуществляется, когда цена коснется и отскочит от верхней линии канала, покупка - от нижней. Рекомендуется торговать в то время, когда нет важных новостей. Таймфремы, которые лучше использовать: M5 - H1. Индикатор не предназначен для торговли на таймф
FREE
WONNFX iN M5 - Arrow indicator for Forex and Binary Options. Reliable signal algorithm. Indicator not repaint. Indicator working hours: 21:55-23:00. GMT+2. Average winrate = 60-70%.
Recommendations: Timeframe: M5. Expiration: 2-3 candles (1 candle = 5 minutes) Symbol: EURUSD, USDJPY, EURAUD, GBPAUD, EURJPY, AUDUSD, USDCAD, NZDUSD, AUDCAD, AUDCHF, AUDJPY, AUDNZD, CADJPY, EURCAD, EURGBP, GBPUSD, GBPCAD, NZDJPY, CADJPY, XAUUSD
FREE

Индикатор Currency Strength Matrix (CSM) показывает текущую силу основных валют на нескольких таймфреймах, позволяя сортировать валюты по силе и обнаруживать потенциально прибыльные пары. Индикатор идеален для скальпинга и во время резких сильных движений.
Как она работает? CSM сравнивает значение текущей скользящей средней с такое же скользящей средней на предыдущей свече для всех 28 пар и 9 таймфреймов, формируя таблицу силы всех отдельных валют. Затем валюты сортируются по силе на определен
FREE

Преимущества: Основан на классических индикаторах - ATR, Moving Average Определяет тренд/флэт на рынке, подкрашивая гистограмму соответствующим цветом Стрелками обозначены подтвержденные сигналы Является отличным фильтром для канальных стратегий (по экстремумам) Подпишись на мой telegram канал, ссылка в контактах моего профиля .
Настройки:
Наименование Описание настройки Period of Flat Detector Количество баров/свеч для анализа Period of EMA Период EMA (Moving Average) Period of ATR Пер
FREE

YOU CAN NOW DOWNLOAD FREE VERSIONS OF OUR PAID INDICATORS . IT'S OUR WAY OF GIVING BACK TO THE COMMUNITY ! >>> GO HERE TO DOWNLOAD
The popular saying in forex "The Trend is your friend" has always stood the test of time because it is valid statement for every generation of traders and in every market. Most successful traders do not fight against the trend but lend to flow with it.
Sometimes finding the best pair to trade can be a daunting task even when you have a good strategy . Som
FREE

本指标 基于 Zigzag 基础上... 增加了: 1.增加了箭头指示,使图表更鲜明 2.增加了价格显示,使大家更清楚的看清价格. 3.增加了报警等设置,可以支持邮件发送 原指标特性: 1.基本的波段指标构型. 2.最近的2个ZIGZAG点不具有稳定性,随着行情而改变,(就是网友所说的未来函数) 3.原指标适合分析历史拐点,波段特性,对于价格波动有一定的指导性.
Zigzag的使用方法一 丈量一段行情的起点和终点 (1)用ZigZag标注的折点作为起点和终点之后,行情的走势方向就被确立了(空头趋势); (2)根据道氏理论的逻辑,行情会按照波峰浪谷的锯齿形运行,行情确立之后会走回撤行情,回撤的过程中ZigZag会再次形成折点,就是回撤点; (3)在回撤点选择机会进场,等待行情再次启动,止损可以放到回撤的高点。 一套交易系统基本的框架就建立起来了。 Zigzag的使用方法二 作为画趋势线的连接点 趋势线是很常见的技术指标,在技术分析中被广泛地使用。 但一直以来趋势线在实战中都存在一个BUG,那就是难以保证划线的一致性。 在图表上有很多的高低点,到底该连接哪一个呢?不同的书上画趋势线的方
FREE

Простой и эффективный трендовый индикатор. Будет хорошим помощником при торговле. Минимум понятных настроек. Ставите его на график и настраиваете. Хорошо совмещать с другими индикаторами. Скоро выложу еще один индикатор тренда. Сочетание этих двух индикаторов дает хорошие результаты. Работает на всех таймфреймах. Подходит для любой пары. Экспериментируйте, настраивайте, наблюдайте. Фильтруйте более старшими таймфреймами. тут может быть интересно https://t.me/indicatfor
FREE

Defining Range ( DR ) and Implied Defining Range ( IDR ) indicator
Show DR and IDR ranges on the chart for Regular , Overnight and After Sessions
for more information how DR and IDR work and the high probability watch : https://www.youtube.com/@themas7er or https://twitter.com/IamMas7er
Remember to set set your chart TimeZone when you attach indicator to the chart under indicator settings / inputs
Volume Imbalance : https://www.mql5.com/en/market/product/91165?source=Site+Pr
FREE

Heiken Ashi Button Heiken-Ashi , often spelled Heikin-Ashi, is a Japanese word that means "Average Bar." The Heiken-Ashi approach can be used in conjunction with candlestick charts to spot market trends and forecast future prices. It's useful for making candlestick charts easier to read and analysing patterns. Traders can use Heiken-Ashi charts to determine when to stay in trades while the trend continues and close trades when the trend reverses. The majority of earnings are made when markets a
FREE
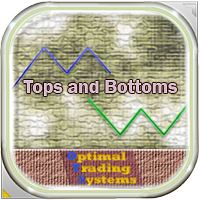
Данный индикатор находит фигуры технического анализа "Двойное дно" и "Двойная вершина", показывает их на графике валютной пары и может сигнализировать, если фигура была сформирована недавно. Эти фигуры являются разворотными, часто после из появления тренд поворачивает обратно или происходит коррекция. Чтобы не искать их самостоятельно, достаточно добавить индикатор на график, после этого, можно изменять разные таймфреймы, чтобы быстро найти такие фигуры на одном из тайфреймов. Имеются некоторые
FREE

Trend Lines Cross This indicator will alert you on any cross of a Trendline. You can draw up to two trend lines and form a channel, a pennant , a triangle or a simple trend and when the price crosses either trend line the indicator will provide you with alerts that you define plus an up or down arrow when the cross happened. How to: Draw the 1st trendline and name it tl1. Draw the 2nd trendline and name it tl2. Select which type of alerts you would like in the indicator properties and you a
FREE

This is a trend indicator.
Timeframe: any Symbol: any Color meaning: blue: long trend, up trend red: short trend, down trend yellow: market trend is changing Feature: 1, very easy to use, obvious signal, profitable 2, suitable to work on charts of any timeframe 2, all type of alerts 3, standard data buffers, can be easily implanted into any EA program. 4, all color customizable.
wish you like it :)
FREE

FUNDING DEVIL INDICATOR has been developed by traders for traders and is not another combination out of existing indicators or a "magic, solve all situations" tool.
PASS THE FUNDED ACCOUNTS WITH IT.
It is the answer for beginners and experienced traders about the misleading concepts of the mainstream, causing 90% of retail traders, never making a living out of trading.
Successful traders are "following the smart money" and do NOT try to catch every move from start to end. Consistent trade
FREE
Highly configurable Williams %R indicator. Features: Highly customizable alert functions (at levels, crosses, direction changes via email, push, sound, popup) Multi timeframe ability Color customization (at levels, crosses, direction changes) Linear interpolation and histogram mode options Works on strategy tester in multi timeframe mode (at weekend without ticks also) Adjustable Levels Parameters:
Williams %R Timeframe: You can set the current or a higher timeframes for Williams %R. William
FREE
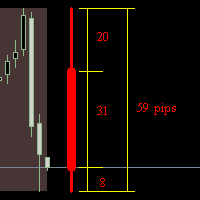
Индикатор 'рисует' дневную, недельную или месячную свечу на текущем графике. Показывает в пунктах размеры верхней и нижней тени, тела и всей свечи. Работа в реальном времени. Работает в тестере стратегий. Параметры индикатора: How_much_to_show - сколько показать блоков. Block_period - период блока (день/неделя/месяц)
Shift - смещение от края графика в барах. language - выбор языка.
FREE

Дневные ровни разворота достаточно важны в торговле. Данный индикатор позволяет выбрать четыре часто используемых типа расчета пивотов.
Входные параметры Выберите тип расчета точек разворота (Method Classic, Method Camarilla, Method TomDeMark или Method Fibonacci) Выберите таймфрейм, используем для расчетов (M5, M15, H1, H4, D1, W1 и т.д.) Можно запускать на любом таймфрейме Настройте цвет пивотов
FREE

Индикатор ищет зоны покупки и продажи, где можно открыть сделку с минимальным стоп-лоссом и лучшим соотношением риск/прибыль (Risk Reward Ratio). В основе индикатора - качественный поиск паттерна Двойная вершина/Двойное дно. Эта версия работает только на паре USDCAD! Полностью рабочую версию индикатора можно купить здесь - https://www.mql5.com/ru/market/product/29820
Принцип работы индикатора Ищет локальные вершинки/низинки, которые потенциально смогут стать Разворотной зоной Ожидает импульсно
FREE

Устали тратить время на поиск общей стоимости линий TP и SL на графиках Metatrader? Тогда у нас есть решение для вас. Представляем наш бесплатный индикатор MT4, который позволяет легко отслеживать общий SL и TP ваших позиций на любом углу экрана. С настраиваемыми параметрами X-Y и вариантами цвета вы можете настроить экран под свой стиль торговли. Попрощайтесь с неудобствами и путаницей при отслеживании ваших позиций и принимайте более умные торговые решения легко и уверенно. Не упустите возможн
FREE

RaysFX Supertrend + Alert RaysFX Supertrend è un indicatore di tendenza superiore progettato per i trader che desiderano avere un vantaggio nel mercato. Questo indicatore utilizza una combinazione di CCI (Commodity Channel Index) e ATR (Average True Range) per identificare le tendenze del mercato e fornire segnali di trading accurati. Caratteristiche principali Indicatori CCI e ATR: Utilizza due degli indicatori più popolari e affidabili per identificare le tendenze del mercato e generare segnal
FREE
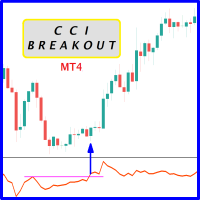
Probability emerges to record higher prices when CCi oscillator breaks out oscillator historical resistance level when exhibit overbought values. Since, oscillator breakout of support and resistance have similar effect as price breaks support and resistance levels, therefore, its highly advised to confirm price breakout with oscillator breakout; certainly, will have the same output in short trades. Concept is based on find swing levels which based on number of bars by each side of peak or trough
FREE

TREND MATE is an useful indicator that will support your decision to trade according to the current trend. It is possible to configure alert and push notification to receive when entering to first candle for bull / bear trend. If you want to use this indicator for a EA, use the function iCustom as follows:
DOWNTREND : iCustom(NULL,0,"Trend_Mate",0,0) . If downtrend result is "1", otherwise is "0".
UPTREND : iCustom(NULL,0,"Trend_Mate",1,0) . If uptrend result is "1", otherwise is "0".
Fo
FREE

All traders should know the trend before making their decision when placing the buy or sell orders. The first step always starts with supply and demand , rising and falling channels , trend lines, engulfing candles etc. All the above contribute to what is called “Price Action” and that is the best and most reliable way in trading and catching the trend and making profits, without stress. The Investment Castle Trend Line Indicator will automatically draw the trend lines on the MT4 for you. An
FREE

See RSI values turned into colored candles
This indicator provides both colored candles and a colored moving average. 6 drawaing styles are provided to allow customization of the color coding.
Applying coding to the chart may help in conceptualizing price trend and impulse movements defined through RSI values.
Features - optional colored candles - optional colored ma - 6 draw styles; RSI slope RSI above/below overbought/oversold levels RSI above/below level 50 RSI above/below it's moving aver
FREE

Never miss a trend change again! This indicator uses various calculation methods based on price action to detect changes in the direction of the trend. It can be used on high timeframes (from H1 to D1) and is most suitable for H4 and Daily timeframe. This indicator is compatible with all broker symbols (forex, indices, CFD, commodities, crypto…). It is also possible to open the indicator on several charts to follow several symbols at the same time. In addition, you don't have to stand by your P
FREE

Индикатор Pattern Detector находит наиболее популярные свечные паттерны из 1, 2 и 3 свечей и отправляет уведомления при их нахождении. Демо-версия, работающая на AUDNZD, доступна по ссылке: https://www.mql5.com/ru/market/product/29189
Принципы работы Прикрепите индикатор на график, который хотите проанализировать, и выберите паттерны, которые нужно найти. Индикатор будет отображать найденные паттерны. Также индикатор может отправлять уведомления о найденных паттернах в терминал, на мобильный т
FREE

Индикатор Profit/Loss Meter позволяет измерить Прибыль/Убыток будущей, прошлой или текущей сделки в валюте депозита и оценить уровень маржи на момент окончания сделки. Индикатор работает на базе встроенного МТ4 инструмента "Перекрестие" и имеет следующие параметры: Trade Direction = Buy/Sell Направление позиции Lot size = 0.1 Размер лота Font size = 8 Размер шрифта Font color = DeepSkyBlue Цвет шрифта Offset horizontal Сдвиг текста по вертикали Offset vertical Сдвиг текста по горизонтали
FREE

Индикатор Camarilla Pivots Historical строит на графике исторические данные по уровням пивотов Камарилья. Уровни пивотов Камарилья были разработаны в 1989 году Ником Скоттом. Эти уровни используются в качестве основных уровней поддержки и сопротивления при внутридневной торговле. Уровни вычисляются по следующей формуле: R4 = C + RANGE * 1.1/2 R3 = C + RANGE * 1.1/4 R2 = C + RANGE * 1.1/6 R1 = C + RANGE * 1.1/12 PP = (HIGH + LOW + CLOSE) / 3 S1 = C - RANGE * 1.1/12 S2 = C - RANGE * 1.1/6 S3 = C -
FREE

ФТУ Фибоначчи
Этот индикатор рисует уровни Фибоначчи для уровней восстановления от ценового действия.
Функции:
Регулировка нескольких уровней Фибоначчи Изменить цвет и количество баров из диапазона
2 линии для 50-барной истории, 2 линии для 20-барной истории, обе показывают уровни Фибоначчи 38 и 61
Использование:
Цель состоит в том, чтобы изучить или измерить откат цены. Изменение цвета и количества баров из диапазона Использование на любом таймфрейме, продукте/паре, без пере
FREE

Индикатор Vortex был разработан Этьеном Ботесом и Дугласом Сипмэном. Индикатор Vortex состоит из двух осцилляторов, которые улавливают положительные и отрицательные трендовые движения. В процессе создания индикатора авторы полагались на работы Уэллса Уайлдера и Виктора Шаубергера, который является отцом имплозивной технологии. Несмотря на сложную формулу, данный индикатор достаточно прямолинеен и прост в интерпретации. Бычий сигнал появляется тогда, когда индикатор положительного тренда (зеленая
FREE

Тренд индикатор Уникальная система определения тренда для каждого таймфрейма,
Позволяет по любой валютной паре иметь реальную картину тренда по всем стандартным таймфреймам! Зеленые квадратики BUY тренд а красные SELL.
Техника торговли если мелкие тайм фреймы противоположны тренду старших то по инерционости движения рынка вход по старшим таймам как на скринах.
FREE

Simple Trading System Update !!! Follow this link to see our 2024 Strategy !!! ( Download the EAs scanner )
INTRODUCTION : The strength meter is an trading tool that is used to identify trending and consolidating markets based on the percentage rate.
HOW TO USE IT :
You can use this indicator with Deal Trading Trend >> Click Here << To use this trading tool to identify trending and consolidating markets (the most important part)
FREE

Informative & optimized Zigzag, Accumulated volume, Price change A rewrite of the traditional zigzag tool with new additions. Features:- Optimized code Displays accumulated volume between peaks Displays price change between peaks Usage:- Identify trend swings Identify high volume swings Compare price changes between swings Drawing Fibonacci tool on strong price change or high volume swings
FREE

STOCH AND RSI ALERT https://www.mql5.com/en/users/earobotkk/seller#products (I have created a dashboard from this product, please take a look by clicking here ) (I have also created an EA from this product, NOW user can go automation, click here ) P/S: If you like this indicator, please rate it with 5 stars in the review section, this will increase its popularity so that other users will be benefited from using it. This indicator notifies and draws an arrow on the chart whenever the main sto
FREE

The three white soldiers and the three black crows candlestick patterns are reversal patterns that predict a change in the direction of a trend. The pattern consists of three consecutive long-bodied candlesticks that open within the previous candle's real body and a close that exceeds the previous candle's. It's important to note that both formations are only valid when they appear after a strong uptrend or a downtrend, while their efficiency decreases in choppy markets.
Inputs AlertOn - e
FREE

MT4 Candlestick Pattern Alert Indicator: Stay Ahead of Trading Opportunities Overview The MT4 Candlestick Pattern Alert Indicator is a robust tool designed to empower traders by detecting candlestick patterns and delivering timely alerts through notifications, emails, and pop-up alerts. This invaluable tool saves traders precious time, allowing focused analysis on patterns and potential profitable trades. Importance of Candlestick Patterns Candlestick patterns are pivotal in technical analysis,
FREE

The Pivot Indicator is a vital tool for technical analysis used by traders in the financial markets. Designed to assist in identifying potential reversal points or trend changes, this indicator provides valuable insights into key levels in the market. Key features of the Pivot Indicator include: Automatic Calculations: The Pivot Indicator automatically calculates Pivot Point, Support, and Resistance levels based on the previous period's high, low, and close prices. This eliminates the complexity
FREE
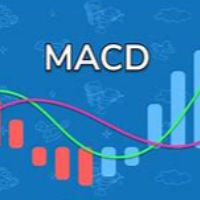
This is a custom indicator based on the Exponential Moving Average (EMA) angle, typically used to measure the trend angle of EMA lines. Here are the main parameters and functions of this indicator: Main Parameters: md1: Fast period for EMA, default value is 12. md2: Slow period for EMA, default value is 26. md3: Period for the MACD signal line, default value is 9. Functions: The indicator calculates the MACD indicator and categorizes data into different buffers based on the direction and angle o
FREE

AdvaneZigZag Indicator
Are you tired of the limitations of the traditional ZigZag indicator? Meet AdvaneZigZag, the ultimate tool to simplify your market structure analysis and enhance your trading strategies. Designed with flexibility and precision in mind, AdvaneZigZag brings you advanced features to navigate the market with confidence.
Key Features:
1. Enhanced Flexibility:
- While maintaining the familiar simplicity of the conventional ZigZag indicator, AdvaneZigZag offers superi
FREE

This automated DOJI BAR FINDER INDICATOR can be utilized to manage trades and identify potential areas of support and resistance for both buying and selling. It is designed to identify zones for Sell/Buy trades and can be effectively used in conjunction with other indicators, such as order block indicators, and more. Currently designed for MT4, it will later be adapted to function on MT5. We also offer the opportunity to customize the robot according to your trading strategy. https://t.me/FXTSPr
FREE

As per name Strength, This Indicator is a affordable trading tool because with the help of Popular Developers & Support of M Q L Platform I have programmed this strategy. I tried to input different types and different periods of Calculation regarding Support Resistance, Trends, Trend lines, Currency Strength, Oversold and Overbought Indications for good results. Furthermore, I have also care about Adjustable Settings So Trader can easily get in touch with market in another way also. What
FREE

The Multi Trendlines indicator automatically draws the dominant trendlines on the current chart. The indicator looks for the 5 best Up trends and the 5 best Down trends as at the current price, drawing each trendline if filter conditions are met. The trendlines are named "Trendline"+[Direction]+Symbol()+TrendlineSequenceNumber For example: The second Up trendline on a EURUSD chart would be named "TrendlineUpEURUSD2". To get its current value would be: ObjectGet("TrendlineUpEURUSD2",OBJPROP_PRI
FREE

[Отклонение каждого показателя MT4] представляет собой набор из 18 показателей, и один из них может быть произвольно выбран для участия в расчете. Он может рассчитать форму отклонения каждого индикатора и может вызвать тревогу.
Описание настройки параметров:
[показатели] - выбрать один из 18 показателей для участия в расчете (этот параметр очень важен) .
[period] - это общий цикл для каждого индикатора.
[Метод] является режимом MA некоторых индикаторов.
[Apply_to] - цена приложения н
FREE

Представляем Ms. Fibonacci , мощный и бесплатный индикатор, разработанный для упрощения процесса рисования и корректировки уровней Фибоначчи на графике. Этот индикатор автоматически идентифицирует и отмечает новые самые высокие и самые низкие уровни Фибоначчи, обеспечивая точное и точное размещение. Одной из ключевых особенностей Ms. Fibonacci является его способность правильно рисовать уровни Фибоначчи, указывать точки на точки и отмечать соответствующие ценовые уровни. Эта функция экономи
FREE

Индикатор позволяет с легкостью размечать на графике настраиваемые уровни дневного открытия. Во многих торговых стратегиях дневное открытие является важным уровнем для принятия торгового решения. Данный индикатор как раз призван помочь в работе с такими стратегиями и в дальнейшей их оптимизации, а также в общем понимании движения рынков. С помощью этой инструмента вы можете легко посмотреть предыдущее ценовое действие вокруг таких уровней дневного открытия, даже на других часовых поясах.
Функц
FREE

This comprehensive technical indicator calculates and plots up to 3 moving averages with 3 different periods. By employing three moving averages of distinct lookback periods, the trader can confirm whether the market has indeed experienced a change in trend or whether it is merely pausing momentarily before resuming its prior state. SX Golden MA Pack for MT5 is available here . The shorter the moving average period, the more closely it tracks the price curve. When a security initiates an upt
FREE

RSI Candle Signal Indicator will change bars’ color when set overbought or oversold levels reach.
How to Use RSI Candle Signal Uptrend/Downtrends - RSI may be used to detect trending markets. For example, the RSI may stay above the mid line 50 in an uptrend. Top and Buttoms - RSI may help in identifying the tops around the overbought readings (usually above 70), and the bottoms around the oversold area (usually below 30). Divergence - divergence occurs when RSI directional movement is not c
FREE

С помощью индикатора можно 1 Выявлять тренд и идти за большим и малым трендом прокладывая линии. Когда цена выходит из коридора линий, то с большой вероятностью цена пойдёт до следующей линии и развернётся на ней.
2 Долгострочно - Прокладывать линии по центрам фракталов, индикатор может выявлять фрактал второй точки ( Number bars analysis). Зачастую цена может приблизиться к линии даже через неделю или месяц и можно открывать сделку на разворот. Если волна прошла широкая и мы хотим поймать разв
FREE

FALCON ZONES , OPORTUNIDADES EN EL MERCADO PARA COMPORAR O VENDER
Características Destacadas: Identificación de Patrones de Velas: Reconoce una amplia gama de patrones de velas, desde patrones simples hasta formaciones más complejas. Proporciona una visión completa de la psicología del mercado encapsulada en las velas. Alertas Personalizadas: Configura alertas a medida para los patrones de velas que más te interesan o que se alinean con tu estrategia. Recibe notificaciones instantáneas cuando
FREE

Features:
1- Get OB/OS Levels from Golden MA Levels
2- Wait for Buy/Sell Start Level Cross
3- Optional: Should price cross Mid Level in earlier bars
4- Optional: Crossing bar High/Medium Volume
5- Optional: MA Stacked to check up/down trend for current TF
6- Optional: NRTR higher timeframes aligned Check
Detailed blog post explained: https://www.mql5.com/en/blogs/post/758457
Levels with Buffers available here: Golden MA Levels Indicator: https://www.mql5.com/en/market/product/119515
FREE
MetaTrader Маркет - уникальная площадка по продаже роботов и технических индикаторов, не имеющая аналогов.
Памятка пользователя MQL5.community расскажет вам и о других возможностях, доступных трейдерам только у нас: копирование торговых сигналов, заказ программ для фрилансеров, автоматические расчеты через платежную систему, аренда вычислительных мощностей в MQL5 Cloud Network.
Вы упускаете торговые возможности:
- Бесплатные приложения для трейдинга
- 8 000+ сигналов для копирования
- Экономические новости для анализа финансовых рынков
Регистрация
Вход
Если у вас нет учетной записи, зарегистрируйтесь
Для авторизации и пользования сайтом MQL5.com необходимо разрешить использование файлов Сookie.
Пожалуйста, включите в вашем браузере данную настройку, иначе вы не сможете авторизоваться.