MetaTrader 4용 무료 기술 지표 - 7

MT4용 R 2EMA 색상 표시기는 2 EMA의 교차를 기반으로 견고한 거래 신호를 제공합니다.
키 포인트 가격이 두 개의 녹색 EMA 위로 교차하고 닫히면 구매 거래 신호가 생성됩니다. 가격이 두 개의 빨간색 EMA 위로 교차하고 닫히면 매도 거래 신호가 생성됩니다. R 2EMA Color Forex 지표를 사용하면 구매 및 판매 시점을 더욱 쉽게 결정할 수 있습니다.
2개의 EMA 라인이 녹색으로 바뀌면 매수 신호가 발생합니다. 2개의 EMA 라인이 빨간색으로 바뀌면 매도 신호가 발생합니다. 그것으로 거래하는 방법? 두 개의 EMA 신호선이 빨간색에서 녹색으로 바뀌는 즉시 구매 거래를 시작하면 이제 추세가 긍정적입니다. 두 개의 EMA 신호선이 녹색에서 빨간색으로 바뀌는 즉시 매도 거래를 시작하십시오. 추세는 이제 음수입니다. 차트에서 반대 거래 신호가 발생하면 거래를 종료하십시오.
좋아하는 거래 방법을 자유롭게 사용하여 R 2EMA 색상 표시기로 거래를 열고 닫으십시오.
FREE

False Breakout Stochastic to be used with our Elliott Wave Indicator as part of the overall strategy on trading the 5th wave.
As we cannot upload multiple files, we have listed this separately. False Breakout Stochastic is best used as a confirmation tool rather than the sole signal indicator The Elliott Wave Indicator Suite is designed around a simple but effective Swing Trading Strategy. The Indicator Suite is great for Stocks, Futures and Forex trading on multiple timeframes You can find the
FREE
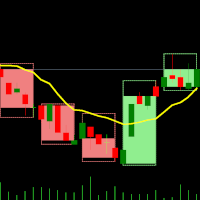
MT4용 듀얼 타임프레임 인디케이터 – 캔들 인 캔들 개요 캔들 인 캔들 인디케이터는 MT4 전용으로 설계된 멀티 타임프레임 시각화 도구입니다. 이 인디케이터는 낮은 타임프레임 차트 위에 높은 타임프레임의 캔들을 중첩시켜 표시함으로써, 작은 캔들이 큰 캔들 내부에서 어떻게 움직이는지 확인할 수 있습니다. 이 접근법은 시장 구조 분석을 향상시키고, 추세 식별을 명확하게 하며, 가격 움직임을 쉽게 파악할 수 있게 해줍니다 – 별도의 차트 전환 없이 말이죠. 작동 방식 낮은 타임프레임 선택:
분석하고자 하는 타임프레임(M1, M5, M10 등)에서 MT4 차트를 엽니다. 배수 적용:
높은 타임프레임의 캔들 구조를 동적으로 생성하기 위해 배수를 선택합니다. 예시: M1 차트에서 배수 5 → M1 캔들이 M5 캔들 내에 표시됩니다. M10 차트에서 배수 6 → M10 캔들이 H1 캔들 내에 표시됩니다. 높은 타임프레임 캔들의 중첩 표시:
인디케이터는 선택한 높은 타임프레임의 OHLC(시
FREE

This is a Sharkfin Arrows Indicator. Detailed explanation and TDI extras: https://www.mql5.com/en/blogs/post/759138
This indicator will show only Arrows. It does not have TDI symbols on chart. Please get the extras from links above for TDI indicators.
Sharkfin Scanner (paid): https://www.mql5.com/en/market/product/123566
TDI Scanner Dash (paid): https://www.mql5.com/en/market/product/41826
About: This Indicator finds the Shark Fin Pattern. It will show an arrow in the current bar if RSI sha
FREE

As you know, the price always moves in a certain channel and when the price goes out of the channel, it always tends to return back to the trading channel The Ind Channel Exit indicator will help you not to miss the price going out of the channel It can show an alert or send a message to the terminal on your smartphone that the next bar has closed above or below the channel levels It has a minimum number of settings and the main parameter is the Channel Multiplier , which determines the width o
FREE

TG MTF MA MT5 is designed to display a multi-timeframe moving average (MA) on any chart timeframe while allowing users to specify and view the MA values from a particular timeframe across all timeframes. This functionality enables users to focus on the moving average of a specific timeframe without switching charts. By isolating the moving average values of a specific timeframe across all timeframes, users can gain insights into the trend dynamics and potential trading opp
FREE

INFOPad는 MetaTrader 4 터미널에서 선택한 통화 쌍에 대한 정보를 생성하는 정보 패널입니다. 이 표시기에는 5가지 기능이 있습니다. 선택한 기호에 대한 주요 및 주요 정보를 표시합니다. 매도호가 매수, 스프레드, 스탑 레벨, 스왑, 틱 값, 수수료 가격; SL 목표와 TP 목표의 미래 목표를 보여줍니다(설정된 손절매와 이익실현의 포인트 수, 달러 금액). 그것은 기간 동안 받은 이익을 보여줍니다: 오늘, 주, 월, 연도, 선택한 통화에 대한 총 이익; 현재 오픈 포지션, 로트(볼륨), 포지션 수, 포지션 이익(포인트, 달러, 퍼센트)을 보여줍니다. 미결 거래에 대한 차트에 대한 추가 정보를 표시합니다. 그것은 손절매 및 이익 수준 및 이러한 정지 수준의 목표를 보여줍니다. 심볼에서 트랜잭션이 열리거나 트랜잭션이 닫히거나 트랜잭션이 수정될 때 로그 파일에 정보를 기록합니다. 거래를 열 때, 거래를 닫을 때, 거래를 수정할 때 사운드 파일을 재생합니다. 거래 개시, 거래
FREE

Galaxy Force Analyzer - is an intelligent indicator for analyzing market volume and strength. It combines data from indicators like Force, OBV, MFI, AD, and others with advanced algorithms for acceleration and filtering to show the energy of price movement — the moment when a trend gains strength or begins to weaken. The indicator doesn’t just display volume — it measures impulse power, acceleration, and the speed of pressure changes between buyers and sellers.
Signals: Everything on the chart
FREE

This indicator mostly inspired from BW-ZoneTrade custom indicator from MT5. How To Use:
BUY when both dots colored Green. SELL when both dots colored Red. In addition to original one, MACD-OsMA-generated signal also can be drawn. Input Description:
MA_period_short: Faster EMA period for MACD. Applied when drawMACD is true. MA_period_long: Slower EMA period for MACD. Applied when drawMACD is true. MACDperiod: MA period for MACD. Applied when drawMACD is true. drawMACD: When true, draw an additi
FREE
설명:
MetaTrader 4용 NR4 & NR7 Inside Bar Highlighter 는 NR4 또는 NR7 과 Inside Bar 의 조합에 기반한 가격 압축 패턴을 자동으로 감지하는 지표입니다. 작동 방식:
**NR4 (Narrow Range 4)**는 최근 4개 봉 중 범위가 가장 좁은 봉을 식별하고, NR7 은 최근 7개 봉을 고려합니다. 이러한 좁은 범위 조건이 Inside Bar (이전 봉 안에 완전히 포함된 봉)과 동시에 발생하면, 종종 강력한 브레이크아웃 이전의 저변동성 국면을 시사합니다. 이 패턴들은 브레이크아웃 전략에서 널리 활용됩니다. 강조된 신호:
지표는 차트 상에서 관련 봉들을 설정 가능한 색상으로 표시합니다: NR4 + Inside Bar: 흰색 NR7 + Inside Bar: 주황색 각 신호에는 시각적 식별을 위한 라벨도 함께 표시됩니다. 통합 및 알림:
이 시스템은 MetaTrader 4에서 시각적 알림 , 이메일 , 사운드 또는 맞춤형 트레
FREE
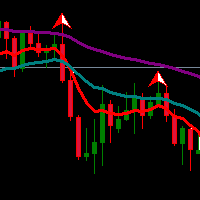
Exponential Moving Average (EMA) is an indicator that often be used by traders. Combination of two or three EMA indicators often applied to determine trend direction. Multiple EMA combined with fractals or oscillator indicator to detect overbought/oversold and divergence point also great to do in trading system.
If you like EMA indicator and want to get better indicator, highly recommended using EMA SuperTrend Strategy Indicator if you want to get better result in here:
https://www.mql5.com/en
FREE

프리메이슨은 전문 분석가 만들 것입니다 도구입니다! 경사 채널을 사용하여 파동 움직임을 결정하는 방법은 모든 악기의 움직임 회로도를 질적으로 전달하여 시장에서 가능한 역전뿐만 아니라 추가 움직임의 목표를 보여줍니다!시장이 살아 있다는 신화를 파괴하고 한 범위에서 다른 범위로 이동하는 회로도를 명확하게 보여줍니다! 현재 추세의 정의와 중기에 적합한 전문 도구! 프리메이슨은 전문 분석가 만들 것입니다 도구입니다! 경사 채널을 사용하여 파동 움직임을 결정하는 방법은 모든 악기의 움직임 회로도를 질적으로 전달하여 시장에서 가능한 역전뿐만 아니라 추가 움직임의 목표를 보여줍니다!시장이 살아 있다는 신화를 파괴하고 한 범위에서 다른 범위로 이동하는 회로도를 명확하게 보여줍니다! 현재 추세의 정의와 중기에 적합한 전문 도구!
FREE

The MACD 2 Line Indicator is a powerful, upgraded version of the classic Moving Average Convergence Divergence (MACD) indicator.
This tool is the embodiment of versatility and functionality, capable of delivering comprehensive market insights to both beginner and advanced traders. The MACD 2 Line Indicator for MQL4 offers a dynamic perspective of market momentum and direction, through clear, visually compelling charts and real-time analysis. Metatrader5 Version | How-to Install Product | How-to
FREE
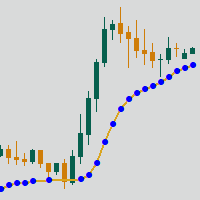
Adaptive Moving Average (AMA) is a trend indicator using moving average and market noise filter. Indicator feature are blue and red points, showing the power of trend. Recommendations for trading: Auxiliary Indicator Detecting trend Detecting power of trend Detecting potential reversal points Main indicator Shows entry points for swing trading Serves as dynamic support and resistance Recommendations for use: Any instrument Any timeframe Input parameters: Period - AMA period Fast Period - fast
FREE

RCI (Rank Correlation Index) 인디케이터 개요 RCI(Rank Correlation Index) 인디케이터는 가격 데이터의 순위 상관관계를 바탕으로 시장의 트렌드와 전환점을 분석하는 오실레이터형 도구입니다.
지정된 기간 동안 가격 순위와 시간 순위를 비교하여 -100에서 +100까지의 상관계수로 산출하며, 간단한 라인 형태로 차트에 표시됩니다.
RCI는 시장 모멘텀 파악, 매수·매도 타이밍, 추세 추종 및 역추세 전략 모두에 널리 활용됩니다. 주요 특징 RCI 값이 +100에 가까우면 강한 상승, -100에 가까우면 강한 하락, 0 부근은 전환 또는 횡보 국면을 나타냅니다. 차트상에 심플한 라인으로 표시되어 직관적으로 확인할 수 있습니다. 순위 상관 알고리즘을 사용하여 고유의 트렌드 및 타이밍 분석 제공 역추세 및 추세추종 전략 모두에 활용 가능 파라미터 파라미터 설명 RCI Period RCI 계산에 사용되는 기간(예: 9, 14, 20 등 자유롭게 설정 가
FREE

Please check the " What's new " tab regularly for a complete and up-to-date list of all improvements + parameters. FREE indicator for my trading utility Take a Break . This indicator allows you to manage multiple other EAs with just one Take a Break EA instance. Simply specify the corresponding Chart Group in the indicator(s) and Take a Break EA settings and you are good to go.
Setup examples (Indicator + EA)
As a prerequisite, add the URL https:// trading.custom-solutions.it to the list of a
FREE

It is a custom non-repaint indicator to identify trade opportunities in swing action as prices move within an upper and lower band. Inspired by the Keltner Channel, the most popular channel Indicator introduced by Chester Keltner. It is different with a Bollinger Bands. It represents volatility using the high and low prices, while Bollinger's studies rely on the standard deviation. The algorithm for this indicator is also available in the EntryMaximator EA. Including the option to use it or not.
FREE

This indicator displays pivot points in the chart, including historical vales, and supports many calculation modes for Pivot Points and S/R levels. [ Installation Guide | Update Guide | Troubleshooting | FAQ | All Products ] It plots historical levels for backtesting purposes
It allows you to select the reference timeframe It implements different Pivot Point calculation modes It implements different SR calculation modes
It implements customizable colors and sizes
Calculation Modes The indicator
FREE

RSI TrendGate 3MA는 RSI와 3개의 이동평균선(MA)을 조합하여 추세 방향을 더 명확하게 확인할 수 있도록 돕는 차트 표시용 인디케이터입니다.
선택한 조건에 따라 시장 상태가 “상승 우위” 또는 “하락 우위”로 판단될 때, 차트 창에 화살표를 표시합니다. 이 제품은 화살표를 단독 매매 신호로 사용하도록 설계되지 않았습니다. 권장 사용 방식은 상위 시간대에서 방향을 확인하고, 하위 시간대에서는 사용자의 자체 규칙으로 진입 타이밍을 결정하는 운용입니다. 개요 본 인디케이터는 다음 요소를 기반으로 방향을 판정합니다. 3개 MA의 정렬로 레짐 판정(방향의 기반)
단기/중기/장기 3개 MA를 계산하고, 정렬 상태에 따라 시장을 분류합니다. 상승 레짐: MA Short > MA Mid > MA Long 하락 레짐: MA Short < MA Mid < MA Long 레짐 없음: 그 외의 상태(MA가 서로 얽혀 방향이 명확하지 않음) 단기 MA 기울기 필터(선택)
단기 MA의 기울기
FREE

This indicator shows the breakeven line level for the total number of open positions of the current symbol with P/L value and total volume. This indicator is helpful to decide the exit level when using a trading grid strategy. The style of the breakeven line is customizable to choose the color, line shape and font size of the positions description. Send mobile notification when crossing a positive P/L target
FREE

This is the free version of the Supply&Demand + Trendline + Trend tool. This version works only with EURCHF! You find the full version here: https://www.mql5.com/en/market/product/67274
PAAIOS stands for Price Action All In One Solution. And that is the purpose of the Indicator. It should give you a tool to improve your trading decisively because you get the crucial information at a glance. The indicator simplifies the search for strong signals. It shows trend lines, demand and su
FREE
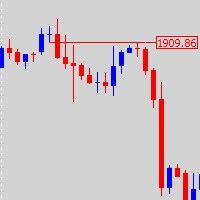
This is a combine that combines the ATR, Candle Timer, Watermark indicators and a tool for working with graphical objects, which allows you to reduce the time for marking charts. Functionality: Levels and proteins with price tags; drawing strictly horizontal levels; continuous zigzag manually; expansion / truncation of lines, wrinkles; quick change of colors and fonts and shapes; Filling/removing the filling of vessels, triangles, ellipses; dragging by 1 (first) point and auto alignment of the h
FREE

This is an indicator for Quasimodo or Over and Under pattern. It automatically finds the swing points and can even place virtual trades with stop loss and take profit. Press the "Optimize" button to automatically find the most effective settings. The pattern consists of four legs A,B,C,D as shown in the pictures. Open and close prices of the virtual trades are Bid price but the statistics in Display Panel take current spread into account. Its parameters are explained below. Buffer - Pips distanc
FREE
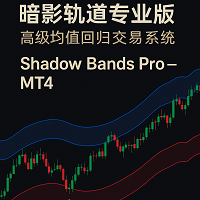
Shadow Bands Pro – MT4 说明(中英文) English Description (MT4) Shadow Bands Pro – Advanced Reversion System for MT4 Shadow Bands Pro is a non-repainting (on candle close) trend-reversal and mean-reversion indicator designed for traders who need clear, rule-based entries and exits.
By combining a dynamic volatility band, entity-break logic, and a built-in statistics panel, it helps you quickly see where price is stretched and where high-probability reversals may occur. Key Features Non-repainting on
FREE

Market Insider is an excellent indicator for scalping the trend and also trading market breakouts and reversals. It is based on a ATR measured volatility channel and the CCI indicator. The green trend line and green bars indicates an uptrend and the red trend line and red bars indicates a downtrend. An intensive price breakout of some of the trend lines indicates a market breakout and a potential new opposite trend. In choppy-range behaving market and in low liquidity conditions the breakout sig
FREE

TRADING FLOW USING AUTO FIBO MUSANG + ALERT SIGNAL 1. Wait for Breakout Alert (Auto Signal) The Auto Fibo Musang system will automatically trigger an alert when a potential breakout is detected from previous price structure.
This serves as the early signal that the market may be ready to move. 2. Identify the Entry Zone (Auto Fibo Levels) The entry zones are auto-plotted based on Fibonacci Musang levels :
Buy Zone (blue levels), Sell Zone (red levels).
No need to draw manu
FREE

DONCHIAN CHANNEL DC It is a trend indicator developed by “Richard Donchian”, consisting of 3 layers, the upper channel, the lower channel and the middle channel. It is created on the Donchian Channel by plotting the highest and lowest prices reached in the past period on the price chart. It is also used to measure the volatility of the market, as it is an expanding/contracting channel according to the increase/decrease of price volatility. Method 0; Donchian channel indicator drawing. BUY/SELL S
FREE
이 프로그램을 사용하면 여러 시간대를 보다 편리하게 분석할 수 있습니다.
동일한 기호를 표시하기 위해 다른 시간대 동기화 차트의 모든 차트를 동기화하는 데 도움이 됩니다. 동일한 특정 기간 및 동기화 그리기 개체 모든 차트에 동시에 표시
이 에디션에는 모든 차트를 동기화할 수 있는 개체 유형이 6개뿐입니다.
그리기 개체 유형 지원: 수직/수평선, 추세선, 직사각형, 화살표, Fibo-Retracement
추가 기능: 추세선 경고 가격이 추세선에 닿을 때 경고를 받으려면 설명 필드에 추세선 속성이라는 단어를 alert 입력하기만 하면 됩니다. 가격이 추세선에 도달하면 MT4에 경고 메시지 팝업이 표시되고 MT4 앱을 통해 알림을 받습니다.
이용방법 >> https://youtu.be/NEHUW7v1h1c
다음에서 문제를 보고하거나 최신 버전 업데이트를 따르십시오.
웹사이트: www.RookieTraders.com LineID : @RookieTraders
FREE
Профессиональный индикатор "Choch Pattern Levels" с RSI-фильтром для MT4 Описание: Вы устали от ложных пробоев и хотите находить точки разворота тренда с высокой точностью? Индикатор Choch Pattern Levels — это ваш профессиональный инструмент для определения смены характера рынка (Change of Character), дополненный мощным фильтром RSI и анализом объемов , чтобы вы входили в рынок только по самым надежным сигналам. Этот индикатор автоматически находит и отрисовывает на графике ключевые паттерны раз
FREE
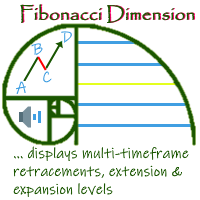
'Fibonacci Dimension' indicator allows display of preset or user-defined multi-timeframe Fibonacci levels. It automatically takes the previous high and low for two user-defined timeframes and calculates their Fibonacci retracement levels. It also considers the retraced level to draw the expansions on every change of price. A complete visual dimension in multiple timeframes allows deriving profitable strategies for execution. Enhanced functionality to view and customize the default Fibonacci Rang
FREE

Rule Plotter로 자동 거래 로봇 만들기 마우스 몇 번 클릭만으로 거래 전략을 자동화할 수 있다면 얼마나 강력할까요? 복잡한 코드를 파헤치지 않고도 다양한 거래 전략을 만들고 테스트할 수 있다면 얼마나 자유로울까요. Rule Plotter를 사용하면 이러한 비전을 현실로 만들 수 있습니다. 여기서는 Rule Plotter를 사용하여 사용자 정의 거래 로봇을 만드는 방법을 살펴보겠습니다. Rule Plotter는 전체 프로세스를 단순화하는 거래 시스템 생성 도구입니다. Rule Plotter란 무엇이며 어떻게 작동합니까? Rule Plotter는 MetaTrader의 지표를 사용하여 전문가 자문자 (EA)를 작성하기 위해 설계된 프로그램입니다. 이 도구를 사용하면 복잡한 프로그래밍 세부 사항을 이해하지 않고도 거래 전략을 자동화할 수 있습니다. 프로세스는 간단합니다. 원하는 지표를 차트에 추가하고 진입 및 종료 조건을 정의한 다음 Rule Plotter에게 나머지 일을 맡기면
FREE

Special offer in honor of the New Year and Christmas!! https://www.mql5.com/ru/users/bossik2810
Trend Filter Pro
Trend filter indicator.
Very good filter for your trading system, I recommend to use it together with - System Trend Pro or Quantum Entry PRO
The indicator no repaint!!!
Settings:
Change the Period parameter for better filtering ( default is 90)
Any questions? Need help?, I am always happy to help, write me in private messages or
In Telegram: https://t.me/Trader35_Admin
FREE

This indicator lets you easily mark the daily open levels on a chart with several possibilities of customization. For many trading strategies, the daily open level is an important level to base trading decisions on. That is why I chose to create this indicator that is designed to assist you with trading these strategies, as well as further optimizing them and getting a general understanding of the markets movements. With this tools help, you can easily take a look at the previous price action ar
FREE
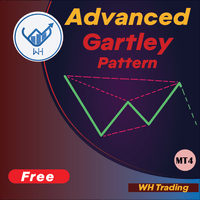
고급 Gartley 패턴 인식 표시기에 오신 것을 환영합니다. 이 지표는 가격 구조의 HH 및 LL과 피보나치 수준을 기반으로 가틀리 패턴을 감지하고 특정 피보나치 수준이 충족되면 지표가 차트에 패턴을 표시합니다. MT5 버전 : WH 고급 가틀리 패턴 MT5
**이 표시기는 콤보 의 일부입니다 WH Ultimate Harmonic Patterns MT4 , 모든 패턴 인식을 포함하는 .** 특징 : 높은 가틀리 패턴 검출을 위한 고급 알고리즘 정확도 . 매우 빠른 그리고 낮은 리소스(머신에 덜 요구됨). 아니요 지연 ...도 아니다 다시 칠하십시오 . 관습 피보나치 수준 조정(선호하는 설정에 따라 피보나치 수준을 변경할 수 있음). 보여주다 약세 그리고 강세 패턴을 동시에(약세 또는 강세 설정에 대해 여러
FREE

The MACD Signal Candle indicator changes color according to the MACD trends. Colored Candles, based on MACD.
HOW IT WORKS
For a Buy: -If the indicator is above zero, the market is bullish. -If the market is bullish, you can take a stand with green candle signals. For a Sell: -If the indicator is below zero, the market is bearish. -If the market is bearish, you can take a stand with the red candles.
FREE

The indicator synchronizes eight types of markings on several charts of one trading instrument.
This indicator is convenient to use in conjunction with "Multichart Dashboard" or other similar assistant that allows you to work with several charts at the same time.
"Multichart Dashboard" can be found under the link on my youtube channel.
Settings:
enable vertical line synchronization
enable horizontal line synchronization
enable Trend Line synchronization
enabling Fibonacci Retracement synchron
FREE

거래 정확도를 높여보세요 WH 트레이딩 세션 MT4 MetaTrader 4를 위한 지표! 이 강력한 도구는 주요 시장 세션을 손쉽게 시각화하고 관리하는 데 도움이 됩니다. 기반 : WH SMC Indicator MT4
MT5 버전 : WH 트레이딩 세션 MT5 주요 특징: 대화형 GUI 패널 – 쉽게 선택하고 전환하세요 아시아, 런던, 뉴욕 거래 세션.
사용자 정의 가능한 알림 및 설정 – 직관적인 인터페이스를 통해 전략에 맞게 지표를 조정하세요. 옵션 탭 .
빠르고 반응성이 좋은 인터페이스 – 매끄러운 경험을 즐겨보세요 이동 가능하고 최소화 가능하며 최대화 가능한 패널입니다 .
자동 GMT 오프셋 처리 – 수동 조정이 필요 없습니다. 세션은 항상 시장 시간에 맞춰 조정됩니다.
Trading Session을 통해 시장 활동을 앞서가고 거래
FREE

Bitcoin 999 - is a trend indicator that automatically analyzes the market and provides information about the trend and each of its changes, as well as giving signals for entering trades without redrawing! The indicator uses each candle, analyzing them separately. referring to different impulses - up or down impulse. Exact entry points into transactions for currencies, crypto, metals, stocks, indices!
Main functions: Accurate entry signals WITHOUT REPAINTING! Once a signal appears, it remains
FREE

TT Range – EMA & ATR Channel Indicator TT Range is a trend-following channel indicator built around an Exponential Moving Average (EMA) combined with ATR-based dynamic levels . The core concept is that the EMA acts as a price magnet —when price moves too far away from the average, it has a strong tendency to revert back toward it. The indicator plots adaptive upper and lower levels around the EMA, forming a volatility-based range that adjusts to current market conditions. These levels help trade
FREE
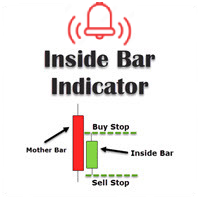
This inside bar indicator MT4 is suitable if you are doing inside bar trading. So what this MT4 inside bar indicator does is identifies inside bars for you as they form on your charts. Inside bar is a famous trading pattern in which the bar carry higher low and lower high compared with the previous bar, also known as mother bar. With, a lesser time frame like the 1 hour chart, daily inside bar chart will sometimes appears to be similar to a triangle pattern.
Inputs AlertOn - enable alerts Emai
FREE

YOU CAN NOW DOWNLOAD FREE VERSIONS OF OUR PAID INDICATORS . IT'S OUR WAY OF GIVING BACK TO THE COMMUNITY ! >>> GO HERE TO DOWNLOAD
Camarilla Pivots Historical plots the historical data of the camarilla pivot point levels on the chart. The Camarilla Pivot levels was originated in 1989 by Nick Scott. The levels are used as primary support and resistance levels by Intraday traders. The levels are calculated with the following formula: R4 = C + RANGE * 1.1/2 R3 = C + RANGE * 1.1/4 R2 = C + RANG
FREE

멀티 타임프레임 지원, 사용자 정의 가능한 비주얼 신호 및 구성 가능한 알림 시스템을 갖춘 Accelerator Oscillator (AC) 지표.
AC란? Accelerator Oscillator (AC)는 Bill Williams가 개발한 모멘텀 지표로, 현재 구동력의 가속 또는 감속을 측정합니다. 이 지표는 Awesome Oscillator (AO)와 그것의 5 기간 단순 이동 평균 (SMA) 간의 차이로 계산됩니다. AC는 시장 모멘텀이 가속하고 있는지 감속하고 있는지를 보여줍니다. 양수 값은 상승 방향으로의 가속을 나타내고, 음수 값은 하락 방향으로의 가속을 나타냅니다. AC가 제로 라인을 교차할 때, 가속 방향의 변화를 신호합니다. 트레이더들은 추세 강도를 확인하고 잠재적 진입 또는 퇴출 지점을 식별하기 위해 AC를 자주 사용합니다. 기능: 화살표 및 수직선이 있는 비주얼 신호 마커 구성 가능한 트리거가 있는 3개의 독립적인 신호 버퍼 신호 감지 옵션: 방향 변경, 레
FREE
BinaryPin is an indicator developed and adapted specifically for trading short-term binary options. The indicator's algorithm, before issuing the signal, analyzes many factors, such as market volatility, searches for the PinBar pattern, calculates the probability of success when making a deal. The indicator is set in the usual way. The indicator itself consists of an information window where the name of the trading instrument is displayed, the probability of making a successful transaction, the
FREE

This indicator calculates the volume profile and places labels that correspond to the VAH, VAL and POC levels, for each candle individually.
Indicator operation features The indicator works on the timeframes from M5 to MN, but it uses the history data of smaller periods: M1 - for periods from M5 to H1, M5 - for the H4 period, M30 - for the D1 period, H4 - for the W1 period, D1 - for the MN period. The color and location of the VAL, VAH and POC labels on the current candle are considered to be c
FREE
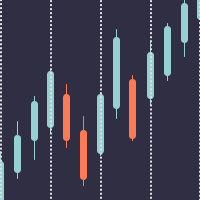
Better Period Separators For MetaTrader 4 The built-in period separators feature doesn’t allow users to specify the time period, so you can use this indicator to create more customizable period separators. On intraday charts, you could place period separators at a specific time, you could also place extra period separators at a specific time on Monday to mark the start of a week. On higher timeframe charts, this indicator works the same as the built-in period separators, On the daily chart, peri
FREE

YOU CAN NOW DOWNLOAD FREE VERSIONS OF OUR PAID INDICATORS . IT'S OUR WAY OF GIVING BACK TO THE COMMUNITY ! >>> GO HERE TO DOWNLOAD Most of the time, market reversals / pull backs usually follow volume and price spikes thus these spikes could be the first indication of an exhaustion and possible reversal/pullback. High volume Turns is an indicator that scans the market for price and volume spikes around over-bought/over-sold market conditions. These spikes when spotted serves as the first indi
FREE
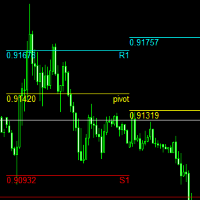
pivot points using by many traders and pivot levels most of the times are very helpfull . this indicator is a custom with internal parameters. it can show two times pivot (weekly and daily). you can choose periods total for each time showing pivots.( 1 week , 2 week ,...1day , 2day ,...) when use weekly and daily pivots , it can show you many support and resistance zones. if have proposal comment too me for upgrading indicator.
FREE

Introduction RSI divergence is a main technique used to determine trend reversing when it’s time to sell or buy because prices are likely to drop or pick in the charts. The RSI Divergence indicator can help you locate the top and bottom of the market. This indicator finds Regular divergence for pullback the market and also finds hidden RSI Divergence to show continuing trend. This indicator shows divergence on the RSI that is a strong hint for an excellent entry point and finds immediately with
FREE
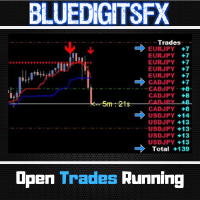
Free Utility Tool by BlueDigitsFx
Designed to improve workflow and trade management
Also available for MetaTrader 5
Optional access to updates & support via the BlueDigitsFx Discord Server BlueDigitsFx Open Trades is a powerful MT4 tool that displays your total pips from all open trades in real time.
Its intuitive color-coded interface quickly indicates winning and losing trades across all currency pairs.
This helps you monitor your trade performance effortlessly, enabling faster decision-
FREE
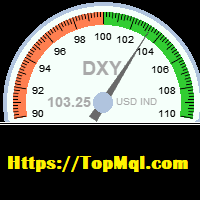
This indicator is used to calculate the dollar index according to the formula of currency pairs(EURUSD ,GBPUSD,USDJPY,USDSEK,USDCHF,USDCAD)Even if the broker does not have the dollar symbol. this Indicator displays the dollar index chart in a separate window at the bottom of the chart. It also displays the current dollar index graphically. In this indicator, it is possible to set the minimum and maximum value of the indicator as well as its size scale on the chart as an input parameter, and it
FREE

CustomMultiBarFractal Indicator Description
Overview The CustomMultiBarFractal indicator identifies and displays fractal patterns on price charts. Fractals represent significant price reversal points that can serve as signals for trading strategies.
Key Features - Detects fractals based on a user-defined analysis period - Displays upper and lower fractals with customizable colors - Allows offset adjustment from price extremes - Provides flexible visualization settings - Support
FREE

Looking for entry points along the local trend without repaint! Arrows indicate entry points. Based on classic indicators. The indicator is easy to use. Settings Наименование Описание Frequency factor Signal frequency. The less, the more often.
This affects the quality.
Recommendations Recommended for use on major currency pairs. Timeframe from m5, m15, m30 Subscribe to my telegram channel, where we discuss intraday trading, ideas, indicators, etc., a link in my profile contacts.
FREE
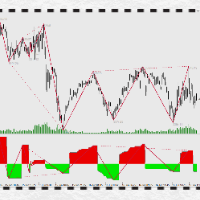
Introduction to PowerTrapezoid:
The application of market Power deviation system is not a secret, such as volume price deviation, MACD deviation, Chanlun deviation and so on. However, how to correctly understand and calculate, and accurately judge the increase or decrease of POWER is a threshold in application, which is difficult to cross with the conventional system. How to avoid reciting? How to implement multi level backflow parallel computing? How to intuitively show the range of backtrack
FREE

"Experience the full power on EURUSD!" Title: ChanLun Structure and SMC System Description: This indicator combines ChanLun Theory (Bi, Duan, Zhongshu) with Smart Money Concepts (SMC) to analyze market structure. It visualizes the market in three distinct layers—Pen, Segment, and Wave—and automatically identifies Premium, Discount, and Optimal Trade Entry (OTE) zones. The tool features an Interactive Hybrid Control System , allowing traders to manage the chart using keyboard hotkeys or mouse int
FREE
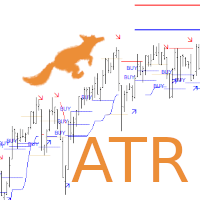
Are you looking for ATR Levels, ATR Trend, ATR Support and Resistance Indicators ? Now you have all in one !!! Info on your chart is showing you: where current price and levels are, what is current trend and signals. Search for an entry with low risk for trading by Lisek ATR Indicator. There are many ways to trade with Lisek ATR Indicator: Trade Support and Resistance Levels. Trade pullbacks (Range trading). Trade breakouts. Trade reversals. Take profit or set stop-loss based on ATR Levels.
FREE

The Candle Countdown Timer for MetaTrader 4 (also available for MT5) is a vital indicator designed to help you manage your trading time effectively. It keeps you updated about market open and close times by displaying the remaining time before the current candle closes and a new one forms. This powerful tool enables you to make well-informed trading decisions. Key Features: Asia Range: Comes with an option to extend the range. Broker Time, New York, London Time: Displays the current broker time
FREE

The " Countdown Candle Timer " indicator is a visual tool for the MetaTrader 4 platform that displays an accurate countdown of the time remaining until the next candle on the chart. It provides real-time information about the remaining duration of the current candle, allowing traders to track time precisely and optimize their trading decision-making. The indicator can be customized in terms of color, font size, and position on the chart, providing flexibility and convenience to the user. You can
FREE

Moving Average Cloud draws 4 MAs on chart simultaneously in histogram style. Indicator uses 4 MAs: slow sma & ema 200 and fast sma & ema 50. the range between 2 slows MAs and Fasts, represented by histograms on the MAs boundaries - creating kind of "cloud" that can be traded by all kind of MA strategies like support & resistance or other... Change of color of the same histogram points to momentum changing.
Combined with other market analysis, can greatly improve trading results.
FREE
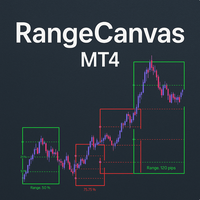
Daily Range Boxes : The indicator draws rectangular boxes around each day's high and low prices, creating a clear visual boundary for the daily trading range. Color-Coded Logic : Green boxes when the current price (or close) is above the daily open Red boxes when the current price is below the daily open Percentage Level Lines : Inside each box, it draws three horizontal lines at: 25% of the daily range 50% of the daily range (midpoint) 75% of the daily range Range Information : Each box displa
FREE

Behaving in a similar fashion as the price action of a chart, the indicator uses " Trix " to opportune itself to the exposure of divergency, flat/low market volume, and price action expansion . The TRIX indicator nicknamed after the Triple-Exponential-average, is a momentum-based oscillator that filters minor price changes and fluctuations that are considered insignificant for forex trading whilst providing money making opportunities! Overall, TRIX is a leading indicator that shows diverge
FREE
추세 상관 강도 (TCS) 지표: 외환 추세 분석의 우위 추세 상관 강도 (TCS) 지표 는 추세 강도를 측정하는 방식을 재정의하는 최첨단 도구로, 평균 방향 지수(ADX)와 같은 기존 지표에 비해 상당한 이점을 제공합니다. 방향성 움직임에 의존하는 ADX와 달리, TCS는 종가와 선형 시계열 간의 상관 관계 를 계산하여 추세 강도를 독특하게 정량화합니다. 이 혁신적인 접근 방식은 외환 트레이더에게 강력한 추세를 식별하고 활용하기 위한 매우 정밀한 방법을 제공합니다. TCS를 선택하는 이유? 추세를 일찍 포착하고 핍을 극대화하세요: TCS는 단순히 반응하는 것이 아니라 예측합니다. 시간이 지남에 따라 가격이 얼마나 선형적으로 움직이는지 측정하여 놀라운 정확도로 새로운 추세를 식별하는 데 도움이 됩니다. 주간 차트에서 TCS 값이 45 이상으로 상승하는 것 은 중요한 시장 움직임이 진행 중이라는 강력한 신호입니다. 기존 전략에 TCS를 통합하여 더 일찍 거래에 진입하고 더 많은 핍을
FREE
Smart Liquidity Zones (SLZ) — Your All‑in‑One SMC/ICT Radar for MT4
Why SLZ? Tired of squinting at charts trying to spot liquidity grabs, break‑of‑structure candles and Fair Value Gaps before the smart‑money sharks do? SLZ turns your chart into a tactical map —drawing every high‑probability zone and screaming (politely) when price dives in. Core Edge Powered by a rule‑set distilled from Smart Money Concepts (SMC) and ICT mentorship material, SLZ auto‑marks: Component What it shows Why it
FREE

The Supply and Demand with Swap zones MTF indicator is a powerful tool for technical analysis that has been modified and enhanced to provide traders with even more valuable information. This tool is based on the rule of supply and demand and allows traders to analyze a chart on three different timeframes at once, providing a more comprehensive view of the market. One of the key features of this indicator is the so-called swap zones, which are areas that have been broken through by the price but
FREE

MACD divergence Simple edition 原始MACD计算方式,升级为双线MACD,使判断更加直观更加贴合大宗交易平台的研究习惯,同时还会自动用实线标出背离,不用再从0开始苦学钻研。
同时,我还提供了提醒服务,在你忙于家务无暇顾及的时候只需要打开音响,一旦达成背离,第一时间就会让你知晓。
这是一款简单版的看背离指标,MACD的九天均线被称为“信号线”,然后绘制在MACD线的顶部,它可以作为买入和卖出信号的触发器。当MACD越过信号线时,交易员可以买入操作,当MACD穿过信号线以下时,交易者可以卖出或做空操作。移动平均收敛-发散(MACD)指标可以用几种方法解释,但更常见的方法是交叉、散度和快速上升/下降。
FREE
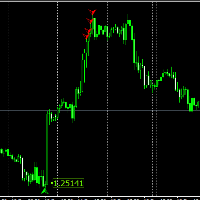
For those who have followed my FCK Quantum Scalping thread know about the FCK Quantum Scalping indicator and have taken the indicator to different levels (Mastermind) to suit his or her trading style. In this system, the Quantum indicator is only for showing us trading entries, and that’s it. Targets and stop levels are a little later. For those who don’t know what the FCK Quantum Scalping indicator is, I’ll tell you. The FCK Quantum Scalping indicator is basically a modified Wave indicator i
FREE
* All Symbols x All Timeframes scan just by pressing scanner button ** *** Contact me to send you instructions and add you in "Candle Scanner group" for sharing or seeing experiences with other users. Introduction: Candles tell their story. When looking at a candle, it’s best viewed as a contest between buyers and sellers. Candlestick patterns are used to predict the future direction of price movement. Candlesticks are an easy way to understand the price action. You can use candlesticks to decid
FREE

The indicator has combined 5 popular strategies. Draws an arrow after confirming a signal for the selected strategy. There are signal alerts. Doesn't redraw its values. I recommend watching my advisor - Night Zen EA
5 strategies. The main line crosses the signal line. The main line crosses the signal line in the oversold (for buy) / overbought (for sell) zones. The main line enters the oversold (for sell) / overbought (for buy) zones . The main line comes out of the oversold (for buy ) / over
FREE

CyberZingFx Volume Indicator is designed to help traders find market reversals with ease. This powerful tool uses a unique strategy that combines both volume and historical price to provide accurate signals for potential market reversals. The indicator displays volume BUY and SELL power values on the right side of the chart for both BUY and SELL. With customizable settings, you can set alerts at different levels to suit your trading style. The most recent alert value is displayed as Alert High,
FREE

MidPrice_A — The Hidden Power of the Market in a Single Number Looking for a way to see the true market direction without noise, lag, or overloaded charts?
MidPrice_A is a minimalistic yet powerful tool that reveals the pure price impulse , based on a professional market movement logic. What does MidPrice_A do? Unlike traditional indicators that rely on closing prices and often lag behind, MidPrice_A analyzes the candle mid-price and measures how far the market has actually shifted over the last
FREE
차트에 그리기 기능을 제공하는 "Draw On Chart Indicator"를 소개합니다: 차트에서 창의력을 발휘하세요!
분석을 주석으로 추가하거나 아이디어를 효과적으로 전달하기 위해 트레이딩 차트에 주석을 달기 위해 애를 쓰는 데 지쳤나요? 더 이상 찾아볼 필요가 없습니다! 저희는 자랑스럽게 "Draw On Chart Indicator"를 선보입니다. 이 혁신적인 도구를 사용하면 몇 번의 클릭 또는 펜 스트로크로 차트에 직접 그리고 주석을 추가할 수 있습니다.
저희 혁신적인 "Draw On Chart Indicator"는 차트 분석 경험을 향상시키고 창의력을 발휘할 수 있도록 설계되었습니다. 이 강력한 도구를 사용하면 손쉽게 생각을 표현하고 핵심 레벨을 표시하며 패턴을 강조하고 트레이딩 전략을 시각적으로 표현할 수 있습니다. 숙련된 트레이더, 기술적 분석가 또는 트레이딩의 매혹적인 세계를 탐험하는 초보자라 할지라도, "Draw On Chart Indicator"는 차트와 상호
FREE
MetaTrader 마켓은 MetaTrader 플랫폼용 애플리케이션을 구입할 수 있는 편리하고 안전한 환경을 제공합니다. Strategy Tester의 테스트를 위해 터미널에서 Expert Advisor 및 인디케이터의 무료 데모 버전을 다운로드하십시오.
MQL5.community 결제 시스템을 이용해 성능을 모니터링하고 원하는 제품에 대해 결제할 수 있도록 다양한 모드로 애플리케이션을 테스트할 수 있습니다.
트레이딩 기회를 놓치고 있어요:
- 무료 트레이딩 앱
- 복사용 8,000 이상의 시그널
- 금융 시장 개척을 위한 경제 뉴스
등록
로그인
계정이 없으시면, 가입하십시오
MQL5.com 웹사이트에 로그인을 하기 위해 쿠키를 허용하십시오.
브라우저에서 필요한 설정을 활성화하시지 않으면, 로그인할 수 없습니다.