Advanced trading lessons
erasing all notions about trading
the first thing traders must do before learning to trade is this: you must
except the real markets for what it is!!
their will be no changing thees facts about the markets.
1. the markets are be manipulated, in a very advanced way.
2. your stops are being hunted most of the time!
3. the market tricks people into #1 wrong decisions, or #2 early decisions, that seam emotionally wrong for periods of time.
4. no matter what people through at the markets or what they do to make decisions they still seam to work themselves
into dead ends, then start over again, looking for not so much the holly grail but real answers.
5. psychology of markets is huge part of trading, and there is lots of books and lots of quacks teaching this part of trading
(yet not one of those so called doctors relate psychology of trading directly to the charts, and directly to strategy.
6. most everything you have learned about trading comes true when looking at the past but not right side!!
7. 99.99% of traders do not know for sure what time frame to trade from. the ones that claim they only trade from this
one time frame, or just these two time frames, are probably very smart and nice traders, but are not being honest.
because successful traders have to constantly adjust the time frame they trade from. If you don't know how and when
to do this you are at the Mercy of the banks true intentions.
8. most everything you have learned about trading works some times, but most of the time it does not. when a person
looks at a chart their brain automatically is programed to look for what they are taught, so you will find the places on the chart
easily, not noticing how many time their signal failed before being correct.
Ok that's a good start i think. read this a few times you must understand, with me eventually i am going to open your minds
up, expose the truth.so you have to be prepared for a completely different view of the markets then you had ever seen before.
this is not a shallow empty shell statement, this is what is going to happen here, and the new view you will take on the markets
will be the truth about how it works and what to watch out for!!
welcome traders!!!!!!!!!!
shaving years of your learning curve of trading
first subject will be trend lines
#1 how they they really work! for the first time ever on the web or anywhere else you will be able to know
how to use trend lines to your advantage!!!
#2 trend lines can only be taught in conjunction with the fallowing subjects as sub tittles!!!!!!!!!
A. trend lines and Time frames
B. trend lines and ranges
C. trend lines and time
D. trend lines and trending versus ranging.
E. organizing trend lines usage for clues for momentum.
trend lines types of uses
trend line entries
1. trend lines entries on new inner slope.
2. ranging on lower freq. or time frames to a higher time frame trend line.
3. trend lines and outer slope.
4. trend lines and shapes wedges flags etc.
5. third point trend line trading.
the third piont of a trend line.
it takes two points to start a trend line, correct.
well the third point of a trend line is what i call the "emotional point" why because this is where
traders but there entries into the markets!!
this is also where traders get there stops hit or get sucked into thinking the market is about to reverse.
99% of the time :::::the market will not trend (after ranging) unless two things happen first!!!!!
#1 the first thing is this: traders left off balance (((((moving sharply)))
by the trade going sharply before hitting a trend line ; at what looked like could have been a third point on the trend line.
#2 the market slightly bounces off the trend line (((inducing trend trades to fallow))), then only to reverse and attack traders stops
this is at the beginning of new break out after a long ranging scenario.
after the trend is beginning to mature on staying on the same time frame, a third thing the does happen.
that third thing is this:
#3. the market breaks the trend line and reverses to a moderate degree , not as large as the trend move but large
enough to where traders start looking for clues to where the market will rejoin the trend. and almost 80% of the time
the market rejoins the trend by turning around some where unexpected, Support became resistance (no) re-test (no)
just a turn around in space, if the turn around happens at some fib level then the market sucks you in and goes after
stops before rejoining the trend.
it sound like from the beginning that trend lines are nothing more than a trap,((( they are!!!!!!!)))
if there not a trap a new inner slope begins leaving the trade tucked safely inside your trend line never to reach it.
keeping you off the trade!!!!
what we know so far is:
trend line are traps. inner slope,trend lines will not come into play with a new breakout.
well we could abandoned trend lines like most traders do after they loose, or we can learn what is really going on here?
you see this how trading should be organized.
organizing your attack strategy, is what we do at the end of this thread.
for now lets expose some secrets we can take advantage of within the system.
The never before seen secrets, Holly grail stuff baby, ok
next we will talk about Time. Time and frequency ( or time frame as some call it)
not many traders realy know this if any!
Time can any trader stand up here and explain time when trading, i mean explain ti in a way where
traders can really use it!!
Time is not sessions!!
time is not GMT, NY time etc.
the market movers don't care about what session they are in or what time it is!! when the move is ripe it goes!!
time has to do with frequencies!! (or time frames) time is directly related to slope, slope is measured best by
Trend lines!!!!!!!!!MA,s are two lagging Trend lines are not flexible enough or are they?
this is important,"( each time frame has a center )" that center is where the highs and lows of the market is observed!!
its where all trader draw Trend lines, observe moving averages, define slope!!
the funny thing about the centers of time frames are the price may be observed in the center of the time frame, but
that's usually not where price physically observed the highs or lows, in fact it rarely happens at the center.
in fact the center of all ( trending candle ) thees centers were formed at the beginning of the time frame.
#1 the center of a short trending candle's ((high)) is formed at the beginning with physical price but it is plotted and observed
at the center of the candle.
#2 the center of a long trending candle ((lows)) always are formed at the beginning with physical price , but plotted and observed
at the center.
so the lower frequency ( time frames) currency physical price has bearing relation ship to upper time frame Trend lines, yes
hallelujah!!
what is that relation ship? how can take advantage of it? i will show you the relation ship and how you can take advantage
of it with places to put risk into the market.
ok here one example
i call this data transfer, we take a lower freq. time frame compare it a higher freq. trend line.
using Time, or this case the beginning of the larger time period. find the center of that time
period then plot a line where the center of that time period strikes the trend line.
by plotting the center of upper time frames, and then drawing a line where the center meets the trend line you can then look at price in relation ship to the upper time frames trend line strike. giving you a huge advantage.
by overlaying a larger time frames candle onto a smaller time frame chart. you can get that time frame.
if you would have just been on the lower freq. time frame looking at the third point entry you get stopped out at point two!! i know this will spure questions, and this is just the tip of the iceberg. theirs more a lot more.
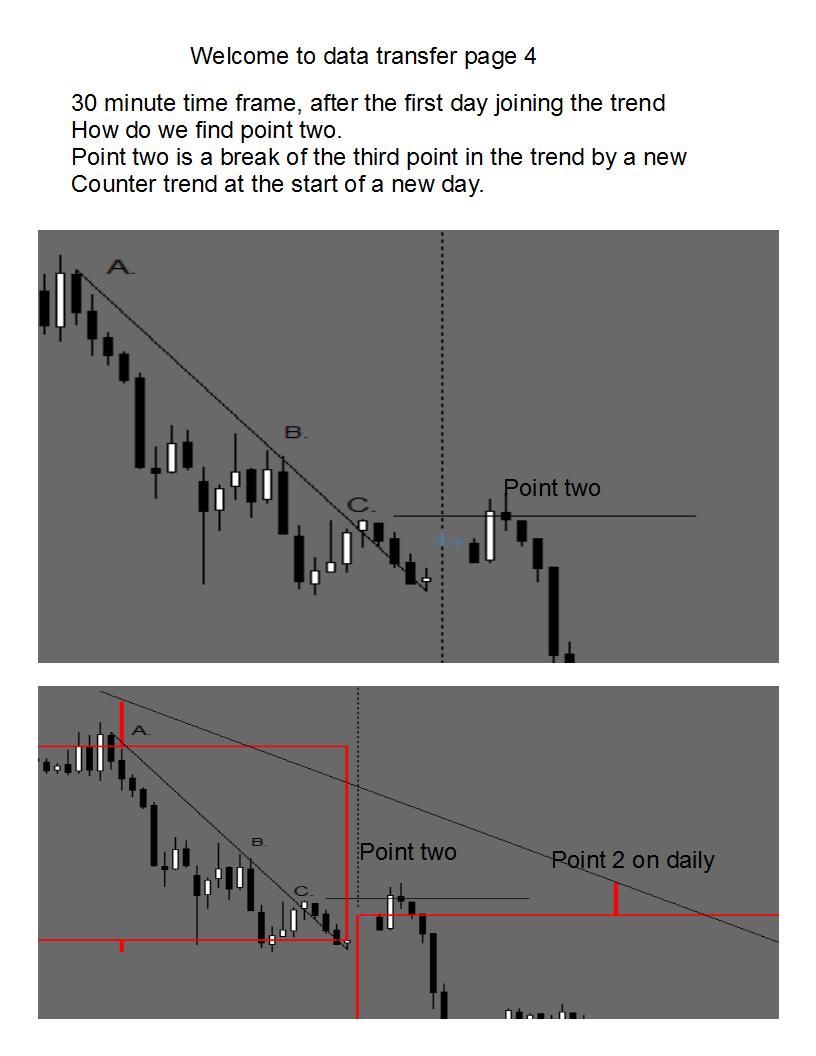
in this example
now if you did not have the upper time frames trend line plotted and the center of the time frame plotted
where it meets the trend line, and you were just looking at the thirty minute time frame alone.
your brain would see a trend line break, finding support on the back side of that trend line, then supported
by a up trending candle, or trap candle, stopping out the thirty minute trend followers at point #2
you would never know when this counter trend trap was actually their, but by plotting the upper time frames
trend line finding the center where it would strike that trend line, now you know exactly where your entry should be!!!
every one get it? we will stay on this subject for a long time.. so do not worry if you do not get it at first.
even more exiting
the physical strike of the upper time frames trend line by actual lower time frames price.
this is the best entry place to take risks. here is an example of a physical strike,
this is very common, and i only trade the first physical strike of the trend line. the second time can have some momentum but price will naturally and eventually cross the upper trend line physically when and even higher time
frame calls for it to do so. the second physical strike is clue a temporary reversal is coming soon.
think of a trend this way
a trend does this:
it starts on a small time frame like the 5 minute, at the third point on the 5 minute the market fakes with the trend
then comes back and stops traders out, then the trend continues with a new inner slope.
after Time passes then the trend new 5 minute inner slope weekends then we break that trend line, then price
ranges at that point until it gets to an upper time frames trend line physically striking it for the first time, after
that the trend continues.
then eventually the one hour trend line, after one or two new inner slopes, then after the one hour trend line
is broken we involve another upper time frame from their.
think of this as passing the football around.
each time frame takes its turn ding this on constant basis always!!!!: breaking trend lines setting traps
then continuing.
the sooner traders realize how trading works the easier trading becomes. after trend lines i will Teach reading
price action charts, I'm not your average bear when it comes to price action, i believe i am well far and above
the worlds foremost expert at reading price action, knowing if it,s a trap or legit. but one thing at a time.
trading is about confusing traders keeping them off balance with new inner slopes, and or trapping them stopping them out at the outer slopes.
it happens on all time frames!! reading this on upper time frames gives you lower time frame swing trades.
lets see another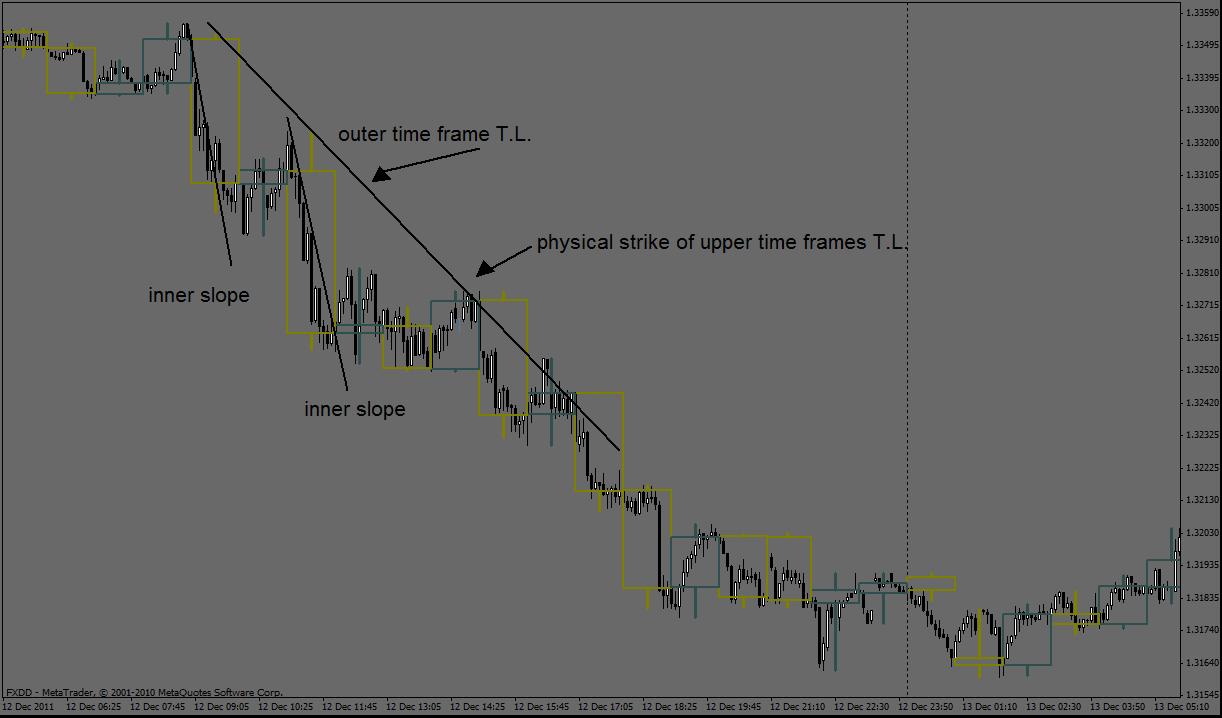 physical strike
- Free trading apps
- Over 8,000 signals for copying
- Economic news for exploring financial markets
You agree to website policy and terms of use
I have gotten a few request from different traders from time to time who want to learn about trading.
so i decided to do this thread to help traders with their trading as group. feel free to ask questions at any time.
thanks, and lets get started!!!