From theory to practice - page 858
You are missing trading opportunities:
- Free trading apps
- Over 8,000 signals for copying
- Economic news for exploring financial markets
Registration
Log in
You agree to website policy and terms of use
If you do not have an account, please register
Got any pictures? Is there any way to look at them?
Well, it's the 'eared' distributions. So when you demonstrated one, I got excited and thought you understood their secret.
But alas... Zigzag is totally off the mark....
These distributions are derived precisely from the tick stream by reading and processing it in a certain way.
Well, it's the 'eared' distributions. So when you demonstrated one, I got excited and thought you understood their secret.
But alas... Zigzag is totally off the mark....
These distributions are derived precisely from the tick stream by reading and processing it in a certain way.
The problem with lugs is that they are overlaid with GEP,
so it's troublesome and not promising.
;)
Well, these are the 'ears' distributions. So when you demonstrated one, I got excited and thought you understood their secret.
But alas... Zigzag is totally off the mark....
These distributions are derived precisely from the tick stream by reading and processing it in a certain way.
I did it simply by setting the slope at every step. The same way you can do it with ticks. I've defined the slope, say, of 200 points, then at every step I count how many minutes (ticks) passed to make the difference between the maximum and minimum price value equal to the slope = 200 points. Then I calculate the sum of increments within this range for this time (number of ticks). This happens at every step.
No one prevents us from doing the same on ticks. It is more likely (it was so on minutes) that we don't even need to calculate dispersion, the sum of increments will lie within the limits of the given scale (with an error a bit). The only thing to do is to detect the turning point and price will continue to flat inside the range or break-through and price will move to a new level.
I did it simply by setting the range at each step. The same way you can do it with ticks. I defined a scale of, say, 200 points, then at each step I count how many minutes (ticks) passed so that the difference between the maximum and the minimum price value was equal to the scale = 200 points. Then I count the sum of increments within this range for this time (number of ticks) and do it at every step.
No one prevents us from doing the same on ticks. It is more likely (it was so on ticks) that we do not even need to calculate variance there, the sum of increments will lie within the limits of the given scale (with an error a little). The only thing to do is to detect the turning point and price will continue to flat inside the range or break-down and price will move to a new level.
This is very similar to what they have been doing. And they have the real Grail in their hands, which they are not willing to tell and show here.
This is very similar to what they were doing. And they have the real Grail in their hands, which they are unwilling to talk about or show here.
This is what it looks like on the chart.
So what's next? I don't know.
Here's the indicator file, you can put it on the minute chart. Just wait for it to load, it takes time.
No, I don't need to. I've already done gigantic work in another direction and there are some results. It's a shame to give it up...
But, to those suffering, who, let's say, are stifled or disappointed in my methods - any other information is valuable.
Therefore, I have told you a billion times - friends, post in this thread all the unusual, strange research results will be useful.
Do not be like such characters as Dmitry Basovich Fedoseyev, who puff and puff, but cannot say anything sensible.
He's waiting for you:
:))) You're in your repertoire, my friend :)))
Obviously, you're either podotr's son or nephew - and out of respect for the maestro, I give you permission to have fun here. Go on, then. But do not forget about the Grail - if you need anything, say, to calculate the parameter, or, for example, to spend their hard-earned money - seek help.
The bidding is about to begin...
May the force be with us, guys!
The bidding is about to begin...
May the force be with us, guys!
Was surprised today. Ran it through all the ticks in the tester ))))
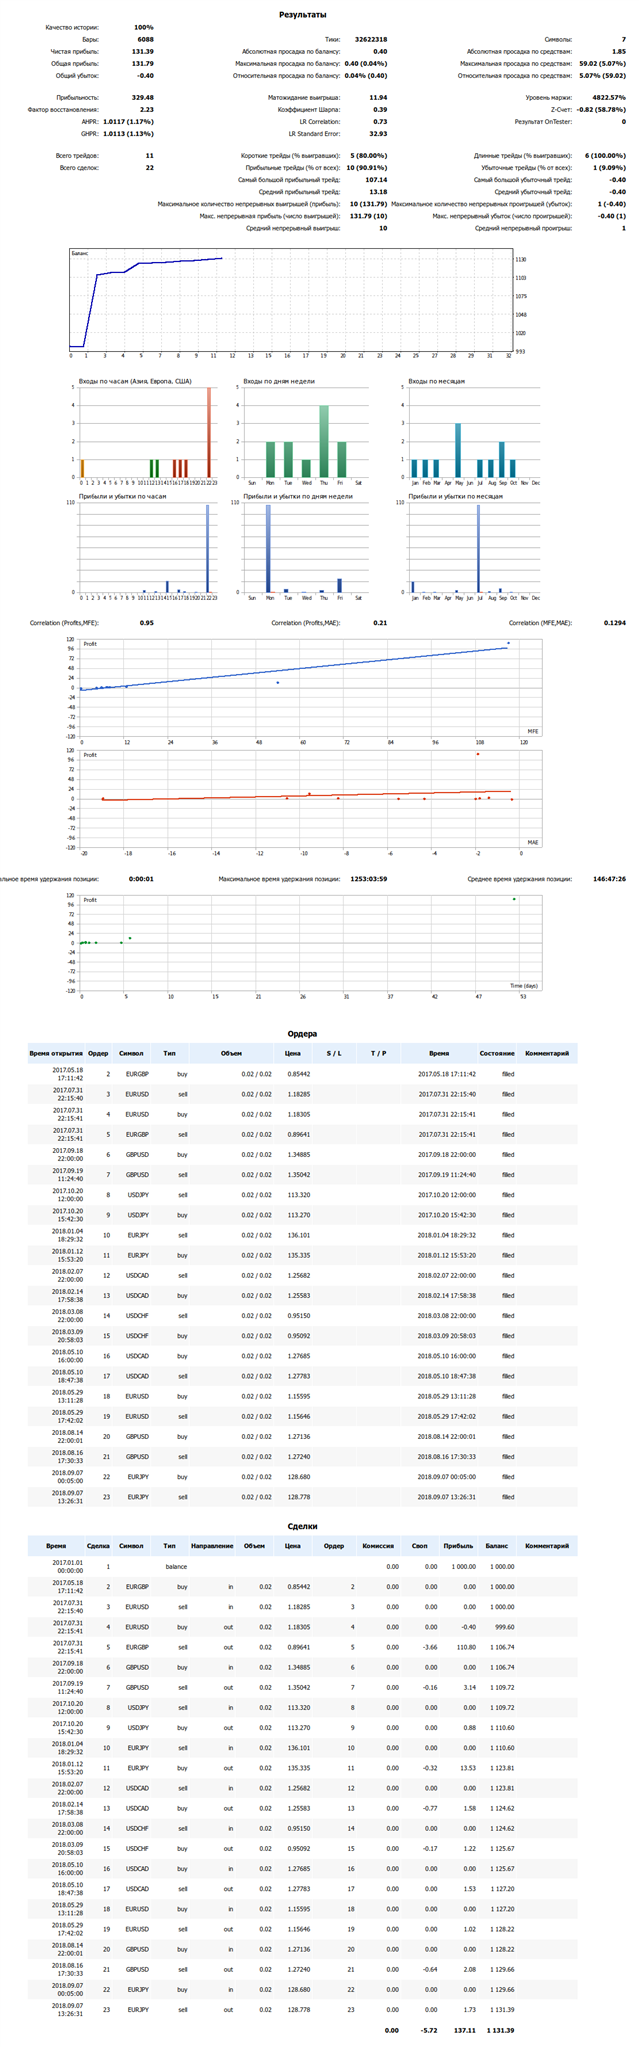
Nice picture ))))
P.S. Actually already yesterday...But there are not many trades on 12 pairs.
I was surprised today. Ran it through all the ticks in the tester ))))
Nice picture ))))
P.S. - or rather already yesterday...But there are not many trades on 12 pairs.
the first time you've seen that in a tester?
by the way, he can do better than that... ;)