Something Interesting in Financial Video November 2013
=============
Why Leverage is the Biggest Advantage and the Biggest Disadvantage
The main advantage and disadvantage in futures trading is the leverage involved. (You can hold a very large amount of a commodity for a small deposit so any gains and losses are multiplied.) This is the main difference between futures trading and, say, speculating with stocks and shares.
For example, you have $3000 to invest. You could buy $3000 of shares in an Oil Mining Company, buying them outright. Or this $3000 may be sufficient margin (a goodwill "security bond") to buy a couple of Crude Oil futures contracts worth $30,000.
The price of Crude Oil drops 10%. If this effects the price of your mining stocks by 10%, you would lose $300 (10% of $3000). But this 10% fall on the value of your Crude Oil futures contracts would lose $3000 (10% of $30,000). In other words, all of your initial stake would be lost trading the futures rather than only 10% of your capital trading the shares.
But, with Stop-Loss Orders you will always know how much money you are risking in any trade.
A Stop Loss Order is a pre-determined exiting point which automatically exits your position should the market go against you. In the above example, you may only decide to risk $1000 on the Crude Oil futures contracts. You would place a stop loss just under the market price and if the market dropped slightly, your position would be exited for the $1000 loss.
So Leverage is great if the market goes in your predicted direction - you could quickly double, treble or quadruple your initial stake. But if the market goes against you, you could lose a lot of money just as quickly. All of your initial stake (your margin) could be wiped out in a few days. And in some cases, you may have to pay more money to your broker if the margin you have put up is less than the loss of your trade.
How to Protect Profits with Stop-Loss Orders
As mentioned above, losses can accumulate just as quickly as profits in futures trading. Nearly every successful trader uses Stop-Loss Orders in his trading to ensure profits are 'locked in' and losses are minimised.
How do Stop-Losses work?
A stop-loss is usually placed when a trade is entered, although it can be entered or moved at any time. It is placed slightly below or above the current market price, depending on whether you are buying or selling.
For example, say Pork Bellies is trading at $55.00 and you think prices are about to rise. You decide to buy one Pork Bellies contract, but you don't want to risk more than $800 on the trade. A one-cent move in the market is worth $4.00 on a pork bellies futures contract so, therefore, you would place your stop at $53.00 (200 cents away from the current price x $4 per point = $800).
You can also move a stop-loss order to protect any profits you accumulate.
Taking the Pork Bellies example: Two weeks later, bellies are now trading at $65.00. You are now up $4000 (1000 cents of movement x $4). To protect these profits, you can raise your stop-loss simply by calling your broker. Say you place it at $63.00, you have locked it a profit of at least $3200 and now risk $800 to your new stop level.
But what if the market went against you? Going back to the original position when you bought at $55.00 with a stop at $53.00: what happens if the market suddenly tumbles down to $51.00 during the day? Your trade would automatically be 'stopped out' at your stop level of $53.00 for an $800 loss. The fact that the market closed the day at $51.00 is irrelevant as you are now out of the market. (Had you not used a stop-loss and viewed the market at the end of the day, you would have large losses on your hands!)
The same would happen if the market reached $65.00 and you had raised your stop to $63.00: If the market fell from here, say to $62.80, you would be stopped out at $63.00 and would have a profit of $3200. Even if the market suddenly reversed here and rose to $79.00, this would be irrelevant as you are now out of the market.
This last example would be annoying because if you hadn't been stopped out, you would now be $9600 in profit. But you were stopped out at your $63.00 stop. The market only went 20-cents under this and reversed!
It is for this reason that some traders don't use stops: they have been stopped out in the past JUST when the market was about to go their way.
The solution is not to abandon using stops as this is EXTREMELY RISKY. The solution is to use stops effectively.
(In fast moving markets it is sometimes impossible for brokers to get your orders exited exactly on your stop loss limits. They are legally required to do their best, but if the price in the trading pit suddenly jumps over your limit, you may be required to settle the difference. In the above scenario, the price of Pork Bellies could open trading at $62.50, fifty cents through your stop at $63.00. Your broker would have to exit your trade here and, in fact, you would lose $1000, $200 more than your anticipated $800.)
Where to Get Market Information
Commodity prices can change direction much faster than other investments, such as company stocks. Therefore, it is important for traders to stay on top of market announcements. Professional traders may use a wide number of techniques to do this, using fundamental information and technical indicators.
Fundamental data may include government reports of weather, crop sizes, livestock numbers, producer’s figures, money supply and interest rates. Other fundamental news that could affect a commodity might be news of an outbreak of war.
Technical indicators are mathematical tools used to plot market prices and behaviour patterns on a graph. These can include trend lines, over-bought and over-sold indicators, moving averages, momentum indicators, Elliott wave analysis and Gann theory.
Some traders use just one of these basic methods religiously, disregarding the other completely. Others use a combination of the two.
Many investors, especially smaller investors, devise their own trading method or purchase one from another trader. (Be careful not to buy a system that has been over-optimised and curve-fitted to fit past data. Many times, I have seen systems claiming 80%+ winning trades on past data, but when I have run the system on current prices, the results are breakeven at best!)
They normally paper trade the method (i.e. they follow the markets but only pretend to place the trades) for a few months to make sure the method works for them before placing any actual trades.
Tracking price charts and keeping up with fundamental data is a difficult full-time job – some large organisations employ dozens of staff to follow market moves. And some traders, especially those on the market floor, may only hold a position for a few hours or even minutes.
So where does this leave the small, independent investor who would like to trade in the lucrative futures markets?
Many trade on a daily or weekly basis, i.e. they note or 'download' market prices at the end of each trading day and make their decisions from this data. Often, they will leave a trade on for at least a few weeks (possibly months). This is a much SAFER way of trading because any fluctuations are ridden out and less panic-buying or selling is involved.
============
- www.futures-investor.co.uk
Ichimoku - Chikou Span
5 minute video lesson
===============
Chikou Span - Lagging line
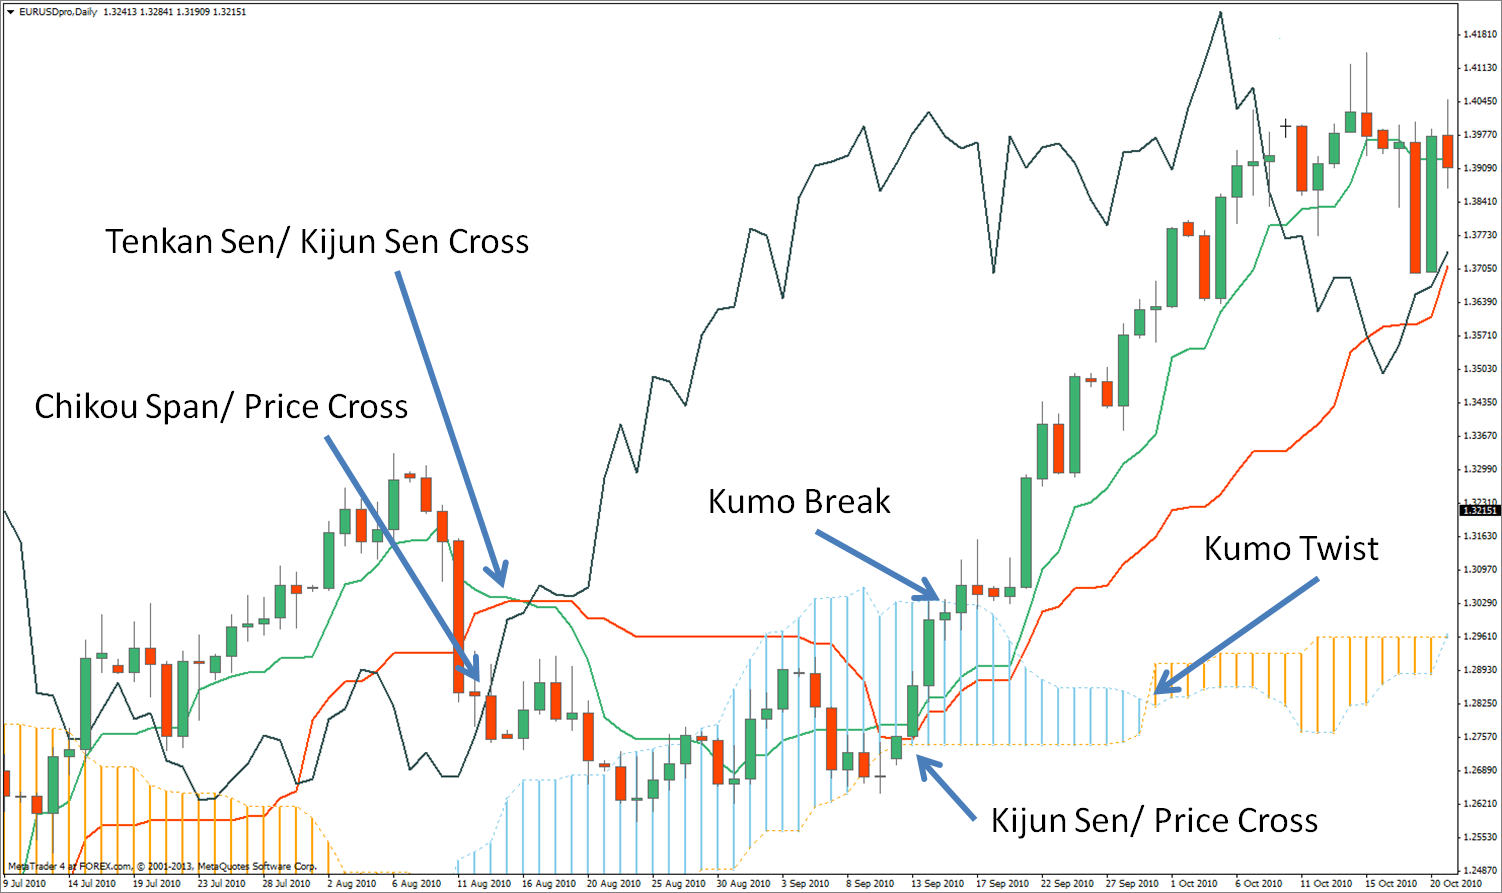
The closing price plotted 26 days behind.
The Chikou Span, also known as the Lagging line, is the closing price plotted 26 trading days behind, i.e. into the past, providing an at-a-glance view of how the price compares to that 26 days ago.
The trend is deemed to be upward when the Chikou Span is above the closing prices and downward when it is below them. The relationship is not always clear when looking at historical data, but becomes more obvious when looking at current charts.
The Chikou Span is also considered of use for confirmation of trends, momentum, and support and resistance levels highlighted by the other Ichimoku elements.
===============
Forex Channel Trading
A video on trading Forex Channels and how to discover where price is likely to break the channel.
Indicators: Linear Regression Channel
newdigital, 2013.09.27 09:39
Linear Regression Channel
Similar to the 200-day Moving Average, large institutions often look at long term Linear Regression Channels. A Linear Regression Channel consists of three parts:
- Linear Regression Line: A line that best fits all the data points of interest.
- Upper Channel Line: A line that runs parallel to the Linear Regression Line and is usually one to two standard deviations above the Linear Regression Line.
- Lower Channel Line: This line runs parallel to the Linear Regression Line and is usually one to two standard deviations below the Linear Regression Line.
The multi-year chart of the S&P 500 exchange traded fund (SPY) shows prices in a steady uptrend and maintaining in a tight one standard deviation Linear Regression Channel:
The upper and lower channel lines contain between themselves either 68% of all prices (if 1 standard deviation is used) or 95% of all prices (if 2 standard deviations are used). When prices break outside of the channels, either:
- Buy or sell opportunities are present.
- Or the prior trend could be ending.
When price falls below the lower channel line, a buy signal is usually triggered.
Linear Regression Channel Sell SignalAn opportunity for selling occurs when prices break above the upper channel line.
Other confirmation signs like prices closing back inside the linear regression channel could be used to initiate buy or sell orders. Also, other technical indicators should be used to confirm.
Trend ReversalsWhen price closes outside of the Linear Regression Channel for long periods of time, this is often interpreted as an early signal that the past price trend may be breaking and a significant reversal might be near.
Linear Regression Channels are quite useful technical analysis charting tools. In addition to identifying trends and trend direction, the use of standard deviation gives traders ideas as to when prices are becoming overbought or oversold relative to the long term trend.
A video on trading Forex Channels and Channel Breaks.
190. How to Trade Futures - The Limit Order
The next lesson in our free futures trading course which teaches traders how to trade futures using a limit order.
=====================
If you have a limited amount of capital to invest, you probably can't afford to trade the larger contracts like the Nasdaq and S&P500 as a slight percentage move could be worth thousands of dollars. But there are still plenty of smaller and less expensive contracts you can trade.
All futures contracts have standardised amounts of the commodity which are held by them. For example, if you buy a single pork bellies contract, you are ‘holding’ the value of 40,000lbs of pork bellies. If you sell a single soybeans contract you are betting on the value of 5000 bushels of soybeans.
Each point-move on a particular contract is worth a specific amount, and these amounts vary between contracts. For example, a 1-cent move on a Pork Bellies contract is worth $4, so a move in the market from $60.00 to $61.50 would be worth $600 per contract ($4 x 150 cents). In Soybeans, a 1-cent move in the market is worth $50 so a jump from $500 to $505 is worth $250 ($50 x 5c).
Some contracts are worth a lot more than others, especially if they are trading at historically high prices. For example, at the time of writing, the Nasdaq Index moved up around 10% last month – worth nearly $50,000 per contract! (It is at an all time high, 20 times higher than 10 years ago.) But Wheat dropped around 10% per contract - worth about $1250 per contract. (It is at its lowest price for years.)
Beginners need to first establish if they can afford to trade the commodity - if they have enough margin in their account to cover the trade, and if they can afford a sizeable move against their position. (Some traders such as Larry Williams and Tom Basso feel that risking approximately 3% to 5% of total trading capital on a position is about right. Remember too, that these traders are some of the best in the world - if you are a beginning trader, you should be careful risking that much!) Your broker will probably give you a list of dollar-per-point ratios for all the different contracts, as well as their commission and margin requirements.
A trader also needs to establish the risk/reward of trading on any particular commodity - how much you are risking to your stop loss and how much you intend to win to your target price. (Alternatively, work out the average loss and profit made by your trading system to find the expectancy of a trade's profits.)
It is also important for traders to spread the risk of trading by using different types of commodity. For example, just because you have enough capital to trade 5 contracts, don't buy five energy contracts just because they have the largest risk/reward ratio. Instead, spread your risk by trading some grains, some metal, some energy, some livestock and some currency (if they are potentially rewarding).
You may also buy or sell more than one contract on each commodity to keep the risk balanced. For example, a Pork Bellies contract may be worth a lot more than a Soybeans contract. You may decide to buy two Pork Bellies contracts and six Soybeans contracts to keep the values held on each market about equal.
None of your trades should risk more than 5% of your trading capital if possible. (And in "trading capital", I mean money you can afford to, and are prepared to LOSE!) That way, you would have to lose 20 trades in a row in order to get wiped out.
Speculating on the commodity markets can certainly be an excellent form of investment. But it can require a large amount of capital to speculate effectively on the futures markets. To set up the smallest futures account normally requires at least $5000, and many brokers require proof that you can afford to pay any losses greater than the funds in your account. (In case the market suddenly drops below your stop-loss level.)
Also, even the smallest futures contracts require at least $1000-$3000 in margin for you to hold them. This means a speculator with a $5000 account may only be able to trade one or two markets at a time. Many top traders recommend spreading your risk between several markets at a time. And, as mentioned above, you should only risk up to 5% of your trading capital on any position.
So if you haven't got $20,000 or $100,000 to speculate with, what are your options?
Smaller Futures ContractsMost of the widely traded futures contracts are large contracts traded on the Chicago Board of Trade, The Chicago Mercantile Exchange or the New York Mercantile Exchange. But there are also other exchanges that trade much smaller futures contracts.
For example, the MIDAM exchange (Mid-America) trades most of the major commodity and currency markets but under smaller contracts. Typically they hold one-fifth to one-half the amount of the commodity of the more popular contracts meaning the risks and margin requirements are a lot less.
Other exchanges around the world trade smaller futures contracts of various commodities, such as Brent Crude Oil on the LPE, London Wheat on LIFFE, and Copper, Aluminium and Tin on the LME.
=====================
- www.futures-investor.co.uk
Liquidity, Price Action and Trading
Here is a sneak peak from a video lesson in price action course and we had to do with liquidity, price action and how that affects trading. We discussed how knowing the liquidity of an instrument is crucial to understanding how to trade it and how it will affect the price action, along with your stops and take profits.
How To Trade Moving Averages
Moving averages help us to first define the trend and second, to recognize changes in the trend. That's it. There is nothing else that they are good for. Any thing else is just a waste of time.
========
"I won't be getting into the gory details about how they are constructed. There are about a zillion websites that will explain the mathematical make-up of them. I'll let you do that on your own one day when you are extremely bored out of your mind! But all you really have to know is that a moving average line is just the average price of a stock over time. That's it."
Craig Ferguson
========
Based on "How to Use Moving Averages" by Craig Ferguson
The two moving averages
Here are the important things to remember (for long positions - reverse for short positions.):
- The 10 SMA must be above the 30 EMA.
- There must be plenty of space in between the moving averages.
- Both moving averages must be sloping upward.
The 200 period moving average
The 200 SMA is used to separate bull territory from bear territory. Studies have shown that by focusing on long positions above this line and short positions below this line can give you a slight edge.
You should add this moving averages to all of your charts in all time frames. Yes. weekly charts, daily charts, and intra-day (15 min, 60 min) charts.
The 200 SMA is the most important moving average to have on a stock chart. You will be surprised at how many times a stock will reverse in this area.
Use this to your advantage!
Support and resistance?
Contrary to popular belief, stocks do not find support or run into resistance on moving averages. Many times you will hear traders say, "Hey, look at this stock! It bounced off of the 50 day moving average!"
Wrong!
Why would a stock suddenly bounce off of a line that some trader put on a stock chart? It wouldn't. A stock will only bounce (if you want to call it that) off of significant price levels that occurred in the past - not a line on a chart.
Stocks will reverse (up or down) at price levels that are in close proximity to popular moving averages but they do not reverse at the line itself.
So, suppose you are looking at a chart and you see the stock pulling back to, let's say, the 200 period moving average. Look at the price levels on the chart that proved to be significant support or resistance areas in the past.
Those are the areas where the stock will likely reverse.
========

- www.swing-trade-stocks.com
How To Swing Trade Stocks
Indicators: X2MA Transform Candles
newdigital, 2013.11.05 08:13
Based on Swing Trading Entry Strategy
Your swing trading entry strategy is the most important part of the trade. This is the one time when all of your trading capital is at risk. Once the stock goes in your favor you can then relax, manage your stops, and await a graceful exit.
This page explains the basic price pattern that is used to enter stocks. Once you become familiar with it, you can try out more advanced strategies based on the specific pattern that you are trading.With your entry strategy, the first thing that you want be able to do is identify swing points. What's a swing point you ask? This is a pattern that consists of three candles. For entries on long positions, you look for a swing point low. For entries on short positions you look for a swing point high.
Identifying reversals using swing pointsFor a swing point low:
- The first candle makes a low.
- The second candle makes a lower low.
- The third candle makes a higher low.
This third candle tells us that the sellers have gotten weak and the stock will likely reverse.
For a swing point high:
- The first candle makes a high.
- The second candle makes a higher high.
- The third candle makes a lower high.
This third candle tells us that the buyers have gotten weak and the stock will likely reverse.
For our long entry strategy, we are trying to find stocks that have pulled back and made a swing point low.
Let's look at some examples:
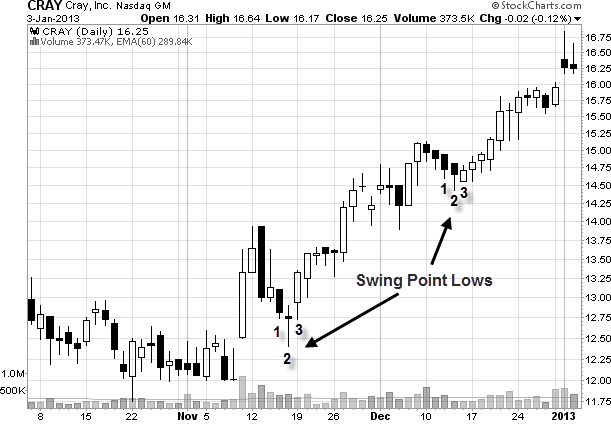
See how the pattern consists of a low (1), lower low (2), then a higher low (3)? This is a classic swing point low. Our entry strategy would be to enter this stock on the day of the third candle.
Now lets look at a stock on the short side.
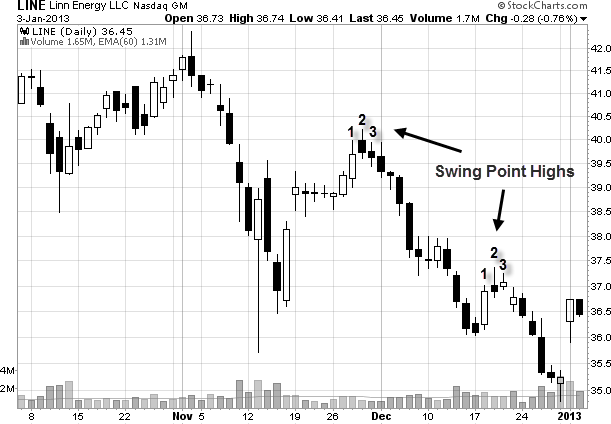
See how the pattern consists of a high (1), higher high (2), then a lower high (3)? We would look for an entry on the third candle.
It is worth noting that not all swing points will result in a powerful reversal. However, a reversal will not happen without a swing point developing. Take the time to go though a few stock charts and look at the reversals that happened in the past so that you are able to quickly identify this crucial price pattern.
Consecutive price patterns
Ideally, we want to trade stocks that have consecutive down days prior to the swing point low developing. This is the best case scenario. Here is an example on the long side: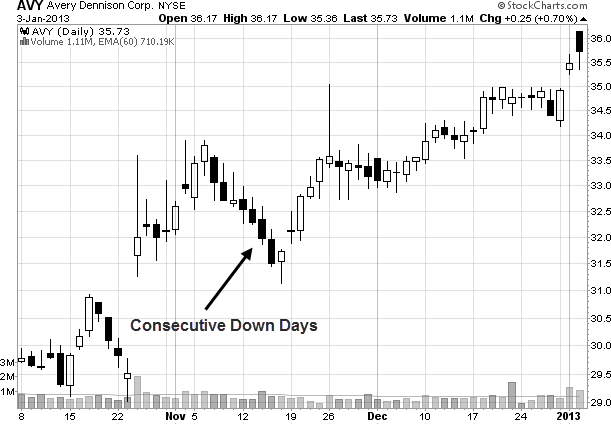
This is reversed on the short side. In this case, you want to look for consecutive up days prior to the swing point high developing.
When you are looking for swing points to develop, you always want to look to the left of the chart to see if the stock is at a support or resistance area on the chart. That will improve the reliability of this entry strategy.
Also, sometimes you may want to be more aggressive with your entry.
APF Ichimoku Overview
This introductory video of 12 video series introduces the powerful Japanese trading indicator, Ichimoku Kinko Hyo
In this first video, we give you a background and history on the indicator, along with the default parameters, as well as the concept behind it.
- Free trading apps
- Over 8,000 signals for copying
- Economic news for exploring financial markets
You agree to website policy and terms of use
Trading and training video (from youtube for example) about forex and financial market in general.
Please upload forex video you consider as interesting one. No direct advertising and no offtopic please.
Any the comments without video will be deleted.