Advanced trading lessons - page 13
You are missing trading opportunities:
- Free trading apps
- Over 8,000 signals for copying
- Economic news for exploring financial markets
Registration
Log in
You agree to website policy and terms of use
If you do not have an account, please register
wow am not as good as
i not nearly as good at poetry then trendchanger! now that is funny. lol
reading physical price
when physical price crosses a upper time frame trend line it means the trend will continue.
but when it happens in close proximity, that means a range on the upper time frame or reversal.
many times you will get a with trend signal, that is nothing more then a signal a range on that time frame
is here. that becomes a trap.
this is a comparison of physical price to the upper time frames trend line!
not all
not all market crossing are data transfer. some times the market just moves side ways first,
but when it is there its a nice trade.
in almost every case
in most cases. even with a second near by crossing their is still some trend momentum first. before counter trending.
on the larger time frame!!
keep going
here you can see, how an inside bar range starts!!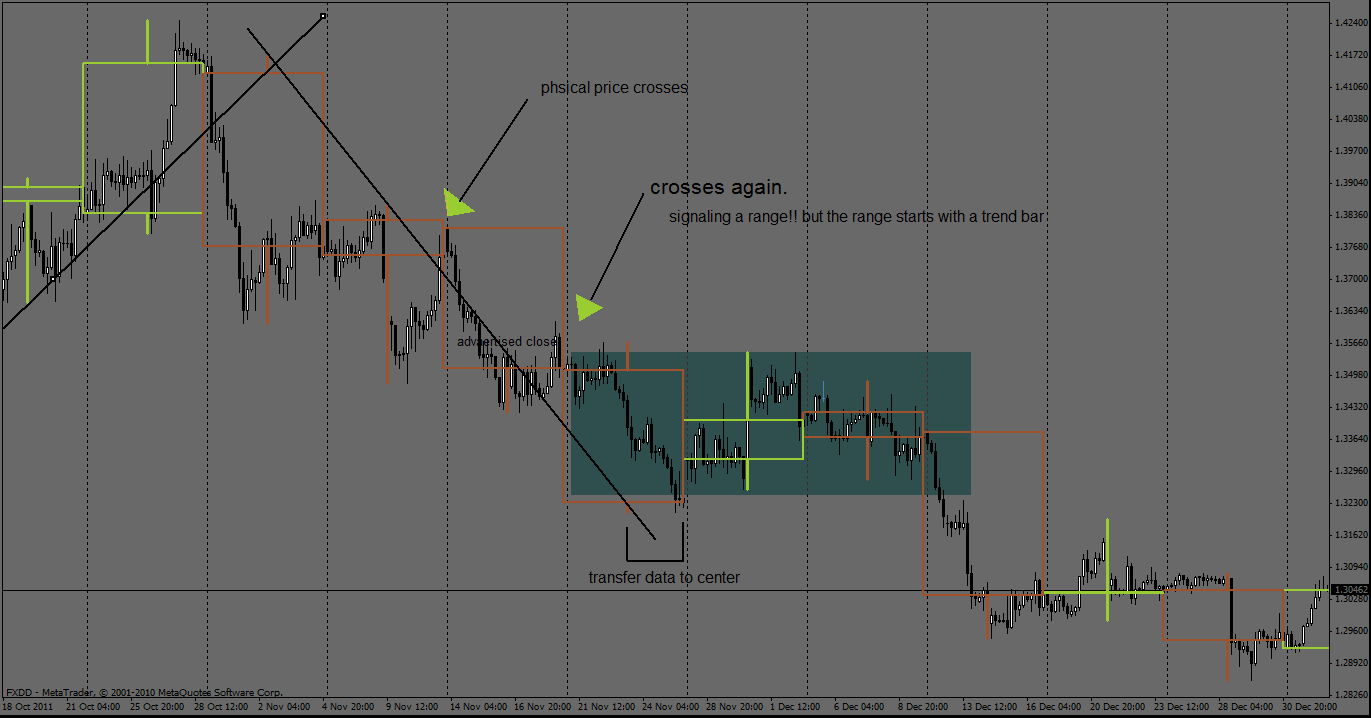
phsical price
physical price in relationship to the upper time frame trend lines tell you what time frame the range will be on.
if you want to see this in one candle form stay on the larger frequency. in swing form lower frequency.
so it's two crossing in close proximity , with advertised closes.
now you know what time frame to be on.
this works on all time frames starting from small to large when a trend starts.
because of time( time frame) depending on the next time period opening the price can range longer in time
crossing two or more upper time frame trend lines.
nice job
trend change , that is exactly correct...
nice job.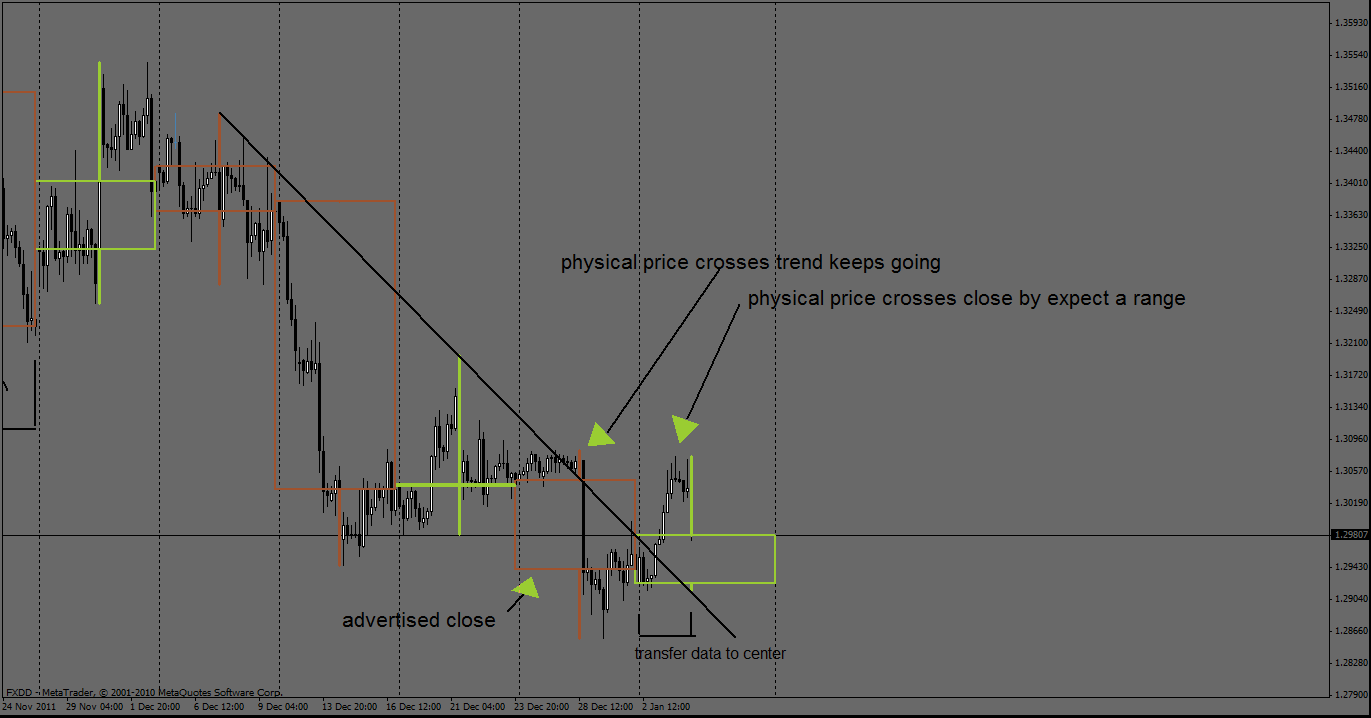
pin pointing the trade
stepping down two time frames to the four hour. you get the range in swing form.
you pin point the trade off the trap.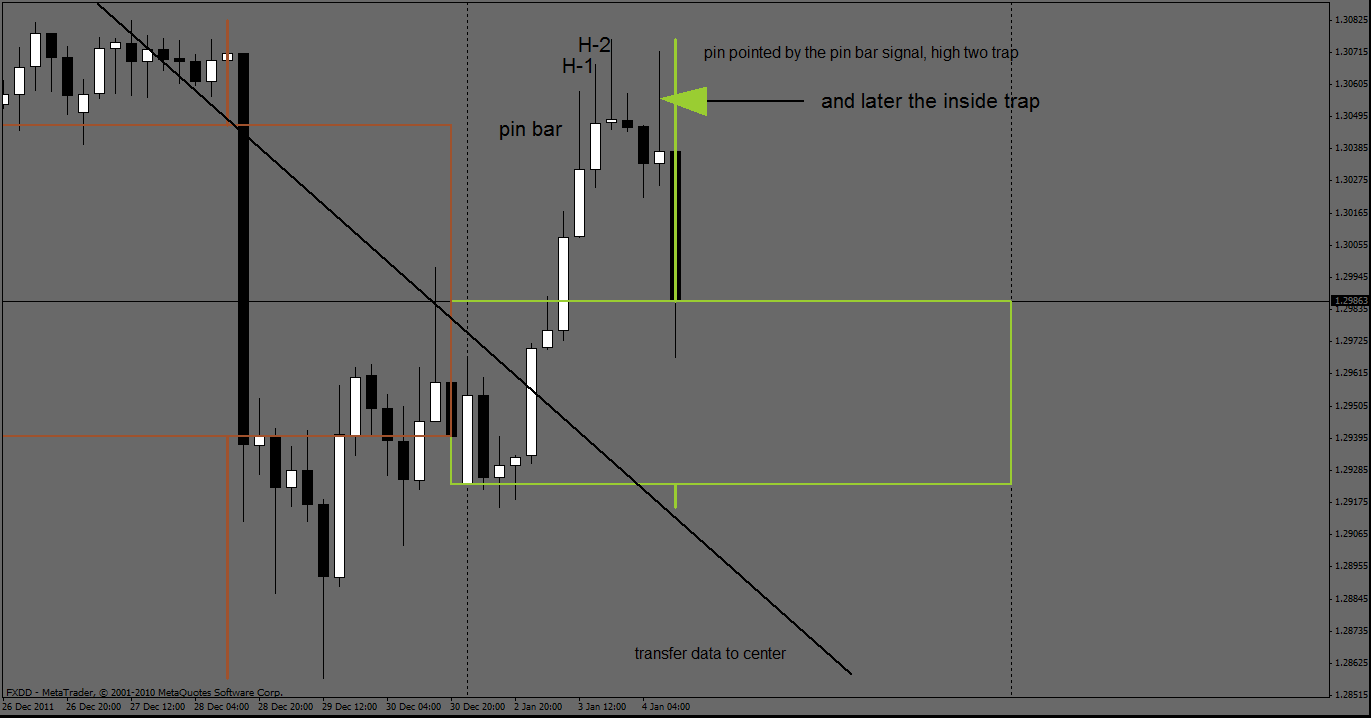
perfect trade!!
as soon as i am in a trade
well each trade, i look at two things:
#1. upper time frame analysis. target analysis.this involves several things
#2. what i call start from zero. zero is the entry point. this involves several things
what i do is lower my time frame at zero.
starting from zero. i go to the one minute time frame, with 30 minute over lays.
the next thing to do is gauge time....
A.... when is the next 30 minute time frame going to open?
B.... when is the next 1 hr time frame going to open?
c.... when is the next 4 hr time frame going to open?
d.... when is the new day going to open?
what is physical price doing compared to the upper time frames opens and trend line?
when looking for targets, it's relative.. how much profit are you willing to give up to keep the trade, and what does analysis
say about the target?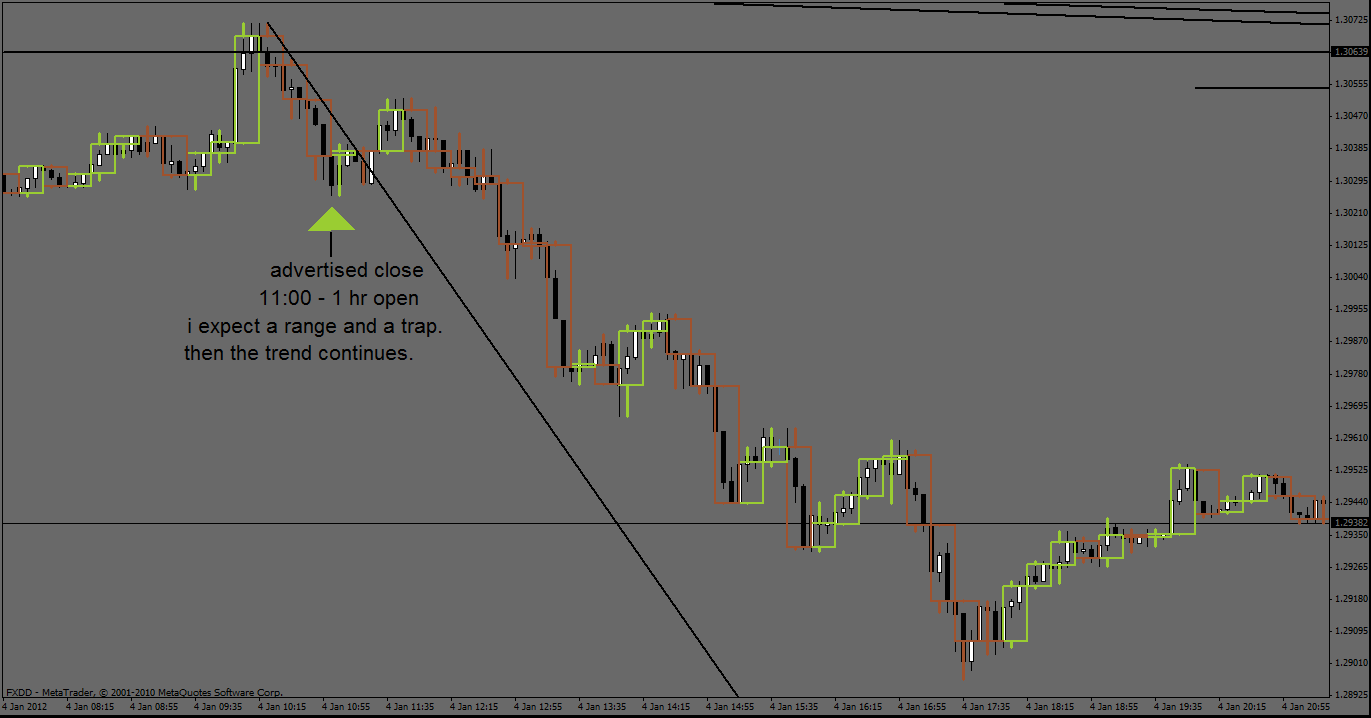
start small and work your way up.
of course you do not have to be this systematic when you have a good target analysis, but sometimes things are not as clear
as others.
this is stage one.
each trend line crossing
each time frame has its own range, that you must except as a reasonable loss to you.
if the range is twice as large as your typical risk then, a take profit and re-entry maybe a possibility.
if you have good target analysis then that can be the point of exit.
once a upper time frame trend line is crossed, and the trend continues i go up one time frame
with new overlays.
so we crossed th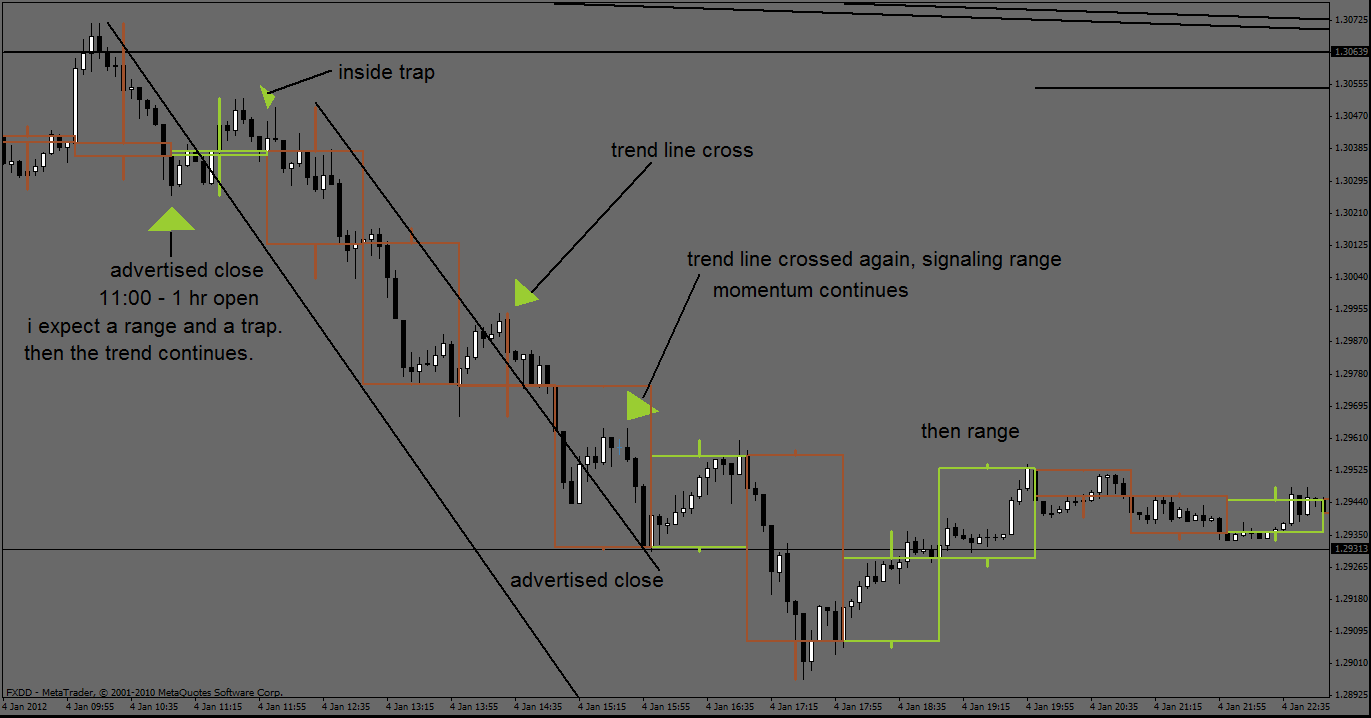 e thirty minute then we move to the one hour over lays with 15 minute time frame.