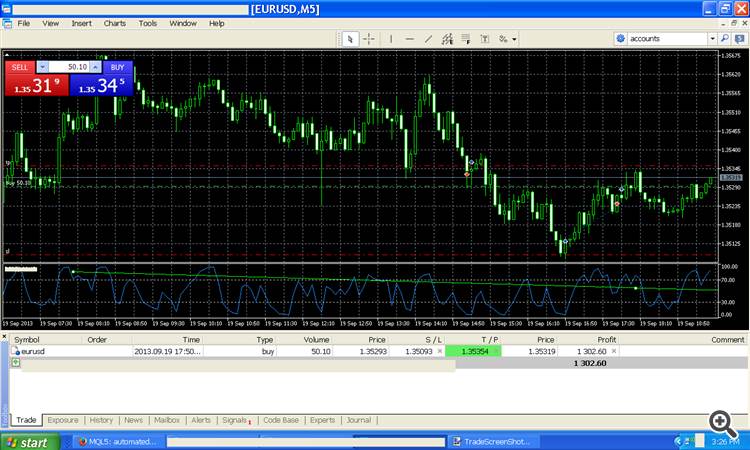
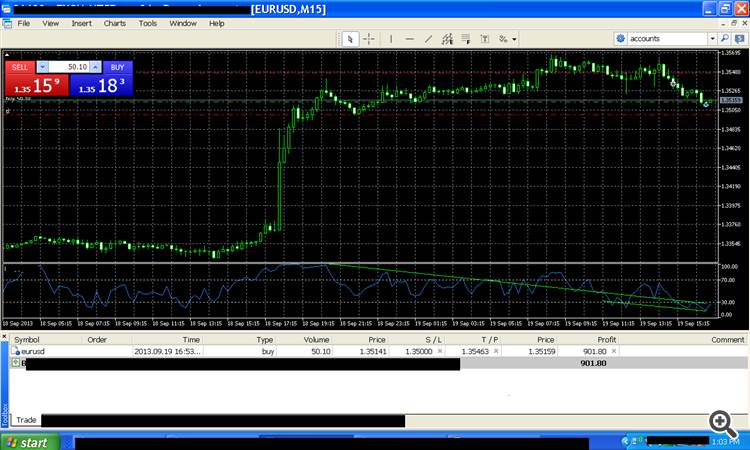
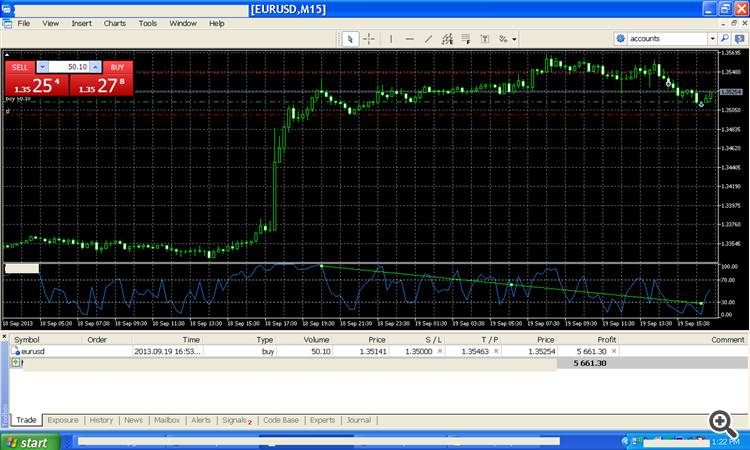
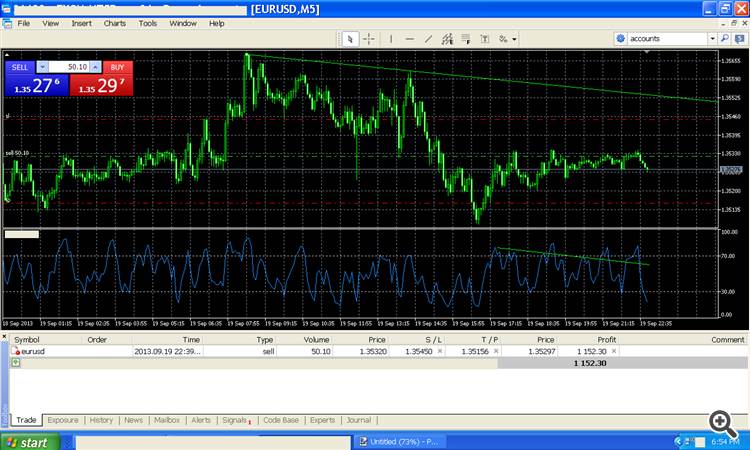
Yes, RSI trendline trading, same as a price channel trendline trading, not yet sure how to code it, but I will work on it.
A better picture of it, so you know the concept.Like a breakout of price but RSI break out, would be a good description. Can adjust the setting to get a good pattern look, however you want.
A better picture of it, so you know the concept.Like a breakout of price but RSI break out, would be a good description. Can adjust the setting to get a good pattern look, however you want.

Before you can code a strategy, this strategy have to be very clear. What you posted here isn't clear at all. Can you please explain what is this strategy ? It used RSI ok, but how ?
RSI trendline trading, same as a price channel trendline trading
Maybe. So what is the goal of this topic ? If it's the same as channel trendline trading what's the advantage/disadvantage to use RSI trendline. And how to use this RSI trendline ?
If you don't explain your system I don't see how this topic can be useful to anyone, so a moderator have probably to remove it.
It is trading the RSI trend line. The advantage is that you can get a better vision of the price pattern as you can see below. It is helpful for readers to see this strategy. I am not sure how to code it, but any ideas will be of help. Maybe you could figure it out or help with ideas. Just set the RSI the way you think is best to show the tops and bottoms. Simple, like trading trend lines on price. You should know what I am talking about by looking at it, you are experienced, new traders should or could simply look at the drawing of the trend lines for understanding. If a more experienced coder could offer suggestions how to turn it into EA, it could be very profitable, and helpful to all. I am contributing insight to this community, no reason to delete my work, it takes time for me to do this. Why would you want to do that to me..when I am helping your community. If you still do not understand, tell me exactly what you would need. I may have a link you could read..But I truly think you get it, you have the experience to understand this.
It is trading the RSI trend line. The advantage is that you can get a better vision of the price pattern as you can see below. It is helpful for readers to see this strategy. I am not sure how to code it, but any ideas will be of help. Maybe you could figure it out or help with ideas. Just set the RSI the way you think is best to show the tops and bottoms. Simple, like trading trend lines on price. You should know what I am talking about by looking at it, you are experienced, new traders should or could simply look at the drawing of the trend lines for understanding. If a more experienced coder could offer suggestions how to turn it into EA, it could be very profitable, and helpful to all. I am contributing insight to this community, no reason to delete my work, it takes time for me to do this. Why would you want to do that to me..when I am helping your community. If you still do not understand, tell me exactly what you would need. I may have a link you could read..But I truly think you get it, you have the experience to understand this.
I don't want to remove it, but you have to understand that simply posting a screenshot and say that it's RSI trendline and it's your strategy isn't useful. If you hope to gain the attention of a coder, you have to explain your system, probably it's obvious to you, but you have to made it obvious for others. I am simply trying to help you to develop your topic...with a little provocation ;-)
For example, the trendline you are drawing on RSI. If you (or someone else) want to code it, you have to define rules to draw it, and from what I see on your chart, it's not obvious. Seems you choose some high and ignore some others. You opened a position of 50.10 lots, that means 501$ per pip (0.0001), it's very big lot size. Anyway from what I saw and what I read, I still don't understand you strategy.
- Free trading apps
- Over 8,000 signals for copying
- Economic news for exploring financial markets
You agree to website policy and terms of use


This trade is identified by analysis of RSI. To code it would take convert top pattern to digits search similar and target. Strategy BY Ken McCormick