Press review - page 612


S&P 500 - bounced from 55-SMA/200-SMA reversal area to above for the bullish to be continuing (based on the article)

S&P 500 by MT5

  • "US 500: Retail trader data shows 39.5% of traders are net-long with the ratio of traders short to long at 1.53 to 1. In fact, traders have remained net-short since May 03 when US 500 traded near 2644.0; price has moved 4.3% higher since then. The number of traders net-long is 6.3% lower than yesterday and 7.7% higher from last week, while the number of traders net-short is 11.8% higher than yesterday and 15.8% higher from last week."
  • "We typically take a contrarian view to crowd sentiment, and the fact traders are net-short suggests US 500 prices may continue to rise. Traders are further net-short than yesterday and last week, and the combination of current sentiment and recent changes gives us a stronger US 500-bullish contrarian trading bias."

==========

The chart was made on MT5 with standard indicators of Metatrader 5

S&P 500 Continues to Rise After Reaching the Highest Level in 3 Months
  • Abdullah AlAmoudi
  • www.dailyfx.com
US 500: Retail trader data shows 39.5% of traders are net-long with the ratio of traders short to long at 1.53 to 1. In fact, traders have remained net-short since May 03 when US 500 traded near 2644.0; price has moved 4.3% higher since then. The number of traders net-long is 6.3% lower than yesterday and 7.7% higher from last week, while the...
 
Sergey Golubev:

This is NFP today - 


goood chart
 

AUD/USD Intra-Day Fundamentals: Australia Trade Balance and range price movement 

2018-05-07 02:30 GMT | [AUD - Trade Balance]

  • past data is 1.73B
  • forecast data is 0.98B
  • actual data is 0.98B according to the latest press release

if actual > forecast (or previous one) = good for currency (for AUD in our case)

[AUD - Trade Balance] = Difference in value between imported and exported goods and services during the reported month.

==========

From official report :

  • "In trend terms, the balance on goods and services was a surplus of $1,461m in April 2018, an increase of $300m on the surplus in March 2018."
  • "In seasonally adjusted terms, the balance on goods and services was a surplus of $977m in April 2018, a decrease of $754m on the surplus in March 2018."

==========

AUD/USD M5: range price movement by Australia Trade Balance news event 

AUD/USD chart by Metatrader 5

==========

Chart was made on MT5 with BrainTrading system (MT5) from this thread (free to download) as well as the following indicators from CodeBase:

All about BrainTrading system for MT5: 

8501.0 - Retail Trade, Australia, Apr 2018
  • www.abs.gov.au
APRIL KEY FIGURES APRIL KEY POINTS CURRENT PRICES The trend estimate rose 0.3% in April 2018. This follows a rise of 0.3% in March 2018 and a rise of 0.3% in February 2018. The seasonally adjusted estimate rose 0.4% in April 2018. This follows a relatively unchanged result (0.0%) in March 2018 and a rise of 0.6% in February 2018. In trend...
 

Dow Jones Industrial Average  - daily bullish breakout; 25,316 is the key (based on the article)
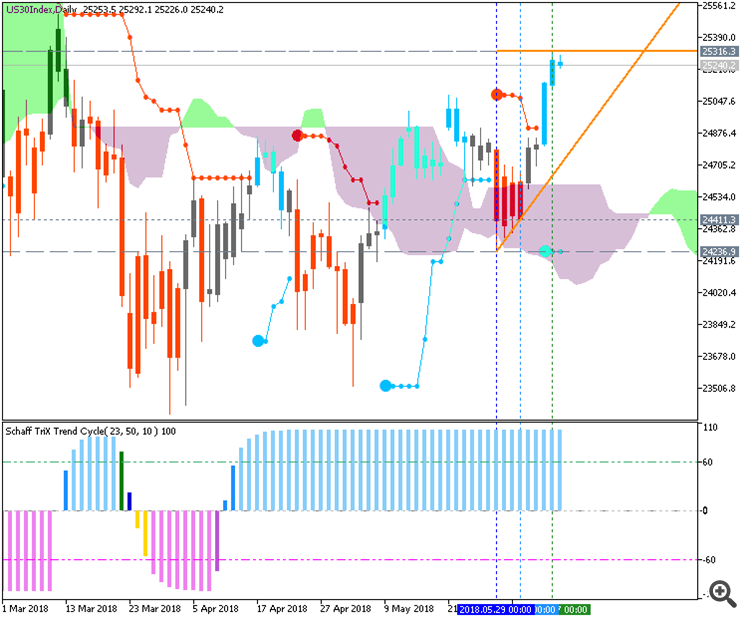
Dow Jones by MT5

  • "US stocks continue to show strength after the February pullback helped to build-in congestion formations across a number of indices. In the Dow, we looked at a bullish setup on Tuesday of this week, and prices have promptly took out both topside targets as buyers have continued to drive. This led to a bullish break of the symmetrical wedge formation that we've been following; along with a print of fresh two-month highs as buyers have remained in-control. "
  • "At this stage, those looking at longer-term strategies would likely want to await some element of pullback before looking to continue the move as the short-term formation here is quite stretched. The prior high could be of assistance, and this takes place at 25,078. This can be connected to the psychological level of 25,000 to produce a potential support zone that could be utilized on a pullback to open the door for bullish strategies."

==========

The chart was made on MT5 with Brainwashing system/AscTrend system (MT5) from this thread (free to download) together with following indicators:

Same system for MT4:

  1. Brainwashing. Trades: manually and using EAs (MT4)
  2. Brainwashing EAs - the thread (MT4)
  3. Brainwashing: system setup for trading manually and for EAs (MT4) - the thread 
  4. Brainwashing: system development (MT4) - the thread
Dow Jones: Bullish Break of Wedge on Way to Fresh Two-Month Highs
  • James Stanley
  • www.dailyfx.com
- The longer-term symmetrical wedge pattern remains in the Dow Jones despite the S&P 500’s topside break to fresh two-month highs. This keeps longer-term strategies at bay on the Dow, at least until we see some element of resolution in the longer-term wedge formation. Dow Jones Bullish Breakout Continues to Fresh Two-Month Highs Dow Jones...
 

USD/CNH Intra-Day FundamentalsChina Trade Balance and range price movement 

2018-05-08 04:15 GMT | [CNY - Trade Balance]

  • past data is 183B
  • forecast data is 238B
  • actual data is 157B according to the latest press release

if actual > forecast (or previous one) = good for currency (for CNY in our case)

[CNY - Trade Balance] = Difference in value between imported and exported goods during the previous month.

==========

From forexlive article :

  • "China trade balance for May is CNY +156.51bn for a miss on estimates."
  • "AUD is making a fresh session low after the data, sellers are not rushing this thing but they have been steady indeed. Curious that the headline is a miss but the details are not so bad."

==========

USD/CNH M5: range price movement by China Trade Balance news event 

USDCNH/AUDUSD correlation chart by Metatrader 5

==========

Chart was made on MT5 with BrainTrading system (MT5) from this thread (free to download) as well as the following indicators from CodeBase:

All about BrainTrading system for MT5: 

China trade balance for May: CNY +156.51bn (expected CNY 222bn)
  • 2018.06.08
  • www.forexlive.com
Exports +3.2% y/y in at a beat though, which is not too bad Imports +15.6% y/y and also a beat, a big one! AUD is making a fresh session low after the data, sellers are not rushing this...
 

GBP/USD: daily bear market rally, weekly correction (based on the article)

GBPUSD by Metatrader 5

  • "GBPUSD: Retail trader data shows 71.0% of traders are net-long with the ratio of traders long to short at 2.45 to 1. In fact, traders have remained net-long since Apr 20 when GBPUSD traded near 1.42353; price has moved 5.8% lower since then. The number of traders net-long is 1.6% lower than yesterday and 5.1% lower from last week, while the number of traders net-short is 0.4% lower than yesterday and 5.2% lower from last week. "
  • "We typically take a contrarian view to crowd sentiment, and the fact traders are net-long suggests GBPUSD prices may continue to fall. Positioning is less net-long than yesterday but more net-long from last week. The combination of current sentiment and recent changes gives us a further mixed GBPUSD trading bias."

==========

Chart was made on MT5 with Brainwashing system/AscTrend system (MT5) from this thread (free to download) together with following indicators:

==========

Same systems for MT4/MT5:

The beginning

  1. ASCTrend system, the beginning, part #1
  2. ASCTrend system, the beginning, part #2
  3. ASCTrend system, the beginning, part #3
  4. ASCTrend system, the beginning, part #4 
  5. Digital ASCTrend (Digital Filters with ASCTrend system combined).
  6. LabTrend (LabTrend indicators, LabTrendZigZag, templates, Labtrend EAs) - the thread 

After 

GBPUSD is Unlikely to Break Above Resistance at 1.34
  • Abdullah AlAmoudi
  • www.dailyfx.com
GBPUSD: Retail trader data shows 71.0% of traders are net-long with the ratio of traders long to short at 2.45 to 1. In fact, traders have remained net-long since Apr 20 when GBPUSD traded near 1.42353; price has moved 5.8% lower since then. The number of traders net-long is 1.6% lower than yesterday and 5.1% lower from last week, while the...
 

EUR/USD: Daily Bear Market Rally (based on the article)

EURUSD Daily Chart by Metatrader 5

  • "There is a key zone of support from around 11730 down to 11660, which EURUSD held on several occasions during the latter part of last year. The euro was able to recapture this once strong level of support last week and will be our first zone to watch for a higher-low to develop. "
  • "Should we see buyers step up in the aforementioned zone, we'll be look for at least one more thrust higher towards the 11900/12000-area. A successful test could already be in the rear-view mirror as not only on Friday did the top of the zone hold, but the trend-line off last week's low (most easily visible on the 4-hr chart) provided support as well. Even if the trend-line and Friday low were to break, as long as the low-end of the zone holds, the euro will remain in play for a dip-trip. If an aggressive decline starts to unfold, though, the trend-line extending higher from January 2017 will again come into play, along with the weekly support from 2015/16."
  • "It will be extremely important for those lower support levels to hold to keep the euro from quickly sinking much further. And even if a test and hold is successful at that point, the deeper retracement off the swing-high will take the wind out of the sails for the long-side until further repair can be done."
  • "We should learn a lot as to how the market feels about the euro in the week ahead with the FOMC on Wednesday and, even more importantly, the ECB on Thursday. With higher-than-normal volatility expected next week traders will want to adjust risk parameters accordingly."

============

The chart was made on Metatrader 5 using HWAFM tool pattern tool from this post.

EURUSD Weekly Technical Analysis: Buy Euro on a Dip? Fed & ECB Ahead
  • Paul Robinson
  • www.dailyfx.com
to rally after posting a reversal at long-term support, which it did for most of the week until Friday. The move lower to end the week wasn't damaging to a bullish outlook, and in fact viewed as a potential opportunity this coming week for would-be longs to buy the dip. There is a key zone of support from around 11730 down to 11660, which...
 

GBP/USD Intra-Day FundamentalsU.K. Factory production and range price movement 

2018-06-11 09:30 GMT | [GBP - Manufacturing Production]

  • past data is -0.1%
  • forecast data is 0.3%
  • actual data is -1.4% according to the latest press release

if actual > forecast (or previous one) = good for currency (for GBP in our case)

[GBP - Manufacturing Production] = Change in the total inflation-adjusted value of output produced by manufacturers.

==========

From official report :

  • "In April 2018, total production was estimated to have decreased by 0.8% compared with March 2018, led by a fall of 1.4% in manufacturing and supported by falls in energy supply (2.0%), and water and waste (1.8%)."
  • "The three-monthly fall to April 2018 in manufacturing of 0.5% is the largest fall since May 2017, due mainly to decreases in electrical equipment (9.4%), and basic metals and metal products (1.8%)."
  • "The fall in manufacturing is supported by widespread weakness throughout the sector due to a reduction in the growth rate of both export and domestic turnover."

==========

GBP/USD M5: range price movement by U.K. Factory production news event 

GBPUSD chart by Metatrader 5

==========

Chart was made on MT5 with BrainTrading system (MT5) from this thread (free to download) as well as the following indicators from CodeBase:

All about BrainTrading system for MT5: 


Hang Seng Index (HSI) - G7, Central Banks and US Fed; daily correction to the bearish reversal (adapted from the article)

Daily price is on secondary correction within the primary bullish matket condition: the price is breaking support level at 29,964 to below for the bearish reversal to be started.

Hang Seng Index (HSI) by Metatrader 5

  • "One of the key elements of the G7 meeting is the continued communication regarding global participation in key infrastructure projects and national cooperation in regards to economic stability. Right now, a lot of concern has been directed towards the Emerging Markets and what appears to be a near term market collapse. Debt spreads and global indexes have been moving in a pattern that clearly illustrates the Central Banks problems in containing the diverse economic conditions throughout the globe. Infrastructure projects, social/political shifts and currency valuations are complicating matters by creating extended pressures in many global economies recently. All of this centers around the strength of the US economy and the US dollar as related to expectations and valuations of other foreign economies and currencies."
  • "Almost like a double-edged sword, as the US economy/dollar continues to strengthen, foreign capital will migrate into these US assets because of the inherent protection and gains provided by the strength and growth of these markets. While at the same time, the exodus of capital from these foreign markets create a vacuum of value/capability that results in a continued decline in asset valuations and more."
  • "The Hang Seng Index is setting up a possible topping pattern that could break down given state and corporate debt concerns."
  • "Our opinion continues to support the hypothesis that the US markets are the only game on the planet (at the moment) and that a great capital shift is underway in terms of investment in, purchases of and generally opportunistic investment opportunities for US equities and markets going forward. Until something changes where the US dollar strength, foreign economic weakness and foreign debt cycles are abated or resolved, we believe the great capital shift that we have been warning of will continue which will put continued pressures on certain foreign markets and expand debt burdens of at-risk nations over time."

==========

The chart was made on MT5 with standard indicators of Metatrader 5 together with the following custom indicator:

G7, Central Banks and US Fed Will Drive Stock Prices This Week
  • www.thetechnicaltraders.com
After last weeks closing bell for stocks and the early signs of the Capital Market Shift which we mentioned previously was taking place are now clearly evident. We wanted to alert all of our followers that this week could be very dramatic with a number of key events playing into global expectations. Our research team at Technical Traders Ltd...
 

EUR/USD - daily bearish to be continuing; 1.1616 is the key (adapted from the article)

Daily price broke 55-SMA/200-SMA rangingg reversal area for the primary bearish market condition: the price is testing the support level at 1.1616 to below for the bearish trend to be continuing.

EUR/USD daily chart by Metatrader 5 standard indicators

  • "The Euro may be on the verge of resuming the down move started in mid-Mayagainst the US Dollar following a brief corrective upswing. Looking at the four-hour chart, prices are on the verse of clearing counter-trend support after failing to breach resistance in the 1.1821-47 area."
  • "Zooming out to the daily chart, a down move that takes prices back below the 1.1642-1.1723 area marked by the 14.6% and 23.6% Fibonacci retracement levels would open the door for another challenge of the 1.1527-77 zone. This is reinforced by the May 29 low at 1.1510."
  • "The EUR/USD short trade started from 1.2407 and thereafter scaled up near the 1.19 figure continues to be in play with net cost basis of 1.2276. Building out larger exposure upon confirmation of the counter-trend break is compelling but the looming ECB rate decision argues for caution. The trade will remain as-is for now, with a stop-loss to be activated on a discretionary basis."

==========

The chart was made on MT5 with standard indicators of Metatrader 5 together with the following custom indicator:

EUR/USD Technical Analysis: Euro Down Trend Back in Play?
  • Ilya Spivak
  • www.dailyfx.com
against the US Dollar following a brief corrective upswing. Looking at the four-hour chart, prices are on the verse of clearing counter-trend support after failing to breach resistance in the 1.1821-47 area. Zooming out to the daily chart, a down move that takes prices back below the 1.1642-1.1723 area marked by the 14.6% and 23.6% Fibonacci...
Reason: