Join our fan page

Vortex - indicator for MetaTrader 5

- Views:
- 10413
- Rating:
- Published:
-
 You are missing trading opportunities:
- Free trading apps
- Over 8,000 signals for copying
- Economic news for exploring financial markets
Registration Log inYou agree to website policy and terms of use
If you do not have an account, please register -
 Need a robot or indicator based on this code? Order it on Freelance
Go to Freelance
Need a robot or indicator based on this code? Order it on Freelance
Go to Freelance
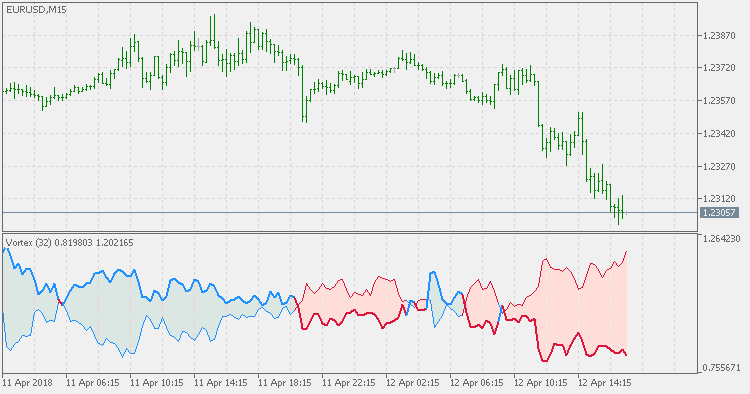
According to original description of the authors (Etienne Botes and Douglas Siepman) of the Vortex indicator:
After thoroughly researching technical tools, we concluded that the concept of the Directional Movement Index (DMI) offered the most accurate way to identify trend direction or significant price moves in the market. The concept of DMI was best defined and described by J. Welles Wilder in his classic 1978 book "New Concepts In Technical Trading Systems". The result of his work is the now-famous and highly effective indicator, which inspired the creation of our Vortex indicator.
To understand the Vortex indicator better, we must describe directional movement. The idea is that the individual relationship between price bars provides clues to the direction of the trend or market. Wilder summed it up thus: "Directional movement is the largest part of today's range that is outside yesterday's range."
Positive directional movement is simply the portion of a price bar that is above the high of the previous bar. Negative directional movement is the portion of the price bar that is lower than the previous low. The smaller of these two values is assigned a zero value. The larger number is used to indicate if the market is moving up (positive) or down (negative). In the case of an inside bar (if neither the high nor the low is higher or lower than the previous bar), a zero value is assigned to both positive and negative direction.
The result will be a string of seemingly random consecutive zeroes or positive numbers placed in two columns assigned for positive and negative directional movement. However, if these two strings of numbers are summed after 14, 21, or 55 periods, the larger value gives an indication of overall trend. If this process is continued, the result can be seen on a chart as two lines representing positive and negative directional movement. These will intersect and cross during a change of trend and diverge wider and wider as the strength of the trend increases. This is the basis of Wilder's DMI.
...
The article was published in the January 2010 issue of TASC.
We might add that Vortex seems to be working OK an all timeframes and can be used in a fairly reliable mode to determine trends.
Dsl - RSI of average
This indicator is using filtered prices for RSI (instead of using "raw" prices) and is using Discontinued Signal Line for trend assessment (instead of using slope or fixed levels).
Stochastic of Hull
Hull average is used prior to stochastic calculation thus filtering the prices before they are used in the stochastic calculation. This method is used since it adds much less lag than if the smoothing of the already calculated stochastic value would be used.
Polychromatic Momentum
Polychromatic momentum takes an weighted average of all significant lookback periods for the tradable.
Polychromatic Momentum - extended
This version of Polychromatic Momentum is using double smoothed EMA for smoothing. DSEMA has been proven for producing very good smooth results with a lag that is almost non-existent, hence, in combination with it, the Polychromatic Momentum indicator becomes much more usable when it comes to signals.