Articles on data analysis and statistics in MQL5
Articles on mathematical models and laws of probability are interesting for many traders. Mathematics is the basis of technical indicators, and statistics is required to analyze trading results and develop strategies.
Read about the fuzzy logic, digital filters, market profile, Kohonen maps, neural gas and many other tools that can be used for trading.
Add a new article

You are missing trading opportunities:
- Free trading apps
- Over 8,000 signals for copying
- Economic news for exploring financial markets
Registration
Log in
You agree to website policy and terms of use
If you do not have an account, please register

Larry Williams Market Secrets (Part 7): An Empirical Study of the Trade Day of the Week Concept
An empirical study of Larry Williams’ Trade Day of the Week concept, showing how time-based market bias can be measured, tested, and applied using MQL5. This article presents a practical framework for analyzing win rates and performance across trading days to improve short-term trading systems.

Developing Trend Trading Strategies Using Machine Learning
This study introduces a novel methodology for the development of trend-following trading strategies. This section describes the process of annotating training data and using it to train classifiers. This process yields fully operational trading systems designed to run on MetaTrader 5.

Statistical Arbitrage Through Cointegrated Stocks (Part 10): Detecting Structural Breaks
This article presents the Chow test for detecting structural breaks in pair relationships and the application of the Cumulative Sum of Squares - CUSUM - for structural breaks monitoring and early detection. The article uses the Nvidia/Intel partnership announcement and the US Gov foreign trade tariff announcement as examples of slope inversion and intercept shift, respectively. Python scripts for all the tests are provided.

Python-MetaTrader 5 Strategy Tester (Part 04): Tester 101
In this fascinating article, we build our very first trading robot in the simulator and run a strategy testing action that resembles how the MetaTrader 5 strategy tester works, then compare the outcome produced in a custom simulation against our favorite terminal.

Forex Arbitrage Trading: Relationship Assessment Panel
This article presents the development of an arbitrage analysis panel in MQL5. How to get fair exchange rates on Forex in different ways? Create an indicator to obtain deviations of market prices from fair exchange rates, as well as to assess the benefits of arbitrage ways of exchanging one currency for another (as in triangular arbitrage).

Central Force Optimization (CFO) algorithm
The article presents the Central Force Optimization (CFO) algorithm inspired by the laws of gravity. It explores how principles of physical attraction can solve optimization problems where "heavier" solutions attract less successful counterparts.

MQL5 Trading Tools (Part 12): Enhancing the Correlation Matrix Dashboard with Interactivity
In this article, we enhance the correlation matrix dashboard in MQL5 with interactive features like panel dragging, minimizing/maximizing, hover effects on buttons and timeframes, and mouse event handling for improved user experience. We add sorting of symbols by average correlation strength in ascending/descending modes, toggle between correlation and p-value views, and incorporate light/dark theme switching with dynamic color updates.

Build a Remote Forex Risk Management System in Python
We are making a remote professional risk manager for Forex in Python, deploying it on the server step by step. In the course of the article, we will understand how to programmatically manage Forex risks, and how not to waste a Forex deposit any more.

Creating Custom Indicators in MQL5 (Part 5): WaveTrend Crossover Evolution Using Canvas for Fog Gradients, Signal Bubbles, and Risk Management
In this article, we enhance the Smart WaveTrend Crossover indicator in MQL5 by integrating canvas-based drawing for fog gradient overlays, signal boxes that detect breakouts, and customizable buy/sell bubbles or triangles for visual alerts. We incorporate risk management features with dynamic take-profit and stop-loss levels calculated via candle multipliers or percentages, displayed through lines and a table, alongside options for trend filtering and box extensions.

Market Simulation (Part 09): Sockets (III)
Today's article is a continuation of the previous one. We will look at the implementation of an Expert Advisor, focusing mainly on how the server code is executed. The code given in the previous article is not enough to make everything work as expected, so we need to dig a little deeper into it. Therefore, it is necessary to read both articles to better understand what will happen.

Reimagining Classic Strategies (Part 21): Bollinger Bands And RSI Ensemble Strategy Discovery
This article explores the development of an ensemble algorithmic trading strategy for the EURUSD market that combines the Bollinger Bands and the Relative Strength Indicator (RSI). Initial rule-based strategies produced high-quality signals but suffered from low trade frequency and limited profitability. Multiple iterations of the strategy were evaluated, revealing flaws in our understanding of the market, increased noise, and degraded performance. By appropriately employing statistical learning algorithms, shifting the modeling target to technical indicators, applying proper scaling, and combining machine learning forecasts with classical trading rules, the final strategy achieved significantly improved profitability and trade frequency while maintaining acceptable signal quality.

MQL5 Trading Tools (Part 11): Correlation Matrix Dashboard (Pearson, Spearman, Kendall) with Heatmap and Standard Modes
In this article, we build a correlation matrix dashboard in MQL5 to compute asset relationships using Pearson, Spearman, and Kendall methods over a set timeframe and bars. The system offers standard mode with color thresholds and p-value stars, plus heatmap mode with gradient visuals for correlation strengths. It includes an interactive UI with timeframe selectors, mode toggles, and a dynamic legend for efficient analysis of symbol interdependencies.

Forex arbitrage trading: Analyzing synthetic currencies movements and their mean reversion
In this article, we will examine the movements of synthetic currencies using Python and MQL5 and explore how feasible Forex arbitrage is today. We will also consider ready-made Python code for analyzing synthetic currencies and share more details on what synthetic currencies are in Forex.

Python-MetaTrader 5 Strategy Tester (Part 02): Dealing with Bars, Ticks, and Overloading Built-in Functions in a Simulator
In this article, we introduce functions similar to those provided by the Python-MetaTrader 5 module, providing a simulator with a familiar interface and a custom way of handling bars and ticks internally.

Forex arbitrage trading: A simple synthetic market maker bot to get started
Today we will take a look at my first arbitrage robot — a liquidity provider (if you can call it that) for synthetic assets. Currently, this bot is successfully operating as a module in a large machine learning system, but I pulled up an old Forex arbitrage robot from the cloud, so let's take a look at it and think about what we can do with it today.

Fibonacci in Forex (Part I): Examining the Price-Time Relationship
How does the market observe Fibonacci-based relationships? This sequence, where each subsequent number is equal to the sum of the two previous ones (1, 1, 2, 3, 5, 8, 13, 21...), not only describes the growth of the rabbit population. We will consider the Pythagorean hypothesis that everything in the world is subject to certain relationships of numbers...

Sigma Score Indicator for MetaTrader 5: A Simple Statistical Anomaly Detector
Build a practical MetaTrader 5 “Sigma Score” indicator from scratch and learn what it really measures: The z-score of log returns (how many standard deviations the latest move is from the recent average). The article walks through every code block in OnInit(), OnCalculate(), and OnDeinit(), then shows how to interpret thresholds (e.g., ±2) and apply the Sigma Score as a simple “market stress meter” for mean-reversion and momentum trading.

Neuroboids Optimization Algorithm (NOA)
A new bioinspired optimization metaheuristic, NOA (Neuroboids Optimization Algorithm), combines the principles of collective intelligence and neural networks. Unlike conventional methods, the algorithm uses a population of self-learning "neuroboids", each with its own neural network that adapts its search strategy in real time. The article reveals the architecture of the algorithm, the mechanisms of self-learning of agents, and the prospects for applying this hybrid approach to complex optimization problems.

Building Volatility models in MQL5 (Part I): The Initial Implementation
In this article, we present an MQL5 library for modeling volatility, designed to function similarly to Python's arch package. The library currently supports the specification of common conditional mean (HAR, AR, Constant Mean, Zero Mean) and conditional volatility (Constant Variance, ARCH, GARCH) models.

Market Simulation (Part 08): Sockets (II)
How about creating something practical using sockets? In today's article, we'll start creating a mini-chat. Let's look together at how this is done - it will be very interesting. Please note that the code provided here is for educational purposes only. It should not be used for commercial purposes or in ready-made applications, as it does not provide data transfer security and the content transmitted over the socket can be accessed.

Successful Restaurateur Algorithm (SRA)
Successful Restaurateur Algorithm (SRA) is an innovative optimization method inspired by restaurant business management principles. Unlike traditional approaches, SRA does not discard weak solutions, but improves them by combining with elements of successful ones. The algorithm shows competitive results and offers a fresh perspective on balancing exploration and exploitation in optimization problems.

Implementing Practical Modules from Other Languages in MQL5 (Part 06): Python-Like File IO operations in MQL5
This article shows how to simplify complex MQL5 file operations by building a Python-style interface for effortless reading and writing. It explains how to recreate Python’s intuitive file-handling patterns through custom functions and classes. The result is a cleaner, more reliable approach to MQL5 file I/O.

Data Science and ML (Part 47): Forecasting the Market Using the DeepAR model in Python
In this article, we will attempt to predict the market with a decent model for time series forecasting named DeepAR. A model that is a combination of deep neural networks and autoregressive properties found in models like ARIMA and Vector Autoregressive (VAR).

Creating a mean-reversion strategy based on machine learning
This article proposes another original approach to creating trading systems based on machine learning, using clustering and trade labeling for mean reversion strategies.

Billiards Optimization Algorithm (BOA)
The BOA method is inspired by the classic game of billiards and simulates the search for optimal solutions as a game with balls trying to fall into pockets representing the best results. In this article, we will consider the basics of BOA, its mathematical model, and its efficiency in solving various optimization problems.

Creating Custom Indicators in MQL5 (Part 2): Building a Gauge-Style RSI Display with Canvas and Needle Mechanics
In this article, we develop a gauge-style RSI indicator in MQL5 that visualizes Relative Strength Index values on a circular scale with a dynamic needle, color-coded ranges for overbought and oversold levels, and customizable legends. We utilize the Canvas class to draw elements like arcs, ticks, and pies, ensuring smooth updates on new RSI data.

Statistical Arbitrage Through Cointegrated Stocks (Part 9): Backtesting Portfolio Weights Updates
This article describes the use of CSV files for backtesting portfolio weights updates in a mean-reversion-based strategy that uses statistical arbitrage through cointegrated stocks. It goes from feeding the database with the results of a Rolling Windows Eigenvector Comparison (RWEC) to comparing the backtest reports. In the meantime, the article details the role of each RWEC parameter and its impact in the overall backtest result, showing how the comparison of the relative drawdown can help us to further improve those parameters.
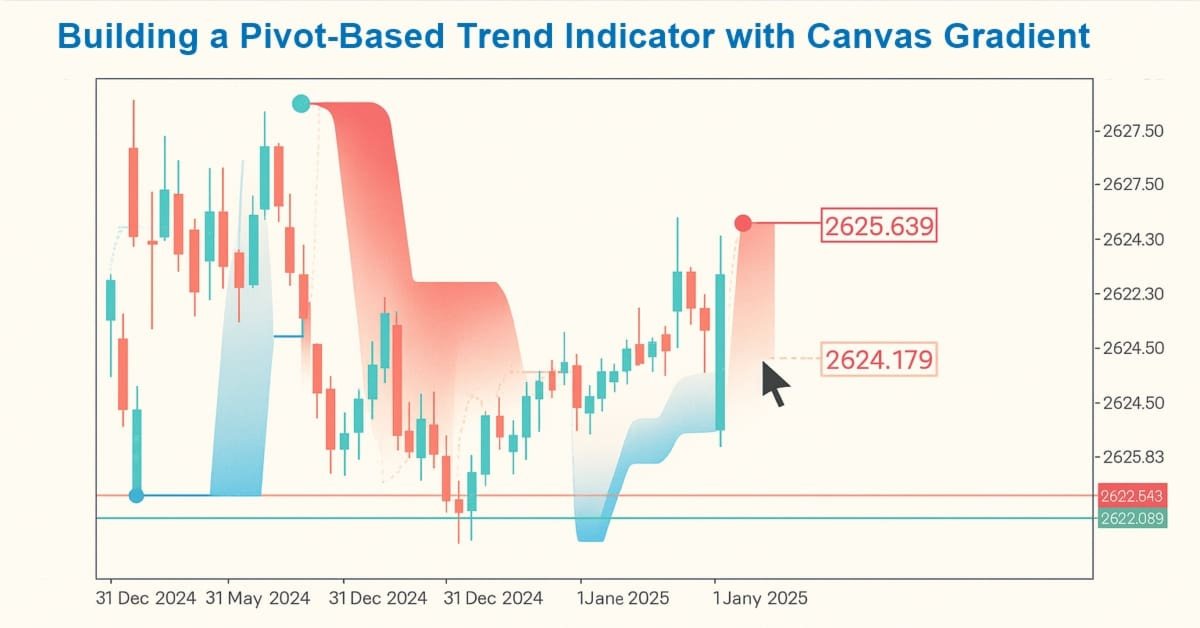
Creating Custom Indicators in MQL5 (Part 1): Building a Pivot-Based Trend Indicator with Canvas Gradient
In this article, we create a Pivot-Based Trend Indicator in MQL5 that calculates fast and slow pivot lines over user-defined periods, detects trend directions based on price relative to these lines, and signals trend starts with arrows while optionally extending lines beyond the current bar. The indicator supports dynamic visualization with separate up/down lines in customizable colors, dotted fast lines that change color on trend shifts, and optional gradient filling between lines, using a canvas object for enhanced trend-area highlighting.
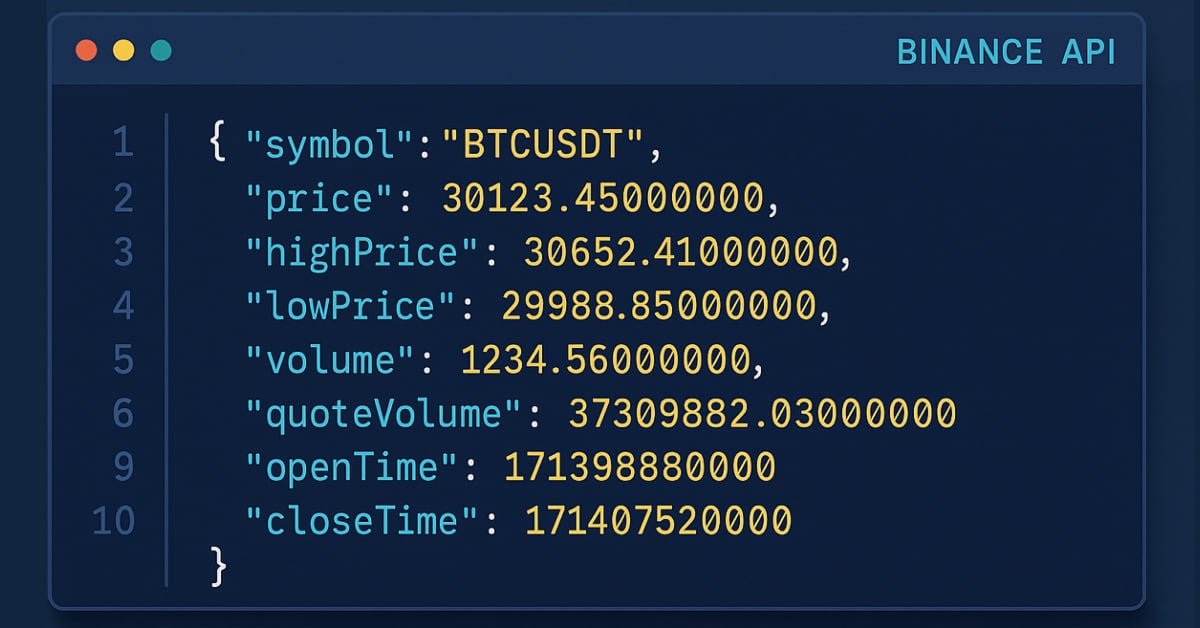
Introduction to MQL5 (Part 31): Mastering API and WebRequest Function in MQL5 (V)
Learn how to use WebRequest and external API calls to retrieve recent candle data, convert each value into a usable type, and save the information neatly in a table format. This step lays the groundwork for building an indicator that visualizes the data in candle format.

Chaos Game Optimization (CGO)
The article presents a new metaheuristic algorithm, Chaos Game Optimization (CGO), which demonstrates a unique ability to maintain high efficiency when dealing with high-dimensional problems. Unlike most optimization algorithms, CGO not only does not lose, but sometimes even increases performance when scaling a problem, which is its key feature.

Statistical Arbitrage Through Cointegrated Stocks (Part 8): Rolling Windows Eigenvector Comparison for Portfolio Rebalancing
This article proposes using Rolling Windows Eigenvector Comparison for early imbalance diagnostics and portfolio rebalancing in a mean-reversion statistical arbitrage strategy based on cointegrated stocks. It contrasts this technique with traditional In-Sample/Out-of-Sample ADF validation, showing that eigenvector shifts can signal the need for rebalancing even when IS/OOS ADF still indicates a stationary spread. While the method is intended mainly for live trading monitoring, the article concludes that eigenvector comparison could also be integrated into the scoring system—though its actual contribution to performance remains to be tested.

Currency pair strength indicator in pure MQL5
We are going to develop a professional indicator for currency strength analysis in MQL5. This step-by-step guide will show you how to develop a powerful trading tool with a visual dashboard for MetaTrader 5. You will learn how to calculate the strength of currency pairs across multiple timeframes (H1, H4, D1), implement dynamic data updates, and create a user-friendly interface.

Implementing Practical Modules from Other Languages in MQL5 (Part 05): The Logging module from Python, Log Like a Pro
Integrating Python's logging module with MQL5 empowers traders with a systematic logging approach, simplifying the process of monitoring, debugging, and documenting trading activities. This article explains the adaptation process, offering traders a powerful tool for maintaining clarity and organization in trading software development.

Capital management in trading and the trader's home accounting program with a database
How can a trader manage capital? How can a trader and investor keep track of expenses, income, assets, and liabilities? I am not just going to introduce you to accounting software; I am going to show you a tool that might become your reliable financial navigator in the stormy sea of trading.

Automating Trading Strategies in MQL5 (Part 44): Change of Character (CHoCH) Detection with Swing High/Low Breaks
In this article, we develop a Change of Character (CHoCH) detection system in MQL5 that identifies swing highs and lows over a user-defined bar length, labels them as HH/LH for highs or LL/HL for lows to determine trend direction, and triggers trades on breaks of these swing points, indicating a potential reversal, and trades the breaks when the structure changes.

Automating Trading Strategies in MQL5 (Part 43): Adaptive Linear Regression Channel Strategy
In this article, we implement an adaptive Linear Regression Channel system in MQL5 that automatically calculates the regression line and standard deviation channel over a user-defined period, only activates when the slope exceeds a minimum threshold to confirm a clear trend, and dynamically recreates or extends the channel when the price breaks out by a configurable percentage of channel width.

Price Action Analysis Toolkit Development (Part 53): Pattern Density Heatmap for Support and Resistance Zone Discovery
This article introduces the Pattern Density Heatmap, a price‑action mapping tool that transforms repeated candlestick pattern detections into statistically significant support and resistance zones. Rather than treating each signal in isolation, the EA aggregates detections into fixed price bins, scores their density with optional recency weighting, and confirms levels against higher‑timeframe data. The resulting heatmap reveals where the market has historically reacted—levels that can be used proactively for trade timing, risk management, and strategy confidence across any trading style.

Market Positioning Codex for VGT with Kendall's Tau and Distance Correlation
In this article, we look to explore how a complimentary indicator pairing can be used to analyze the recent 5-year history of Vanguard Information Technology Index Fund ETF. By considering two options of algorithms, Kendall’s Tau and Distance-Correlation, we look to select not just an ideal indicator pair for trading the VGT, but also suitable signal-pattern pairings of these two indicators.

Market Simulation (Part 07): Sockets (I)
Sockets. Do you know what they are for or how to use them in MetaTrader 5? If the answer is no, let's start by studying them. In today's article, we'll cover the basics. Since there are several ways to do the same thing, and we are always interested in the result, I want to show that there is indeed a simple way to transfer data from MetaTrader 5 to other programs, such as Excel. However, the main idea is not to transfer data from MetaTrader 5 to Excel, but the opposite, that is, to transfer data from Excel or any other program to MetaTrader 5.

Price Action Analysis Toolkit Development (Part 52): Master Market Structure with Multi-Timeframe Visual Analysis
This article presents the Multi‑Timeframe Visual Analyzer, an MQL5 Expert Advisor that reconstructs and overlays higher‑timeframe candles directly onto your active chart. It explains the implementation, key inputs, and practical outcomes, supported by an animated demo and chart examples showing instant toggling, multi‑timeframe confirmation, and configurable alerts. Read on to see how this tool can make chart analysis faster, clearer, and more efficient.