
Developing a Replay System — Market simulation (Part 12): Birth of the SIMULATOR (II)

Introduction
In the previous article Developing a Replay System — Market simulation (Part 11): Birth of the SIMULATOR (I), we have made our replay/simulation system capable of using 1-minute bars to simulate possible market movements. Although, perhaps, after reading this material, you noticed that the movements are not so similar to the movements of the real market. In that article, I showed the points that need to be changed in order for the system to be even closer to what you see in the real market. However, no matter how many attempts and experiments you make using simple methods, you will not be able to create anything similar to possible and probable market movements.
Starting implementation
To make everything necessary and add some complexity to the system, we are going to use random number generation. This will make things less predictable and make the replay /simulation system more interesting. Following the tips for generating random numbers given in the MQL5 documentation, we will need to perform several steps, which at first glance are quite simple. There's no reason to worry, it's actually quite simple. Here is what we will initially add to the code:
void InitSymbolReplay(void)
        {
                Print("************** Market Replay Service **************");
                srand(GetTickCount());
                GlobalVariableDel(def_GlobalVariableReplay);
                SymbolSelect(def_SymbolReplay, false);
                CustomSymbolDelete(def_SymbolReplay);
                CustomSymbolCreate(def_SymbolReplay, StringFormat("Custom\\%s", def_SymbolReplay), _Symbol);
                CustomRatesDelete(def_SymbolReplay, 0, LONG_MAX);
                CustomTicksDelete(def_SymbolReplay, 0, LONG_MAX);
                SymbolSelect(def_SymbolReplay, true);
        }
Here we strictly follow the tips from the documentation. You can verify this by looking at the function srand, which initializes the generation of pseudorandom numbers. As explained in the documentation itself, if we use a fixed value in the call, for example:
srand(5);
We will always receive the same number sequence. This way we stop the random generation and get a "predictable" sequence. Note that I put the word "predictable" in quotes because the sequence will always be the same. However, until the entire generation loop is completed, we will not know exactly what the next value will be. In some ways this can be interesting if we want to create a simulation in which the simulated sequence is always the same. On the other hand, this approach makes it very easy due to which it is impossible to get a good learning experience using the system.
If you are using the tester to create custom studies, there is no point in creating a large number of different files. We can create just one file and use it to introduce all the randomness. For this reason I'm not going to specify a fixed value when calling srand. Let chance take care of that. However, this is left to everyone's discretion.
Let's experiment with a more complex way of performing tasks.
The first thing we'll do is eliminate the fact that we're starting by looking for a minimum. Knowing this, everything will be very simple. We'll just wait for the new bar to open and execute a sell operation. If it exceeds the opening, we will perform by. But this is not training, this is cheating.
Note: Some Expert Advisors can analyze and notice such things, this happens in the strategy tester. The fact that the Expert Advisor can notice this invalidates any simulation performed.
To do this we will have to complicate the situation. We are going to use a very simple but quite effective method. Let's look at the code below.
inline int SimuleBarToTicks(const MqlRates &rate, MqlTick &tick[])
                        {
                                int t0 = 0;
                                long v0, v1, v2, msc;
                                bool b1 = ((rand() & 1) == 1);
                                double p0, p1;

                                m_Ticks.Rate[++m_Ticks.nRate] = rate;
                                p0 = (b1 ? rate.low : rate.high);
                                p1 = (b1 ? rate.high : rate.low);
                                Pivot(rate.open, p0, t0, tick);
                                Pivot(p0, p1, t0, tick);
                                Pivot(p1, rate.close, t0, tick, true);
                                v0 = (long)(rate.real_volume / (t0 + 1));
                                v1 = 0;
                                msc = 5;
                                v2 = ((60000 - msc) / (t0 + 1));
                                for (int c0 = 0; c0 <= t0; c0++, v1 += v0)
                                {
                                        tick[c0].volume_real = (v0 * 1.0);
                                        tick[c0].time = rate.time + (datetime)(msc / 1000);
                                        tick[c0].time_msc = msc % 1000;
                                        msc += v2;
                                }
                                tick[t0].volume_real = ((rate.real_volume - v1) * 1.0);

                                return t0;
                        }
Please don't be afraid of what the above function does because everything remains the same as before. The only change is that now we won't know if the bar will start looking for a minimum or a maximum. The first step is to check whether the randomly generated value is even or odd. Once we know this, we will simply swap the values which will create our pivot point. But keep in mind that the pivot point will still be created in the same way. The only thing we won't know is whether the bar is going up because it has already reached the minimum, or going down because it has already reached the maximum.
This is the beginning. We need to make another change before moving on to the next step. What is the change? In the previous version there were usually 9 segments between the opening and closing of the bar, but with just a little bit of code we will turn those 9 segments into 11 segments. But how? Look at the code below:
#define def_NPASS 3
inline int SimuleBarToTicks(const MqlRates &rate, MqlTick &tick[])
                        {
                                int t0 = 0;
                                long v0, v1, v2, msc;
                                bool b1 = ((rand() & 1) == 1);
                                double p0, p1, p2;

                                m_Ticks.Rate[++m_Ticks.nRate] = rate;
                                p0 = (b1 ? rate.low : rate.high);
                                p1 = (b1 ? rate.high : rate.low);
                                p2 = floor((rate.high - rate.low) / def_NPASS);
                                Pivot(rate.open, p0, t0, tick);
                                for (int c0 = 1; c0 < def_NPASS; c0++, p0 = (b1 ? p0 + p2 : p0 - p2)) Pivot(p0, (b1 ? p0 + p2 : p0 - p2), t0, tick);
                                Pivot(p0, p1, t0, tick);
                                Pivot(p1, rate.close, t0, tick, true);
                                v0 = (long)(rate.real_volume / (t0 + 1));
                                v1 = 0;
                                msc = 5;
                                v2 = ((60000 - msc) / (t0 + 1));
                                for (int c0 = 0; c0 <= t0; c0++, v1 += v0)
                                {
                                        tick[c0].volume_real = (v0 * 1.0);
                                        tick[c0].time = rate.time + (datetime)(msc / 1000);
                                        tick[c0].time_msc = msc % 1000;
                                        msc += v2;
                                }
                                tick[t0].volume_real = ((rate.real_volume - v1) * 1.0);

                                return t0;
                        }
#undef def_NPASS
You might think they are the same, but in fact there is a big difference. Although we only added one variable to represent the intermediate point, once we find this point we can add two more segments. Note that to add these two segments, we will continue to execute almost the same code. Please note that the complexity we introduce in forming a bar when creating a simulation increases quickly, and not at the same rate as we increase the code. One small detail we should pay attention to is that the definition should not be set to zero. If this happens, we will get a division by zero error. In this case, the minimum we should use is the value of 1 in the definition. But if you define any value from 1 to any maximum, you can add more segments. Since we usually don't have wide enough movements to create more segments, a value of 3 is fine.
To understand what happened here, see the following images.
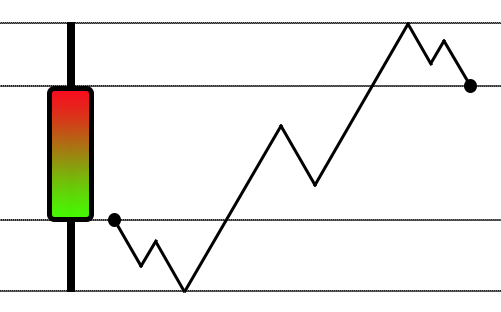
Before adding new segments
Although everything worked fine, when we use the version that allows us to divide the amplitude into ranges, we will have the following scenario:

After the change, we begin to divide the bar range by 3
Note how the complexity has improved a bit. However, I did not notice a big advantage in dividing into more than 3 segments. So while things have already gotten pretty interesting, the system doesn't generate as much complexity as it should. So we'll have to take a different approach. This will not cause the code to become much more complex. The idea is to achieve an exponential increase in complexity without overly complicating the code.
To achieve this, we will take a completely different approach. But first, let's consider something that deserves explanation. This way we can really understand why we are changing our approach to solving the problem.
If you paid attention to the changes made in the previous step, you might have noticed something interesting in the final code. For a moment we will have control over the entire body of the bar and will be able to do whatever we want with it. Unlike other times, we have a relatively directional movement, from the open to the high or low. When we need to work on the entire body of the bar, we do very little work inside it. No matter how hard we try, we always get stuck in the same situation, but if you look closely, you will notice that we always have two values that we can work on. These are the starting point and ending point. Why should you pay attention to this moment? Think about it for a moment: We have 60 thousand milliseconds to create a 1-minute bar, if we leave a margin of 5 milliseconds at the beginning of the bar, we will still have a lot of time. If we do some simple calculations, we will notice that we are wasting a lot of time, which could be used to make the bar simulation much more complex.
We can come up with a possible solution: if we leave 1 second free for the price to leave the opening point and go towards the high or low, and leave 1 second for the price to move from there to the closing point, we will have 58 seconds to create the desired complexity. However, notice what was said about the last second: "the price moves from where it is and goes to the closing point" It is important to realize and understand exactly what was said. No matter what happens most of the time, we should always reserve a period of time for the price to eventually reach the closing point.
You will notice a movement that occurs at a longer time, at just over 33 milliseconds or 30 Hz. If we set the maximum duration of each tick to 30 milliseconds, you will find that the movement will be quite similar to the movement of the asset. An important detail: this perception is very relative, since some people find it difficult to trade an asset that moves very quickly due to its high volatility.
For this reason, the replay/simulation system should not really be considered good learning. Unless we are actually using a file containing actual traded ticks. When you simulate such ticks, there may be a false impression that all price ranges will be visited. Currently, this system does not allow 1-minute bars to be simulated in a way that generates gaps, although in the real market these gaps actually occur at very specific times. These are very dangerous times to open or close a trade as the likelihood of the order being executed outside of the desired price is very high and the likelihood of it simply being missed is also huge due to the fact that the volatility can be very high which makes everything work perfectly in an unexpected way.
I guess you might think that I'm going to use a method that always generates the minimum number of ticks, but I won't use that approach just yet. However, you must remember this: it is in no way possible to recreate actual market movements through simulation. All we can do is estimate what the possible movements might be. But before we continue, we need to focus on fixing some specific problems. We'll start with a slightly more advanced topic, but it will serve as the basis for our simulator. But before we continue, we need to focus on solving some specific problems.
If there are no ticks, why is the service active?
Despite all the complexities that we will have to solve before moving towards anything closer to reality, we must solve individual problems that have been put off for a while and that really need to be solved. The first of these problems is that when we start the system without loading the preview bars, we cannot access the control indicator. This bug has been present in the system for some time, but since preview bars were always present before, I put off fixing it as needed by the system. Now let's solve this problem. To do this, we will have to make some minor additions at a very specific point in our system. We did this in order to simplify the task as much as possible, see below what we will do:
                bool SetSymbolReplay(const string szFileConfig)
                        {
#define macroERROR(MSG) { FileClose(file); MessageBox((MSG != "" ? MSG : StringFormat("Error occurred in line %d", iLine)), "Market Replay", MB_OK); return false; }
                                int     file,
                                        iLine;
                                string  szInfo;
                                char    iStage;
                                bool    bBarPrev;
                                MqlRates rate[1];

                                if ((file = FileOpen("Market Replay\\" + szFileConfig, FILE_CSV | FILE_READ | FILE_ANSI)) == INVALID_HANDLE)
                                {
                                        MessageBox("Failed to open the\nconfiguration file.", "Market Replay", MB_OK);
                                        return false;
                                }
                                Print("Loading data for replay. Please wait....");
                                ArrayResize(m_Ticks.Rate, def_BarsDiary);
                                m_Ticks.nRate = -1;
                                m_Ticks.Rate[0].time = 0;
                                iStage = 0;
                                iLine = 1;
                                bBarPrev = false;
                                while ((!FileIsEnding(file)) && (!_StopFlag))
                                {
                                        switch (GetDefinition(FileReadString(file), szInfo))
                                        {
                                                case Transcription_DEFINE:
                                                        if (szInfo == def_STR_FilesBar) iStage = 1; else
                                                        if (szInfo == def_STR_FilesTicks) iStage = 2; else
                                                        if (szInfo == def_STR_TicksToBars) iStage = 3; else
                                                        if (szInfo == def_STR_BarsToTicks) iStage = 4; else
                                                        if (szInfo == def_STR_ConfigSymbol) iStage = 5; else
                                                                macroERROR(StringFormat("%s is not recognized in the system\nin line %d.", szInfo, iLine));
                                                        break;
                                                case Transcription_INFO:
                                                        if (szInfo != "") switch (iStage)
                                                        {
                                                                case 0:
                                                                        macroERROR(StringFormat("Couldn't recognize command in line %d\nof configuration file.", iLine));
                                                                        break;
                                                                case 1:
                                                                        if (!LoadPrevBars(szInfo)) macroERROR("");
                                                                        bBarPrev = true;
                                                                        break;
                                                                case 2:
                                                                        if (!LoadTicksReplay(szInfo)) macroERROR("");
                                                                        break;
                                                                case 3:
                                                                        if (!LoadTicksReplay(szInfo, false)) macroERROR("");
                                                                        bBarPrev = true;
                                                                        break;
                                                                case 4:
                                                                        if (!LoadBarsToTicksReplay(szInfo)) macroERROR("");
                                                                        break;
                                                                case 5:
                                                                        if (!Configs(szInfo)) macroERROR("");
                                                                        break;
                                                        }
                                                        break;
                                        };
                                        iLine++;
                                }
                                FileClose(file);
                                if (m_Ticks.nTicks <= 0)
                                {
                                        MessageBox("No ticks to be used.\nClose the service...", "Market Replay", MB_OK);
                                        return false;
                                }
                                if (!bBarPrev)
                                {
                                        rate[0].close = rate[0].open =  rate[0].high = rate[0].low = m_Ticks.Info[0].last;
                                        rate[0].tick_volume = 0;
                                        rate[0].real_volume = 0;
                                        rate[0].time = m_Ticks.Info[0].time - 60;
                                        CustomRatesUpdate(def_SymbolReplay, rate, 1);
                                }

                                return (!_StopFlag);
#undef macroERROR
                        }
First we will define two new variables for local use. We then initialize them to a false value indicating that we have no preview bars loaded. Now, if at any time any previous bar is loaded, this variable will indicate the true value. This way the system will know that we have the previous bars loaded, and thus we solve part of our first problem. But we still need to check if any file is loaded that generates the ticks used. If there is no tick, there is no point in starting the service. Therefore the service will be stopped. Now, if there are ticks, we check whether some type of previous bar was loaded. If this does not happen, we initialize an empty bar. Without this initialization, we will not be able to access the control indicator, even if the service is available for use.
However, by making the corrections mentioned above, everything will be resolved.
Implementing TICK VOLUME
The next thing on the list to be corrected is the system that indicates the volume of traded ticks. Many people like to have a volume indicator on the chart, and so far the only volume actually implemented is real volume. That is, volume by the number of executed contracts. However, it is just as important to have tick volume. Do you know what the difference is between the two? Look at the image below:
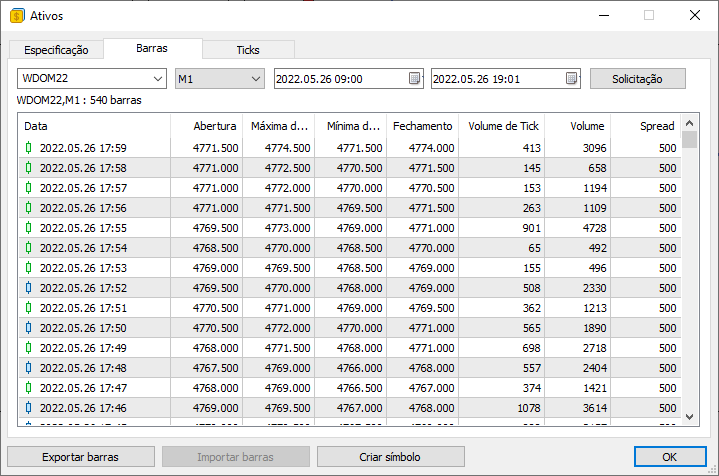
You can see two volume values in it. One is tick volume and the other is volume (in this case actual volume). But looking at this image, can you tell me the difference between real and tick volume? If you don't know the difference, now is the time to finally find out.
VOLUME or REAL VOLUME is essentially the number of contracts traded at a given point in time. It will always be a multiple of the value, which depends on the asset. For example, some assets do not allow trading with values less than 5, while others accept fractional values. Don't try to understand why this is possible, just know that you can trade fractional values. This value is easy to understand and may be why many people use it. Now if we take the value of the REAL VOLUME and multiply it by the minimum value of each contract, we get another value called FINANCIAL VOLUME. MetaTrader 5 does not directly provide this value, but as you have seen, it is easy to obtain. Thus, the trading server understands that it does not need to report this FINANCIAL VOLUME to trading terminals. Programmers or platform users must implement the specified calculation.
Now, the TICK VOLUME is a completely different volume. It is only provided in the bar contents for a simple reason: we cannot tell what happened during the trade just by looking at the actual volume. We need additional information - tick volume. But why is tick volume available when we query for bars and is not available when we query for ticks? What volume appears when we request ticks? If you've never noticed this (or haven't seen it yet), you can look at the image below:
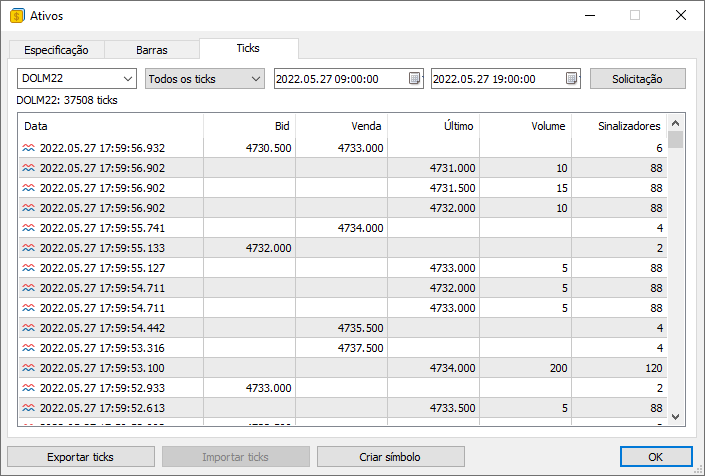
Again, values specified in the VOLUME field DO NOT represent tick volume. This value is the REAL VOLUME. However, how can we find out the tick volume if it is not reported when requesting ticks? It only appears when we query for bars. The point is that in the same way that the server understands that it does not need to provide FINANCIAL VOLUME, it also understands that by providing traded ticks we will be able to calculate TICK VOLUME. This is different from what would happen if we request bars when we do not have access to the actual ticks being traded.
Still don't understand? Having data on the ticks actually traded, we can calculate the tick volume. But how? Is there some kind of mysterious formula? Because every time I try I can't get the values to match. Calm down my dear reader. There is no magic formula. The point is that you probably don't quite understand what the TICK VOLUME really is. In this and previous articles, we used the method of modeling movement inside a minute bar. Although this move causes all prices to be affected, the actual tick volume we create is much less than the tick volume reported on the 1 minute bar.
But why? Do not worry. You will understand this better in the next article, where we will actually model the same tick volume. Having mentioned this, I think you understand what tick volume is. Tick volume is the number of trades that actually occurred within a given bar. Our average volume is about 150. In fact, the average is often around 12,890.
However, you might be thinking: How can I then calculate this tick volume? It's very easy to do. Let's see if our system can perform this calculation. Because to understand this, you really need to see the calculations in action.
Currently, this calculation is made in two places for different reasons. The first place is shown below:
inline bool BuiderBar1Min(MqlRates &rate, const MqlTick &tick)
                        {
                                if (rate.time != macroRemoveSec(tick.time))
                                {
                                        rate.real_volume = 0;
                                        rate.tick_volume = 0;
                                        rate.time = macroRemoveSec(tick.time);
                                        rate.open = rate.low = rate.high = rate.close = tick.last;

                                        return true;
                                }
                                rate.close = tick.last;
                                rate.high = (rate.close > rate.high ? rate.close : rate.high);
                                rate.low = (rate.close < rate.low ? rate.close : rate.low);
                                rate.real_volume += (long) tick.volume_real;
                                rate.tick_volume += (tick.last > 0 ? 1 : 0);

                                return false;
                        }
At this stage, we calculate the volume of ticks that will be present in the bar. The second point is below:
inline int Event_OnTime(void)
                        {
                                bool    bNew;
                                int     mili, iPos;
                                u_Interprocess Info;
                                static MqlRates Rate[1];
                                static datetime _dt = 0;
                                datetime tmpDT = macroRemoveSec(m_Ticks.Info[m_ReplayCount].time);

                                if (m_ReplayCount >= m_Ticks.nTicks) return -1;
                                if (bNew = (_dt != tmpDT))
                                {
                                        _dt = tmpDT;
                                        Rate[0].real_volume = 0;
                                        Rate[0].tick_volume = 0;
                                }
                                mili = (int) m_Ticks.Info[m_ReplayCount].time_msc;
                                do
                                {
                                        while (mili == m_Ticks.Info[m_ReplayCount].time_msc)
                                        {
                                                Rate[0].close = m_Ticks.Info[m_ReplayCount].last;
                                                Rate[0].open = (bNew ? Rate[0].close : Rate[0].open);
                                                Rate[0].high = (bNew || (Rate[0].close > Rate[0].high) ? Rate[0].close : Rate[0].high);
                                                Rate[0].low = (bNew || (Rate[0].close < Rate[0].low) ? Rate[0].close : Rate[0].low);
                                                Rate[0].real_volume += (long) m_Ticks.Info[m_ReplayCount].volume_real;
                                                Rate[0].tick_volume += (m_Ticks.Info[m_ReplayCount].volume_real > 0 ? 1 : 0);
                                                bNew = false;
                                                m_ReplayCount++;
                                        }
                                        mili++;
                                }while (mili == m_Ticks.Info[m_ReplayCount].time_msc);
                                Rate[0].time = _dt;
                                CustomRatesUpdate(def_SymbolReplay, Rate, 1);
                                iPos = (int)((m_ReplayCount * def_MaxPosSlider) / m_Ticks.nTicks);
                                GlobalVariableGet(def_GlobalVariableReplay, Info.u_Value.df_Value);
                                if (Info.s_Infos.iPosShift != iPos)
                                {
                                        Info.s_Infos.iPosShift = (ushort) iPos;
                                        GlobalVariableSet(def_GlobalVariableReplay, Info.u_Value.df_Value);
                                }
                                return (int)(m_Ticks.Info[m_ReplayCount].time_msc < mili ? m_Ticks.Info[m_ReplayCount].time_msc + (1000 - mili) : m_Ticks.Info[m_ReplayCount].time_msc - mili);
                        }
At this stage we do the same, that is, we calculate the tick volume. It it really true? Yes, that's right. Tick volume is calculated by actually including only the ticks that indicate executed trades. That is, one tick per operation. This means that the ticks that have BID or ASK flags active, do not participate in the calculation, and only those that have a SELL or BUY flag will be calculated. But since these flags will only be active when the price value or actual volume is greater than zero, we do not check the flags, because this is not necessary.
So from now on the replay/simulation system will feature the tick volume. But there is one detail: Now, when using a bar to simulate ticks, the volume will always differ from what is specified in the bars file. We will fix this in the next article. This needs a separate article so that I can calmly explain what we will have to do.
Setting a reference point
The next problem that needs to be fixed (although it's not really a problem) is getting the system to know what each position unit represents. The problem is that until now this system has used a very inappropriate way of performing user-specified positioning. Then, when it becomes possible to use more than one file to obtain tick data, the situation will become completely unacceptable for the previous system. Thus we have problems converting between what is placed in the control indicator and what is produced by replay.
To solve this problem, you will need to remove a certain line in the loading system.
                bool LoadTicksReplay(const string szFileNameCSV, const bool ToReplay = true)
                        {
                                int     file,
                                        old,
                                        MemNRates,
                                        MemNTicks;
                                string  szInfo = "";
                                MqlTick tick;
                                MqlRates rate,
                                        RatesLocal[];

                                MemNRates = (m_Ticks.nRate < 0 ? 0 : m_Ticks.nRate);
                                MemNTicks = m_Ticks.nTicks;
                                if ((file = FileOpen("Market Replay\\Ticks\\" + szFileNameCSV + ".csv", FILE_CSV | FILE_READ | FILE_ANSI)) != INVALID_HANDLE)
                                {
                                        ArrayResize(m_Ticks.Info, def_MaxSizeArray, def_MaxSizeArray);
                                        ArrayResize(m_Ticks.Rate, def_BarsDiary, def_BarsDiary);
                                        old = m_Ticks.nTicks;
                                        for (int c0 = 0; c0 < 7; c0++) szInfo += FileReadString(file);
                                        if (szInfo != def_Header_Ticks)
                                        {
                                                Print("File ", szFileNameCSV, ".csv is not a traded tick file.");
                                                return false;
                                        }
                                        Print("Loading data for replay. Please wait...");
                                        while ((!FileIsEnding(file)) && (m_Ticks.nTicks < (INT_MAX - 2)) && (!_StopFlag))
                                        {
                                                ArrayResize(m_Ticks.Info, (m_Ticks.nTicks + 1), def_MaxSizeArray);
                                                szInfo = FileReadString(file) + " " + FileReadString(file);
                                                tick.time = StringToTime(StringSubstr(szInfo, 0, 19));
                                                tick.time_msc = (int)StringToInteger(StringSubstr(szInfo, 20, 3));
                                                tick.bid = StringToDouble(FileReadString(file));
                                                tick.ask = StringToDouble(FileReadString(file));
                                                tick.last = StringToDouble(FileReadString(file));
                                                tick.volume_real = StringToDouble(FileReadString(file));
                                                tick.flags = (uchar)StringToInteger(FileReadString(file));
                                                if ((m_Ticks.Info[old].last == tick.last) && (m_Ticks.Info[old].time == tick.time) && (m_Ticks.Info[old].time_msc == tick.time_msc))
                                                        m_Ticks.Info[old].volume_real += tick.volume_real;
                                                else
                                                {
                                                        m_Ticks.Info[m_Ticks.nTicks] = tick;
                                                        if (tick.volume_real > 0.0)
                                                        {
                                                                m_Ticks.nRate += (BuiderBar1Min(rate, tick) ? 1 : 0);
                                                                rate.spread = (ToReplay ? m_Ticks.nTicks : 0);
                                                                m_Ticks.Rate[m_Ticks.nRate] = rate;
                                                                m_Ticks.nTicks++;
                                                        }
                                                        old = (m_Ticks.nTicks > 0 ? m_Ticks.nTicks - 1 : old);
                                                }
                                        }
                                        if ((!FileIsEnding(file)) && (!_StopFlag))
                                        {
                                                Print("Too much data in the tick file.\nCannot continue...");
                                                FileClose(file);
                                                return false;
                                        }
                                        FileClose(file);
                                }else
                                {
                                        Print("Tick file ", szFileNameCSV,".csv not found...");
                                        return false;
                                }
                                if ((!ToReplay) && (!_StopFlag))
                                {
                                        ArrayResize(RatesLocal, (m_Ticks.nRate - MemNRates));
                                        ArrayCopy(RatesLocal, m_Ticks.Rate, 0, 0);
                                        CustomRatesUpdate(def_SymbolReplay, RatesLocal, (m_Ticks.nRate - MemNRates));
                                        m_dtPrevLoading = m_Ticks.Rate[m_Ticks.nRate].time;
                                        m_Ticks.nRate = (MemNRates == 0 ? -1 : MemNRates);
                                        m_Ticks.nTicks = MemNTicks;
                                        ArrayFree(RatesLocal);
                                }
                                return (!_StopFlag);
                        };
Throwing this exception will free the 'spread' variable, which can be adjusted accordingly another time. We will not do this in this article, since there is no such need for it yet. But once this is done, we will have to fix the system responsible for the transformation. Because from now on the position control system will always indicate an invalid point. To be more precise, it will be the point different from what the user wants.
To perform the conversion correctly, we will need to change a very specific procedure. Here it is:
                long AdjustPositionReplay(const bool bViewBuider)
                        {
                                u_Interprocess  Info;
                                MqlRates        Rate[def_BarsDiary];
                                int             iPos,
                                                nCount;

                                Info.u_Value.df_Value = GlobalVariableGet(def_GlobalVariableReplay);
                                if (Info.s_Infos.iPosShift == (int)((m_ReplayCount * def_MaxPosSlider * 1.0) / m_Ticks.nTicks)) return 0;
                                iPos = (int)(m_Ticks.nTicks * ((Info.s_Infos.iPosShift * 1.0) / (def_MaxPosSlider + 1)));
                                Rate[0].time = macroRemoveSec(m_Ticks.Info[iPos].time);
                                if (iPos < m_ReplayCount)
                                {
                                        CustomRatesDelete(def_SymbolReplay, Rate[0].time, LONG_MAX);
                                        if ((m_dtPrevLoading == 0) && (iPos == 0))
                                        {
                                                m_ReplayCount = 0;
                                                Rate[m_ReplayCount].close = Rate[m_ReplayCount].open = Rate[m_ReplayCount].high = Rate[m_ReplayCount].low = m_Ticks.Info[iPos].last;
                                                Rate[m_ReplayCount].tick_volume = Rate[m_ReplayCount].real_volume = 0;
                                                CustomRatesUpdate(def_SymbolReplay, Rate, 1);
                                        }else
                                        {
                                                for(Rate[0].time -= 60; (m_ReplayCount > 0) && (Rate[0].time <= macroRemoveSec(m_Ticks.Info[m_ReplayCount].time)); m_ReplayCount--);
                                                m_ReplayCount++;
                                        }
                                }else if (iPos > m_ReplayCount)
                                {
                                        if (bViewBuider)
                                        {
                                                Info.s_Infos.isWait = true;
                                                GlobalVariableSet(def_GlobalVariableReplay, Info.u_Value.df_Value);
                                        }else
                                        {
                                                for(; Rate[0].time > m_Ticks.Info[m_ReplayCount].time; m_ReplayCount++);
                                                for (nCount = 0; m_Ticks.Rate[nCount].time < macroRemoveSec(m_Ticks.Info[iPos].time); nCount++);
                                                CustomRatesUpdate(def_SymbolReplay, m_Ticks.Rate, nCount);
                                        }
                                }
                                for (iPos = (iPos > 0 ? iPos - 1 : 0); (m_ReplayCount < iPos) && (!_StopFlag);) Event_OnTime();
                                Info.u_Value.df_Value = GlobalVariableGet(def_GlobalVariableReplay);
                                Info.s_Infos.isWait = false;
                                GlobalVariableSet(def_GlobalVariableReplay, Info.u_Value.df_Value);

                                return Event_OnTime();
                        }
The conversion presented above is very different from the versions shown in previous articles. This is because it actually converts user-configured percentage values into a control indicator and positioning system, so it doesn't matter how the tickets are organized. This procedure will search for the correct point and begin presenting the data found in ticks from that point.
To do this correctly, we will first perform a calculation to determine where the desired location is in percentage terms. This position is very important. If the value is lower, it means that we must go back to some point. We then remove information until we get closer to that point. Usually some additional data is always removed, but this is part of the process and we will return this data later. We may indeed be going back to the beginning of the data series. But if it's not, we'll reset the counter back to a point close to the percentage value. This particular line fixes the problem of always going back further than we actually wanted. Without it, the preview bar will be incorrect. The backward system is more complicated that the forward one. For the forward one, we simply check whether the user wants to see the bars being created or not. They will be displayed if desired; otherwise, the system will jump to the point indicated by the percentage value. In most cases we will need to make fine adjustments between the percentage value and the actual position. However, things will be done very quickly: if the real value is actually close to the percentage value, the transition will be practically instantaneous. But if the value is at a distance, a small animation will appear to show how the bars are being built.
Final thoughts on this article
Even though the system seems much more user-friendly, you may notice some strange things when running it in bar construction display mode. These unusual things can be seen in the video below. However, since they would require changes to some places in the code, and I didn't want you to think that these things were coming out of nowhere, I decided to leave the "bug". But perhaps the main reason is that in the next article I will show how to make the system more suitable as a simulator. I would not want anyone to come questioning me why I have programmed the simulator as will be shown in the next article.
Now watch the video. Please know that I am aware of what is happening.
The files used here can be found in the attachment. You will also have an additional file that shows both 1-minute bars and ticks traded for the same day. Run both configurations and check the results, but first you need to understand what is happening on the chart.
Translated from Portuguese by MetaQuotes Ltd.
Original article: https://www.mql5.com/pt/articles/10987
Warning: All rights to these materials are reserved by MetaQuotes Ltd. Copying or reprinting of these materials in whole or in part is prohibited.
This article was written by a user of the site and reflects their personal views. MetaQuotes Ltd is not responsible for the accuracy of the information presented, nor for any consequences resulting from the use of the solutions, strategies or recommendations described.

 Developing a Replay System — Market simulation (Part 10): Using only real data for Replay
- Free trading apps
- Over 8,000 signals for copying
- Economic news for exploring financial markets
You agree to website policy and terms of use