
Graphical Control of External Parameters of Indicators
Introduction
How often do you have to set or change external parameters of indicators? Many of you must have once thought of moving them to the chart to be able to conveniently drag an icon or an object to the required position using the mouse, thus simplifying the indicator setup procedure. The MQL4 language allows for display of indicator settings on the screen.
Graphical Control of Parameters
First of all, we need to find out what parameters there are in our indicator and which of them we are going to change. To do this, open the indicator properties and write down the names of parameters that will need to be changed in the course of work.
As an example, we use the ZigZag indicator included in the standard terminal delivery. Select the names of the variables in the properties.
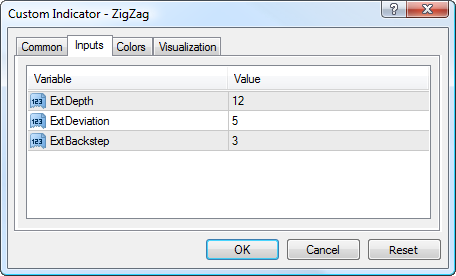
Indicator Parameters
- ExtDepth=12
- ExtDeviation=5
- ExtBackstep=3
We further create variables and arrays that will be used to change indicator parameter values.
Names of the indicator parameters will be given in accordance with the parameters of the indicator which we are going to control.
// Initial indicator values
int               ExtDepth=12;
int               ExtDeviation=5;
int               ExtBackstep=3;
//---- indicator buffers
double            ZigzagBuffer[];
double            HighMapBuffer[];
double            LowMapBuffer[];
// Array of indicator parameter variables
string            ArrExt[3,3]    ={"12","21","34", "5","8","21", "3","13","34"};
// Arrays of indices
string            Array_Index[]={"Dep -> ","Dev -> ","Back ->"};
int               Coordinats_IndexUp[]={65,160,260};
int               Coordinats_Index[]  ={35,130,230};
int               Coordinats_IndexDn[]={5, 100,200};
// Color for parameter blocks and indices
color             Color_[]={Blue,Green,Red};
I believe, everything is clear at this stage.
"Dep -> ","Dev -> ","Back ->"
are ExtDepth, ExtDeviation and ExtBackstep, respectively. This is how they will be displayed in the chart.
For each of the parameters, we use three variable values
string            ArrExtDepth[]    ={"12","15","20"};
string            ArrExtDeviation[]={"5",  "8","21"};
string            ArrExtBackstep[] ={"3", "13","34"};
stored in a three-dimensional array for convenience:
string ArrExt[3,3] ={"12","21","34", "5","8","21", "3","13","34"};
3, 5, 12 are standard values set by default in the parameters of the standard ZigZag indicator.
Other values are given here as an example. They will be used as parameter variables for indicator control.
Considering that there will be a lot of plotting involved, we put a function for creating and moving objects into a separate block:
void Obj_CreateMove_Text (int CreateMove, string Name, int Type, string Number,  color text_color,
                          int DistX, int DistY)
   {
      if (CreateMove==0)
      ObjectCreate(Name,Type,0,0,0);
      ObjectSetText(Name,Number,10,"Arial",text_color);
      ObjectSet(Name,101,3);
      ObjectSet(Name, 102, DistX);
      ObjectSet(Name, 103, DistY);
   }
To ensure ease of control and in order to keep the code compact, all coordinates of the graphical objects are stored in arrays. This has already been demonstrated above (see the beginning of the article).
Let's now plot all the objects in the chart window.
The right hand side of our chart is less loaded with information so the variables will be arranged vertically along the right border of the window. Each parameter has its own index whose color will be the same as the color of corresponding parameter variables.
Thus, we need to create three parameter indices and three variable values for each of the parameters.
Create objects for the indicator parameters on the screen, display numerical values of variables for these parameters and create the corresponding indices next to each parameter block.
// Create objects
   for( ii=0;ii<3;ii++)
      for( i=0;i<3;i++)
      Obj_CreateMove_Text (0, Array_Index[ii]+i, 23, (ArrExt[ii,i]), Color_[ii], 5, Coordinats_IndexDn[ii]+30*i);
      for( i=0;i<3;i++)
      Obj_CreateMove_Text (0, "Index"+Array_Index[i], 23, (Array_Index[i]),   Color_[i], 25, Coordinats_Index[i]);

Figure 1
Now we only need to create a block for handling user actions when the relevant index is moved.
We have anchor points of the objects on the chart according to which we read the index parameters one by one and determine the program logic.
// Read index coordinates from the chart
      for( i=0;i<3;i++)
           {
            Coordinats[i]=ObjectGet("Index"+Array_Index[i],OBJPROP_YDISTANCE);
               if (Coordinats[i]==0)//If outside of the chart, set again
                  Obj_CreateMove_Text (1, "Index"+Array_Index[i], 23, Array_Index[i], Color_[i], 25, Coordinats_IndexDn[i]);
           }
Now that the obtained values have been saved, we need to analyze their positions on the chart and do the necessary. For the analysis, we use the actual positions of indices, taking as a reference point three base values of each of the indices relative to the values of the parameters used. If the index is moved above the highest value in its group, it will be deemed to have been moved up to its highest value. If the index is moved below the lowest parameter value, it will similarly be moved to the lowest parameter value. If the index is between the highest and lowest values of the parameter, it takes the middle value. For comparison purposes, we use a vertical scale, i.e.
the OBJPROP_YDISTANCE parameter
from
ObjectGet()
// Analyze positions of indices
      for( i=0;i<3;i++)
         {
            if (Coordinats[i]>Coordinats_IndexUp[i])
                  {Move[i] = Coordinats_IndexUp[i]; index[i]=2;}// Index has been moved up
            if (Coordinats[i]>Coordinats_IndexDn[i]  &&
                Coordinats[i]<Coordinats_IndexUp[i])
                  {Move[i] = Coordinats_Index[i];   index[i]=1;}// Index is in the middle
            if (Coordinats[i]<Coordinats_IndexDn[i])
                  {Move[i] = Coordinats_IndexDn[i]; index[i]=0;}// Index has been moved down
            if (Move[i]!=0)
Then we align the objects that have been moved.
Save the new parameter values for plotting ZigZag.
Plot the indicator based on the values set using the graphical control.
// Move and align the objects depending on their positions
            Obj_CreateMove_Text (1, "Index"+Array_Index[i], 23, Array_Index[i], Color_[i], 25, Move[i]);
// Save ZigZag parameter values
            switch (i)
               {
                case 0:  ExtDepth =     StrToInteger(ArrExt[0,index[i]]);  break;
                case 1:  ExtDeviation = StrToInteger(ArrExt[1,index[i]]);  break;
                case 2:  ExtBackstep =  StrToInteger(ArrExt[2,index[i]]);  break;
               }/**/
          }
 // Pass parameter values to the custom indicator and plot ZigZag based on the obtained values
     for(i=300;i>0;i--)
            {
               ZigzagBuffer[i]=iCustom(NULL,0,"ZigZag",ExtDepth,ExtDeviation,ExtBackstep,0,i);
               HighMapBuffer[i]=iCustom(NULL,0,"ZigZag",ExtDepth,ExtDeviation,ExtBackstep,1,i);
               LowMapBuffer[i]=iCustom(NULL,0,"ZigZag",ExtDepth,ExtDeviation,ExtBackstep,2,i);
            }
Double-click on any graphical object to activate it. When activated, the object can be controlled using the mouse. This needs to be done every time you decide to change the parameter value.

Figure 2
Figure 3
Figure 4
The final version of the code will be as follows.
//+------------------------------------------------------------------+
//|                                         management_indicator.mq4 |
//|                                  Copyright © 2009, WWW.FIBOOK.RU |
//|                                             http://www.fibook.ru |
//+------------------------------------------------------------------+
#property copyright "Copyright © 2009, WWW.FIBOOK.RU"
#property link      "http://www.fibook.ru"

#property indicator_chart_window
#property indicator_buffers 1
#property indicator_color1 Red
// Initial indicator values
int               ExtDepth=12;
int               ExtDeviation=5;
int               ExtBackstep=3;
//---- indicator buffers
double            ZigzagBuffer[];
double            HighMapBuffer[];
double            LowMapBuffer[];
// Array of indicator parameter variables
string            ArrExt[3,3]    ={"12","21","34", "5","8","21", "3","13","34"};
// Arrays of indices
string            Array_Index[]={"Dep -> ","Dev -> ","Back ->"};
int               Coordinats_IndexUp[]={65,160,260};
int               Coordinats_Index[]  ={35,130,230};
int               Coordinats_IndexDn[]={5, 100,200};
// Color for parameter blocks and indices
color             Color_[]={Blue,Green,Red};
// Variables for calculations
int               i,ii;
int               index[3];
//+------------------------------------------------------------------+
//| Custom indicator initialization function                         |
//+------------------------------------------------------------------+
int init()
  {
//---- indicators
   IndicatorBuffers(3);
//---- drawing settings
   SetIndexStyle(0,DRAW_SECTION);
//---- indicator buffers mapping
   SetIndexBuffer(0,ZigzagBuffer);
   SetIndexBuffer(1,HighMapBuffer);
   SetIndexBuffer(2,LowMapBuffer);
   SetIndexEmptyValue(0,0.0);
//----
   return(0);
  }
//+------------------------------------------------------------------+
//| Custom indicator deinitialization function                       |
//+------------------------------------------------------------------+
int deinit()
  {
//----

//----
   return(0);
  }
//+------------------------------------------------------------------+
//| Custom indicator iteration function                              |
//+------------------------------------------------------------------+
int start()
  {
int  Coordinats[3];
int  Move[3];
// Check if index objects are on the chart
   if (ObjectGet("IndexDep -> ",OBJPROP_YDISTANCE)<1||
       ObjectGet("IndexDev -> ",OBJPROP_YDISTANCE)<1||
       ObjectGet("IndexBack ->",OBJPROP_YDISTANCE)<1)
// If they are not on the chart, create them
               {
      for( ii=0;ii<3;ii++)
       for( i=0;i<3;i++)
        Obj_CreateMove_Text (0, Array_Index[ii]+i, 23, ArrExt[ii,i], Color_[ii], 5, Coordinats_IndexDn[ii]+30*i);
       for( i=0;i<3;i++)
        Obj_CreateMove_Text (0, "Index"+Array_Index[i], 23, Array_Index[i], Color_[i], 25, Coordinats_IndexDn[i]);
               }
// Read index coordinates from the chart
      for( i=0;i<3;i++)
           {
            Coordinats[i]=ObjectGet("Index"+Array_Index[i],OBJPROP_YDISTANCE);
               if (Coordinats[i]==0)//If outside of the chart, set again
                  Obj_CreateMove_Text (1, "Index"+Array_Index[i], 23, Array_Index[i], Color_[i], 25, Coordinats_IndexDn[i]);
           }
// Analyze positions of indices
      for( i=0;i<3;i++)
         {
            if (Coordinats[i]>Coordinats_IndexUp[i])
                  {Move[i] = Coordinats_IndexUp[i]; index[i]=2;}//Index has been moved up
            if (Coordinats[i]>Coordinats_IndexDn[i]  &&
                Coordinats[i]<Coordinats_IndexUp[i])
                  {Move[i] = Coordinats_Index[i];   index[i]=1;}// Index is in the middle
            if (Coordinats[i]<Coordinats_IndexDn[i])
                  {Move[i] = Coordinats_IndexDn[i]; index[i]=0;}// Index has been moved down
            if (Move[i]!=0)
// Move and align the objects depending on their positions
            Obj_CreateMove_Text (1, "Index"+Array_Index[i], 23, Array_Index[i], Color_[i], 25, Move[i]);
// Save ZigZag parameter values
            switch (i)
               {
                case 0:  ExtDepth =     StrToInteger(ArrExt[0,index[i]]);  break;
                case 1:  ExtDeviation = StrToInteger(ArrExt[1,index[i]]);  break;
                case 2:  ExtBackstep =  StrToInteger(ArrExt[2,index[i]]);  break;
               }/**/
          }
 // Pass parameter values to the custom indicator and plot ZigZag based on the obtained values
     for(i=300;i>0;i--)
            {
               ZigzagBuffer[i]=iCustom(NULL,0,"ZigZag",ExtDepth,ExtDeviation,ExtBackstep,0,i);
               HighMapBuffer[i]=iCustom(NULL,0,"ZigZag",ExtDepth,ExtDeviation,ExtBackstep,1,i);
               LowMapBuffer[i]=iCustom(NULL,0,"ZigZag",ExtDepth,ExtDeviation,ExtBackstep,2,i);
            }
Comment ("ExtDepth =",ExtDepth,", ExtDeviation =",ExtDeviation,", ExtBackstep =",ExtBackstep);
//----
   return(0);
  }
// Function for creating and moving graphical objects
void Obj_CreateMove_Text (int CreateMove, string Name, int Type, string Number,  color text_color, int DistX, int DistY)
   {
      if (CreateMove==0)
      ObjectCreate(Name,Type,0,0,0);
      ObjectSetText(Name,Number,10,"Arial",text_color);
      ObjectSet(Name,101,3);
      ObjectSet(Name, 102, DistX);
      ObjectSet(Name, 103, DistY);
   }


//+------------------------------------------------------------------+
Conclusion
The approach described above can be implemented to control any indicator externally by displaying the parameters that need to be set.
Translated from Russian by MetaQuotes Ltd.
Original article: https://www.mql5.com/ru/articles/1370
Warning: All rights to these materials are reserved by MetaQuotes Ltd. Copying or reprinting of these materials in whole or in part is prohibited.
This article was written by a user of the site and reflects their personal views. MetaQuotes Ltd is not responsible for the accuracy of the information presented, nor for any consequences resulting from the use of the solutions, strategies or recommendations described.
 Alert and Comment for External Indicators. Multi-Currency Analysis Through External Scanning
 MQL5 Market Results for Q2 2013
- Free trading apps
- Over 8,000 signals for copying
- Economic news for exploring financial markets
You agree to website policy and terms of use