MQL4 and MQL5 Programming Articles
Study the MQL5 language for programming trading strategies in numerous published articles mostly written by you - the community members. The articles are grouped into categories to help you quicker find answers to any questions related to programming: Integration, Tester, Trading Strategies, etc.
Follow our new publications and discuss them on the Forum!
Add a new article

You are missing trading opportunities:
- Free trading apps
- Over 8,000 signals for copying
- Economic news for exploring financial markets
Registration
Log in
You agree to website policy and terms of use
If you do not have an account, please register


Risk Evaluation in the Sequence of Deals with One Asset
This article describes the use of methods of the theory of probability and mathematical statistics in the analysis of trading systems.

Price Action Analysis Toolkit Development (Part 44): Building a VWMA Crossover Signal EA in MQL5
This article introduces a VWMA crossover signal tool for MetaTrader 5, designed to help traders identify potential bullish and bearish reversals by combining price action with trading volume. The EA generates clear buy and sell signals directly on the chart, features an informative panel, and allows for full user customization, making it a practical addition to your trading strategy.

How to Add New UI Languages to the MetaTrader 5 Platform
User interface of the MetaTrader 5 platform is translated into several languages. Don't worry if your native language is not among the supported ones. You can easily complete the translation using the special MetaTrader 5 MultiLanguage Pack utility, offered by MetaQuotes Software Corp. for free to all comers. In this article we will show some examples of how to add a new user interface languages to the MetaTrader 5 platform.

Learn how to design a trading system by Parabolic SAR
In this article, we will continue our series about how to design a trading system using the most popular indicators. In this article, we will learn about the Parabolic SAR indicator in detail and how we can design a trading system to be used in MetaTrader 5 using some simple strategies.

Price Action Analysis Toolkit Development (Part 53): Pattern Density Heatmap for Support and Resistance Zone Discovery
This article introduces the Pattern Density Heatmap, a price‑action mapping tool that transforms repeated candlestick pattern detections into statistically significant support and resistance zones. Rather than treating each signal in isolation, the EA aggregates detections into fixed price bins, scores their density with optional recency weighting, and confirms levels against higher‑timeframe data. The resulting heatmap reveals where the market has historically reacted—levels that can be used proactively for trade timing, risk management, and strategy confidence across any trading style.

Improve Your Trading Charts With Interactive GUI's in MQL5 (Part III): Simple Movable Trading GUI
Join us in Part III of the "Improve Your Trading Charts With Interactive GUIs in MQL5" series as we explore the integration of interactive GUIs into movable trading dashboards in MQL5. This article builds on the foundations set in Parts I and II, guiding readers to transform static trading dashboards into dynamic, movable ones.

Horizontal diagrams on MеtaTrader 5 charts
Horizontal diagrams are not a common occurrence on the terminal charts but they can still be of use in a number of tasks, for example when developing indicators displaying volume or price distribution for a certain period, when creating various market depth versions, etc. The article considers constructing and managing horizontal diagrams as arrays of graphical primitives.

Testing Performance of Moving Averages Calculation in MQL5
A number of indicators have appeared since the time of first Moving Average indicator creation. Many of them use the similar smoothing methods, but the performances of different moving averages algorithms have not been studied. In this article, we will consider possible ways of use the Moving Averages in MQL5 and compare their performance.
MQL5 Cookbook: Developing a Multi-Currency Expert Advisor with Unlimited Number of Parameters
In this article, we will create a pattern that uses a single set of parameters for optimization of a trading system, while allowing for unlimited number of parameters. The list of symbols will be created in a standard text file (*.txt). Input parameters for each symbol will also be stored in files. This way we will be able to circumvent the restriction of the terminal on the number of input parameters of an Expert Advisor.

Building AI-Powered Trading Systems in MQL5 (Part 7): Further Modularization and Automated Trading
In this article, we enhance the AI-powered trading system's modularity by separating UI components into a dedicated include file. The system now automates trade execution based on AI-generated signals, parsing JSON responses for BUY/SELL/NONE with entry/SL/TP, visualizing patterns like engulfing or divergences on charts with arrows, lines, and labels, and optional auto-signal checks on new bars.

Combinatorics and probability theory for trading (Part III): The first mathematical model
A logical continuation of the earlier discussed topic would be the development of multifunctional mathematical models for trading tasks. In this article, I will describe the entire process related to the development of the first mathematical model describing fractals, from scratch. This model should become an important building block and be multifunctional and universal. It will build up our theoretical basis for further development of this idea.

Creating and Publishing of Trade Reports and SMS Notification
Traders don't always have ability and desire to seat at the trading terminal for hours. Especially, if trading system is more or less formalized and can automatically identify some of the market states. This article describes how to generate a report of trade results (using Expert Advisor, Indicator or Script) as HTML-file and upload it via FTP to WWW-server. We will also consider sending notification of trade events as SMS to mobile phone.
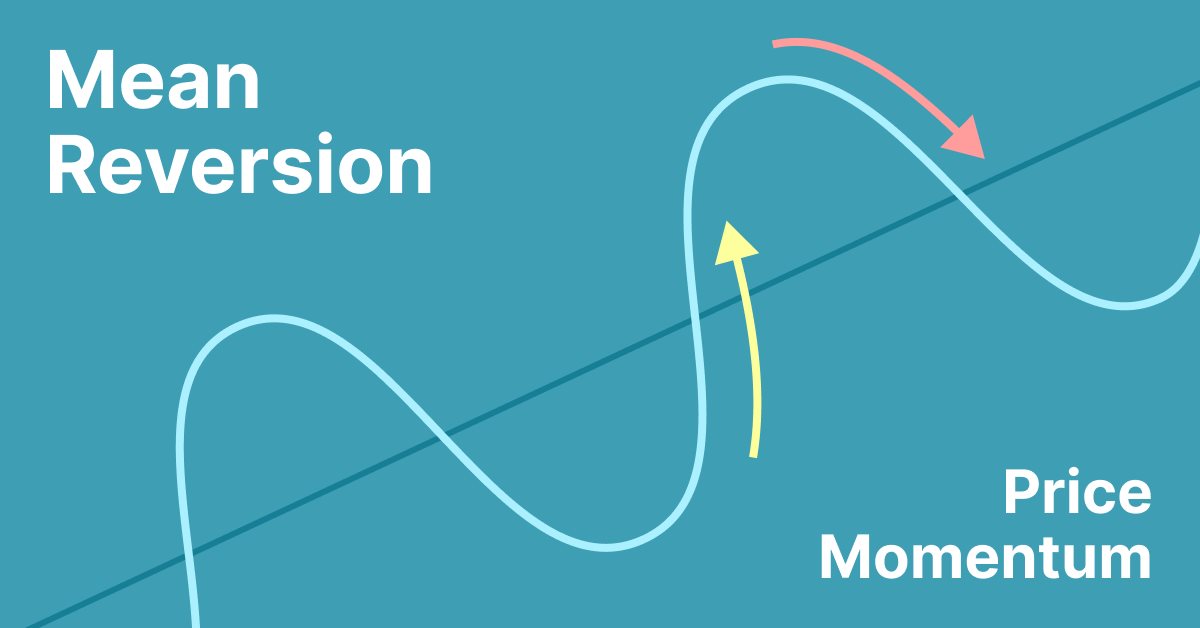
Simple Mean Reversion Trading Strategy
Mean reversion is a type of contrarian trading where the trader expects the price to return to some form of equilibrium which is generally measured by a mean or another central tendency statistic.

Cross-Platform Expert Advisor: Stops
This article discusses an implementation of stop levels in an expert advisor in order to make it compatible with the two platforms MetaTrader 4 and MetaTrader 5.

Indicator Alternative Ichimoku – Setup, Examples of Usage
How to set up Alternative Ichimoku correctly? Read the description of parameters setting up. The article will help you understand the methods of setting up parameters not only of the indicator Ichimoku. Certainly you will also better understand how to set up the standard Ichimoku Kinko Hyo.
Learn how to design a trading system by Relative Vigor Index
A new article in our series about how to design a trading system by the most popular technical indicator. In this article, we will learn how to do that by the Relative Vigor Index indicator.

How to create a simple Multi-Currency Expert Advisor using MQL5 (Part 1): Indicator Signals based on ADX in combination with Parabolic SAR
The Multi-Currency Expert Advisor in this article is Expert Advisor or trading robot that can trade (open orders, close orders and manage orders an more) for more than 1 symbol pair only from one symbol chart.

Neural networks made easy (Part 8): Attention mechanisms
In previous articles, we have already tested various options for organizing neural networks. We also considered convolutional networks borrowed from image processing algorithms. In this article, I suggest considering Attention Mechanisms, the appearance of which gave impetus to the development of language models.

Graphical Interfaces IX: The Progress Bar and Line Chart Controls (Chapter 2)
The second chapter of the part nine is dedicated to the progress bar and line chart controls. As always, there will be detailed examples provided to reveal how these controls can be used in custom MQL applications.

Graphical Interfaces II: The Main Menu Element (Chapter 4)
This is the final chapter of the second part of the series about graphical interfaces. Here, we are going to consider the creation of the main menu. The development of this control and setting up handlers of the library classes for correct reaction to the user's actions will be demonstrated here. We will also discuss how to attach context menus to the items of the main menu. Adding to that, we will mention blocking currently inactive elements.
Graphical Interfaces V: The Vertical and Horizontal Scrollbar (Chapter 1)
We are still discussing the development of the library for creating graphical interfaces in the MetaTrader environment. In the first article of the fifth part of the series, we will write classes for creating vertical and horizontal scrollbars.

Graphic Expert Advisor: AutoGraf
The article shows the workability of graphics in creation of a convenient interface to manage trading.

Price Forecasting Using Neural Networks
Many traders speak about neural networks, but what they are and what they really can is known to few people. This article sheds some light on the world of artificial intelligence. It describes, how to prepare correctly the data for the network. Here you will also find an example of forecasting using means of the program Matlab.

Building a Social Technology Startup, Part II: Programming an MQL5 REST Client
Let's now shape the PHP-based Twitter idea which was introduced in the first part of this article. We are assembling the different parts of the SDSS. Regarding the client side of the system architecture, we are relying on the new MQL5 WebRequest() function for sending trading signals via HTTP.

The market and the physics of its global patterns
In this article, I will try to test the assumption that any system with even a small understanding of the market can operate on a global scale. I will not invent any theories or patterns, but I will only use known facts, gradually translating these facts into the language of mathematical analysis.
Extending Strategy Builder Functionality
In the previous two articles, we discussed the application of Merrill patterns to various data types. An application was developed to test the presented ideas. In this article, we will continue working with the Strategy Builder, to improve its efficiency and to implement new features and capabilities.

Developing multi-module Expert Advisors
MQL programming language allows implementing the concept of modular development of trading strategies. The article shows an example of developing a multi-module Expert Advisor consisting of separately compiled file modules.

CCI indicator. Upgrade and new features
In this article, I will consider the possibility of upgrading the CCI indicator. Besides, I will present a modification of the indicator.

Installing MetaTrader 5 and Other MetaQuotes Apps on HarmonyOS NEXT
Easily install MetaTrader 5 and other MetaQuotes apps on HarmonyOS NEXT devices using DroiTong. A detailed step-by-step guide for your phone or laptop.

Developing an Expert Advisor (EA) based on the Consolidation Range Breakout strategy in MQL5
This article outlines the steps to create an Expert Advisor (EA) that capitalizes on price breakouts after consolidation periods. By identifying consolidation ranges and setting breakout levels, traders can automate their trading decisions based on this strategy. The Expert Advisor aims to provide clear entry and exit points while avoiding false breakouts

Mastering ONNX: The Game-Changer for MQL5 Traders
Dive into the world of ONNX, the powerful open-standard format for exchanging machine learning models. Discover how leveraging ONNX can revolutionize algorithmic trading in MQL5, allowing traders to seamlessly integrate cutting-edge AI models and elevate their strategies to new heights. Uncover the secrets to cross-platform compatibility and learn how to unlock the full potential of ONNX in your MQL5 trading endeavors. Elevate your trading game with this comprehensive guide to Mastering ONNX

The Liquidity Grab Trading Strategy
The liquidity grab trading strategy is a key component of Smart Money Concepts (SMC), which seeks to identify and exploit the actions of institutional players in the market. It involves targeting areas of high liquidity, such as support or resistance zones, where large orders can trigger price movements before the market resumes its trend. This article explains the concept of liquidity grab in detail and outlines the development process of the liquidity grab trading strategy Expert Advisor in MQL5.

Freelance Jobs on MQL5.com - Developer's Favorite Place
Developers of trading robots no longer need to market their services to traders that require Expert Advisors - as now they will find you. Already, thousands of traders place orders to MQL5 freelance developers, and pay for work in on MQL5.com. For 4 years, this service facilitated three thousand traders to pay for more than 10 000 jobs performed. And the activity of traders and developers is constantly growing!

Guide to writing a DLL for MQL5 in Delphi
The article examines the mechanism of creating a DLL module, using the popular programming language of ObjectPascal, within a Delphi programming environment. The materials, provided in this article, are designed to primarily target beginner programmers, who are working with problems, which breach the boundaries of the embedded programming language of MQL5, by connecting the outside DLL modules.
Testing patterns that arise when trading currency pair baskets. Part II
We continue testing the patterns and trying the methods described in the articles about trading currency pair baskets. Let's consider in practice, whether it is possible to use the patterns of the combined WPR graph crossing the moving average. If the answer is yes, we should consider the appropriate usage methods.

Developing a Trading Strategy: The Butterfly Oscillator Method
In this article, we demonstrated how the fascinating mathematical concept of the Butterfly Curve can be transformed into a practical trading tool. We constructed the Butterfly Oscillator and built a foundational trading strategy around it. The strategy effectively combines the oscillator's unique cyclical signals with traditional trend confirmation from moving averages, creating a systematic approach for identifying potential market entries.

How to Prepare MetaTrader 5 Quotes for Other Applications
The article describes the examples of creating directories, copying data, filing, working with the symbols in Market Watch or the common list, as well as the examples of handling errors, etc. All these elements can eventually be gathered in a single script for filing the data in a user-defined format.

Multilayer perceptron and backpropagation algorithm
The popularity of these two methods grows, so a lot of libraries have been developed in Matlab, R, Python, C++ and others, which receive a training set as input and automatically create an appropriate network for the problem. Let us try to understand how the basic neural network type works (including single-neuron perceptron and multilayer perceptron). We will consider an exciting algorithm which is responsible for network training - gradient descent and backpropagation. Existing complex models are often based on such simple network models.

Brute force approach to pattern search (Part IV): Minimal functionality
The article presents an improved brute force version, based on the goals set in the previous article. I will try to cover this topic as broadly as possible using Expert Advisors with settings obtained using this method. A new program version is attached to this article.