
Trader-friendly stop loss and take profit

Introduction
If the greatest playwright could write an epigraph to this article, he would perhaps put it this way:
To be or not to be? That is the question:
Whether place a stop loss against the frantic market,
Or use take profit to grab the spoils?
Stop loss and take profit are stop orders that close a position when the price reaches their value. Stop loss allows traders to limit losses, while take profit enables thjem to save their gains. The main advantage of using stop loss and take profit is the ability to control financial risks and use money management.
But some traders prefer to do without stop orders. Their reasoning is quite simple. There are situations when the price reaches the stop loss and then reverses. If there were no stop loss, the position could have closed in positive territory. The same argument applies to take profit. After reaching its level, the position is closed. But the price continues to move in the same direction, and if the take profit had not been set, additional profit could have been made.
This approach is more likely related to the trader’s subjective assessments. This subjectivity can lead to big problems. For example, if a trader does not set a stop loss, then the broker will do it for him. To avoid confusion in terms, the broker will call its level a "stop out". You can always find out the broker's stop loss level by using the AccountInfoDouble function with the ACCOUNT_MARGIN_SO_SO identifier. Same goes to take profit. Is it possible that the trader himself chose the wrong level and therefore was unable to get all the possible profit?
Let's try to approach the choice of stop loss and take profit levels rationally.
Preparing the data
So, let's get acquainted with the subject of our research. First we need to find out what levels the price can reach when moving up and down. Also, we are interested in how often a certain level occurs in history.
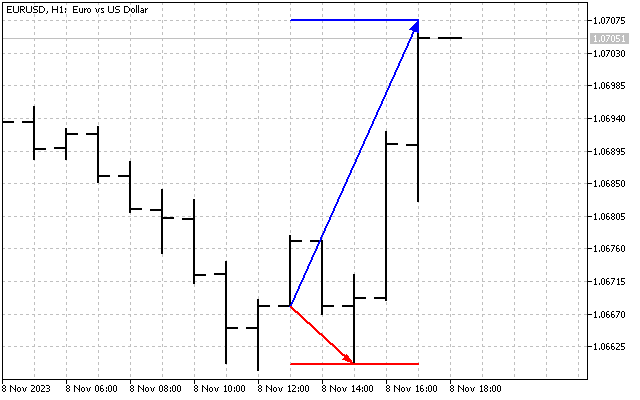
We will use a fairly simple model. Let's assume that each position is opened at the 'open' price. Also, determine the duration of holding the position in N bars We are interested in the maximum upward and downward price deviations. It is their values that we will collect for statistics. For example, I used the position holding time of 5 bars, and graphically it looks like this.
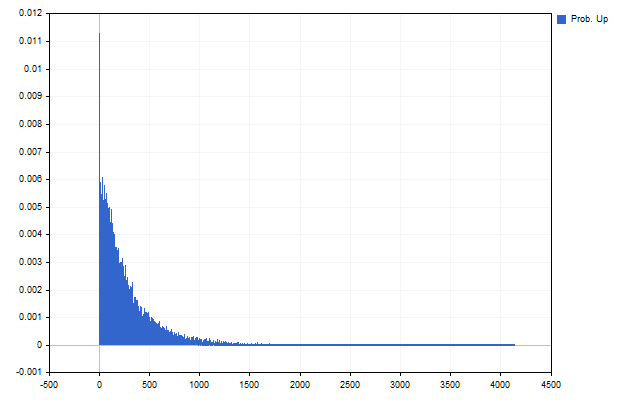
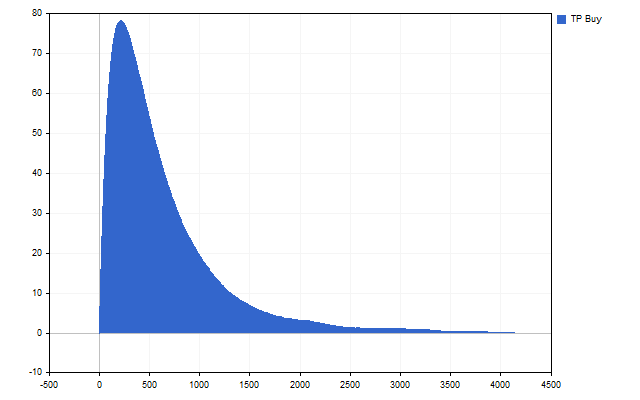
As a result, we will get the number of times a certain price deviation occurred on historical data. In other words, we will obtain an estimate of the probability that the price will reach a given level. For example, this is what statistics look like for upward price movement.
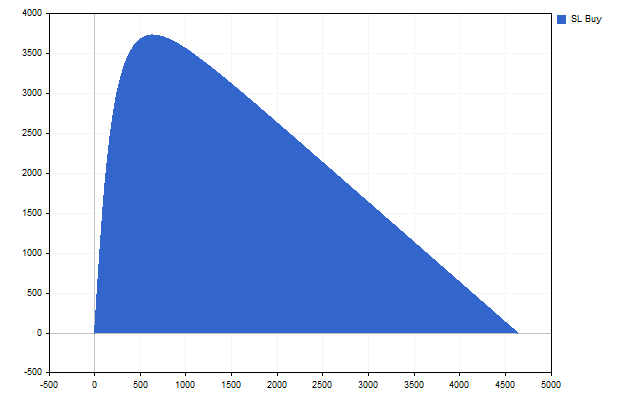
And here is the downward one.
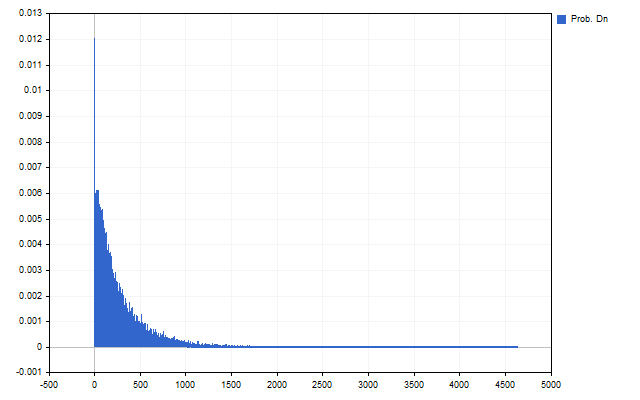
The first thing that catches our eye is large deviations - they are less common. The second important result is the difference between upward and downward price movements.
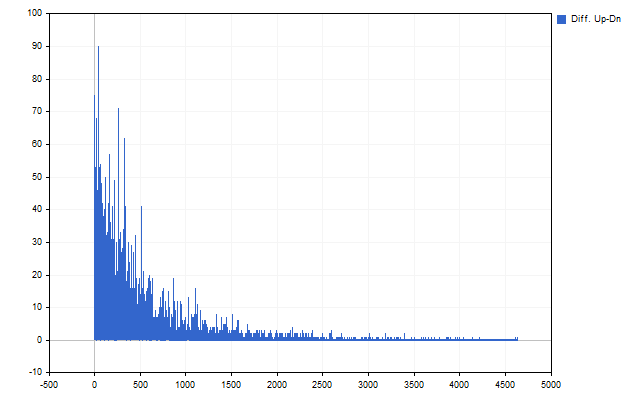
This difference indicates that the stop loss and take profit values for Buy and Sell positions may differ from each other.
Now we need to take one more step. The condition for triggering stop loss and take profit can be formulated as follows: the price will reach a given level and, perhaps, go further.
We will need additional cumulative functions to estimate the probability that a stop loss or take profit will be triggered at a given level. The essence of the additional cumulative function is very simple - we need to sum the probability of a given level with the probabilities of all levels following it.
In practice, we can find the function the following way. Let's take the probability estimate we got at the beginning. Starting from the penultimate level in terms of its value, we need to find sums of the form:
As a result, we should get a picture like this.
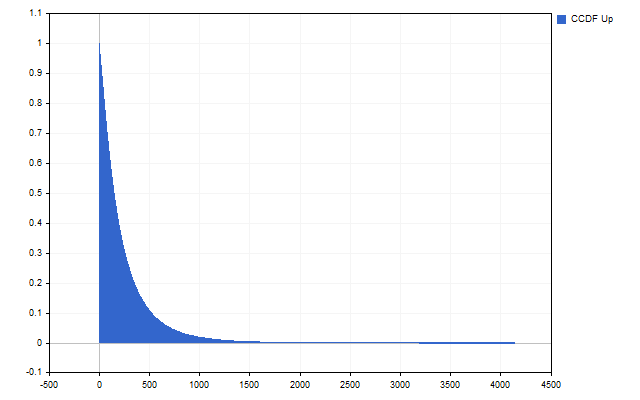
Let me remind you once again. First, we got the probability that the price will reach exactly this level. Now we have the probability that the price will reach this level and, possibly, go further.
Now we can start the main part of our research.
Independent SL & TP
So, we know the probability of the price reaching a certain level. Now we should monetize this knowledge. And we will start with... By the way, have you noticed that in all of its products MetaQuotes first suggests setting a stop loss followed by take profit? This is because only pessimists work there. We, on the other hand, are optimists, so we will start with take profit.
Any trader is interested in having a large take profit. The larger the take profit, the greater the profit. But, as we have already seen, an increase in take profit leads to a decrease in the probability of its execution. We need to find the maximum take profit with the highest possible execution probability:
Let's see if this condition can be met.
Indeed, we have a clearly defined maximum, and we can accept this take profit value as optimal.
Now we can start finding the optimal stop loss. At first glance, everything is quite simple - we need a minimum stop loss with a minimum probability of its execution. But this simplicity is deceptive. In fact, we will have to do the opposite.
When we collected statistics on price deviations, we also received the maximum value. Now, when assessing optimality, we can take the difference between this maximum and the stop loss value. The larger this difference, the better. We will do the same when assessing the probability of execution. A small probability of execution is equivalent to a high probability of non-execution. In other words, we are looking for the following condition to be met:
Let's check. Indded, such a maximum exists. The optimal stop loss has been found.
For EURUSD H1, position holding duration is 5 bars. I got the following values.
| SL / Probability | TP / Probability | |
|---|---|---|
| Buy | 622 / 6.90% | 210 / 37.28% |
| Sell | 603 / 7.28% | 220 / 35.31% |
Let's check how optimal these values are. I will use a simple strategy - positions are opened on each new bar if there are no open positions. The position type is selected randomly. We check three options:
- optimal stop orders;
- stop losses reduced by 10 points;
- take profits increased by 10 points.
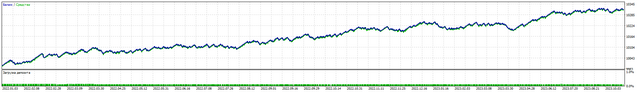
This is what the balance curve looks like when using optimal stop orders.
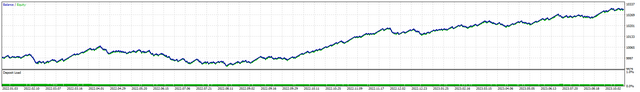
The test results for all options are presented in the table.
| Total Net Profit | Gross Profit | Gross Loss | Profit Factor | Expected Payoff |
|---|---|---|---|---|
| 303.02 | 1 870.84 | -1 567.82 | 1.19 | 0.27 |
| 100.79 | 1 817.04 | -1 716.25 | 1.06 | 0.09 |
| 135.07 | 1 773.24 | -1 638.17 | 1.08 | 0.13 |
Let's briefly consider the practical application of this approach.
First, we can use it 'as is' and implement it as an indicator. Then we will get unique support and resistance levels.
Second, let's assume that we have a trading strategy that generates signals to open and close positions. Then we can do the following. First, collect statistics for Buy and Sell signals separately. In this case, the position holding time is counted from the opening signal to the closing one.
Of course, we can use only take profit or only stop loss. They do not depend on each other, so their separate use is quite acceptable.
Expected payoff
The concept of expected payoff (or mathematical expectation) has been known for a long time and is widely used in trading. For example, the SMA indicator shows the price expected payoff. In the article "Mathematics in trading: How to estimate trade results" shows in detail how trading strategies can be evaluated using mathematical expectation.
Let's try to apply mathematical expectation to the calculation of stop orders. We already have all the necessary statistics. We just have to understand what and how we will count.
We can calculate the expected payoff for a position using the following equation:
where p is the probability that the position will be closed at take profit. This is the probability we need to find.
Any position will be closed either by take profit or stop loss. There are no other options. This means that the total probability for these two events must be equal to 1. The probability that a position will be closed at take profit consists of two components: the probability that the price will reach the take profit level and the probability that the price will not reach the stop loss level. Closing a position by a stop loss is estimated the same way. In this case, the expected payoff equation will look like this:
All we have to do is find the stop loss and take profit values such that the expected payoff is positive. For example, the maximum payoff can be achieved with the following stop order values.
| SL / Probability | TP / Probability | Expected value | |
|---|---|---|---|
| Buy | 4611 / 7.69% | 3690 / 92.31% | 3051.53 |
| Sell | 4071 / 14.29% | 3950 / 85.71% | 2804.19 |
In practice, the mathematical expectation can be used like this. First, we need to select a specific stop loss or take profit value. Then we need to find the optimal value of another stop order. For example, I took the stop loss values from the previous example and found take profits for them with the highest expected payoff. I got the following values:
| SL / Probability | TP / Probability | Expected value | |
|---|---|---|---|
| Buy | 622 / 19.24% | 310 / 80.76% | 130.68 |
| Sell | 603 / 19.25% | 300 / 80.75% | 126.13 |
This is what changing the balance looks like.
We can use other criteria in addition to the expected payoff. For example, the criterion
allows us to obtain stop order values providing the optimal ratio of average profit to average loss.
Time and profit
Everyone knows the aphorism "Time is money". Let's see if (and how) this aphorism works in trading.
Any rational trader is interested in making a profit. The greater the profit, the better. I offer you a choice of 3 trading strategies: the first brings 1440 points of profit, the second – 600, and the third – 20. Which strategy will you choose?
Here I will make a small clarification. The first strategy brings profit in a day, the second in an hour, and the third in a minute. Obviously, to assess the profitability of these strategies, we need to bring them to the same time interval. For example, M1. Then, we will get the following values:
- 1440/1440 = 1;
- 600/60 = 10;
- 20/1 = 20.
In other words, we used the following criterion to evaluate the strategies:
Let's try to apply the same approach to calculating stop orders. Obviously, traders are interested in getting the maximum profit in the least possible time. In the same way, they strive for minimal losses, and the time of these losses is pushed back as far as possible.
In terms of choosing stop orders, we can think like this. Let's say we expect to make a profit within 5 bars. Then we can move the stop loss to a longer time by execution time. For example, the stop loss execution time can be set to 7 or 10 bars. In this case, the size of the stop loss will increase, but the probability of its execution will decrease.
This approach can be used in strategies that have signals to open positions and no signal to close them. Positions should only be closed when the stop loss or take profit is reached.
For example, I took the take profit execution time equal to 5 bars. The stop loss execution time is 5, 10 and 15 bars. One of the options for changing the trading balance looks like this.
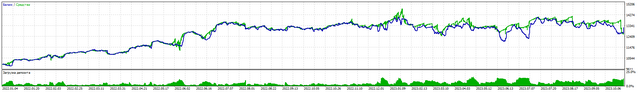
The main test results are shown in the table.
| Total Net Profit | Gross Profit | Gross Loss | Profit Factor | Expected Payoff |
|---|---|---|---|---|
| -1 462.31 | 45 593.97 | -47 056.28 | 0.97 | -0.13 |
| 3 177.61 | 59 307.98 | -56 130.37 | 1.06 | 0.28 |
| 1 833.58 | 59 963.97 | -58 130.39 | 1.03 | 0.16 |
As we can see, changing the stop loss execution time can have a positive effect on trading results.
Conclusion
The following programs were used when writing this article.
| Name | Type | Description |
|---|---|---|
| Lvl SL & TP | Script | The script allows calculating the optimal stop loss and take profit.
|
| EA SL&TP | EA | Allows checking stop loss and take profit levels.
|
| EA TIM | EA | Allows testing the hypothesis about different times for SL and TP.
|
Translated from Russian by MetaQuotes Ltd.
Original article: https://www.mql5.com/ru/articles/13737
Warning: All rights to these materials are reserved by MetaQuotes Ltd. Copying or reprinting of these materials in whole or in part is prohibited.
This article was written by a user of the site and reflects their personal views. MetaQuotes Ltd is not responsible for the accuracy of the information presented, nor for any consequences resulting from the use of the solutions, strategies or recommendations described.

- Free trading apps
- Over 8,000 signals for copying
- Economic news for exploring financial markets
You agree to website policy and terms of use
Check out the new article: Trader-friendly stop loss and take profit.
Author: Aleksej Poljakov
Check out the new article: Trader-friendly stop loss and take profit.
Author: Aleksej Poljakov
nice ! what do you think about local time! your data spans time but does not pinpoint >>>> location/geographic , make sense?
eg, are there certain timeszones we should do A,B,C and not D,E,F, ?
It would involve a multi-variant backtest with many permutations, but.. each market is very different.
nice ! what do you think about local time! your data spans time but does not pinpoint >>>> location/geographic , make sense?
eg, are there certain timeszones we should do A,B,C and not D,E,F, ?
It would involve a multi-variant backtest with many permutations, but.. each market is very different.
It is not only possible, but also necessary to do as you suggest.
For example, I decided to open positions at 1, 5, and 13 o'clock. And I want them to be closed until the end of the day. Then, for each time, I need to calculate my own separate SL and TP. I move on and want to take into account not only the time of day, but also the day of the week. Then I will need to calculate SL and TP for each day of the week and each hour separately.
Another example. I want support and resistance levels, but forward in time. Then, for each bar opening time, I will have my own SL and TP values.