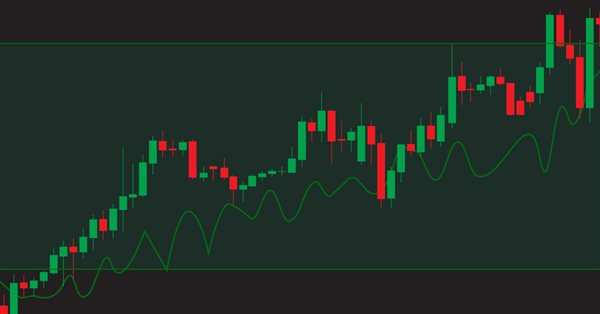
Learn how to design a trading system by OBV
Introduction
In this new article, we will learn about a new technical indicator that can deal with volume and help us to see a different perspective: we will talk about the On-Balance Volume (OBV) indicator in detail to try to cover this interesting topic and learn how to use this technical indicator in our favor. The following are topics that will cover this indicator:
Through the OBV definition topic, we will learn about the OBV indicator in detail: we will identify what it is, how it is measured, and how we can calculate, as well as see an example of its calculation. After that, we can identify and learn about this indicator deeply to know how we can use it correctly. We will learn how to use the OBV indicator by using simple strategies based on the concept of the indicator — this will be through the OBV strategy topic. After we identify how to use it based on simple strategies, we will design a blueprint for simple strategies which will help us to write the MQL5 code of these strategies as this blueprint will help us to arrange and organize our steps to create the Expert Advisor. After designing the strategy blueprint, we will be ready to write our code in MQL5 to create an Expert Advisor and use it in MetaTrader 5 to execute our trading strategies automatically and accurately with our manual actions.
I need to mention that we will use in this article MQL5 (MetaQuotes Language) to write and create our Expert Advisors. Then we will execute them in the MetaTrader 5 trading platform. If you want to know more about how to install MetaTrader 5, to be able to use MQL5 which is built-in with the MetaTrader 5, you can check this topic of Writing MQL5 code in the MetaEditor from my previous article. I recommend applying what you read by yourself if you want to master what you learn as the practice is a very important tool to master anything.
Disclaimer: All information is provided 'as is' only for educational purposes and is not prepared for trading purposes or advice. The information does not guarantee any kind of result. If you choose to use these materials on any of your trading accounts, you will do that at your own risk and you will be the only responsible.
Now, let us go deep into this article to learn a new tool and to add it to our toolkit for an enhanced trading experienced.
OBV definition
In this part, we will learn in more detail about the On-balance Volume (OBV) indicator. But first let us talk about the volume as this indicator is one of the volume indicators. So, volume is the number of shares or contracts that trade during a specific period of time. When we see a high volume it means there is active trading on an instrument, and vice versa, if we see a low volume it means that the instrument is not actively traded.
The volume concept is very important because if there is an instrument that moves up or down accompanied by high volume, it will be stronger than if this movement is accompanied by low volume. The volume has to move with the trend when we have an uptrend, it is better to see that the volume increases with up movement and decreases with corrections to down and vice versa when we have a downtrend, we may find that the volume increases with down movements and decreases with upward corrections.
Volume also confirms if the breakouts are real or they are just false breakouts: when the breakouts are done with high volume, this will be a signal that these breakouts will continue.
If this relationship between the trend and the volume continues the same as what I mentioned it will be a sign of strength for the current trend and if it changed, this will be a sign of weakness. If you do not know what is the trend, you can read the topic of trend definition from a previous article.
The On-balance volume (OBV) was developed by Joseph Granville. It measures the positive and negative volume flow. Now we need to know how we can calculate it. The calculation steps are as follows:
- Check closing price - if it is up or down.
- Add the volume of up days to previous OBV value.
- Subtract the volume of down days from previous OBV value.
- If todays' close is equal to yesterday's close then the OBV value of today will be equal to the OBV value of yesterday.
Let us see an example of these steps and calculate the OBV indicator. Suppose, we have the following data for an instrument:
| Day | Close | Volume |
|---|---|---|
| 1 | 54 | |
| 2 | 55 | 10000 |
| 3 | 60 | 15000 |
| 4 | 65 | 20000 |
| 5 | 60 | 10000 |
| 6 | 55 | 5000 |
| 7 | 60 | 7000 |
| 8 | 50 | 7500 |
| 9 | 48.75 | 8000 |
| 10 | 49 | 5000 |
| 11 | 48 | 6000 |
| 12 | 47.75 | 7500 |
| 13 | 48 | 9000 |
| 14 | 47.50 | 10000 |
| 15 | 48 | 7000 |
| 16 | 47 | 7500 |
| 17 | 46 | 6000 |
| 18 | 44 | 5000 |
| 19 | 45 | 15000 |
To calculate the OBV indicator from the previous data:
We will check closing prices and decide if it higher than the previous closing price or not. If it is higher than the previous closing day we will add next to it "Positive" to refer that this day has up movement. If it is lower than the previous closing day we will add next to it "Negative" to refer that this day has down movement.
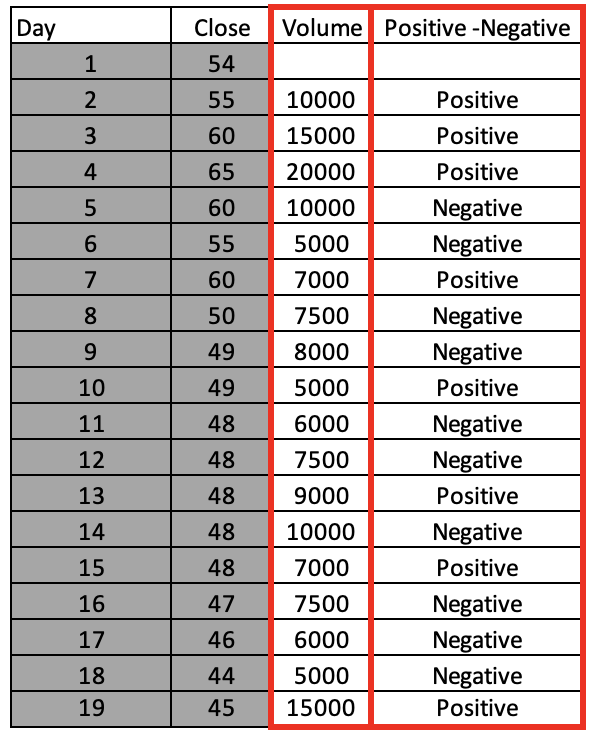
Then, we will add the volume of the positive days to the previous OBV value and we will subtract the volume of the negative days from the previous OBV value.
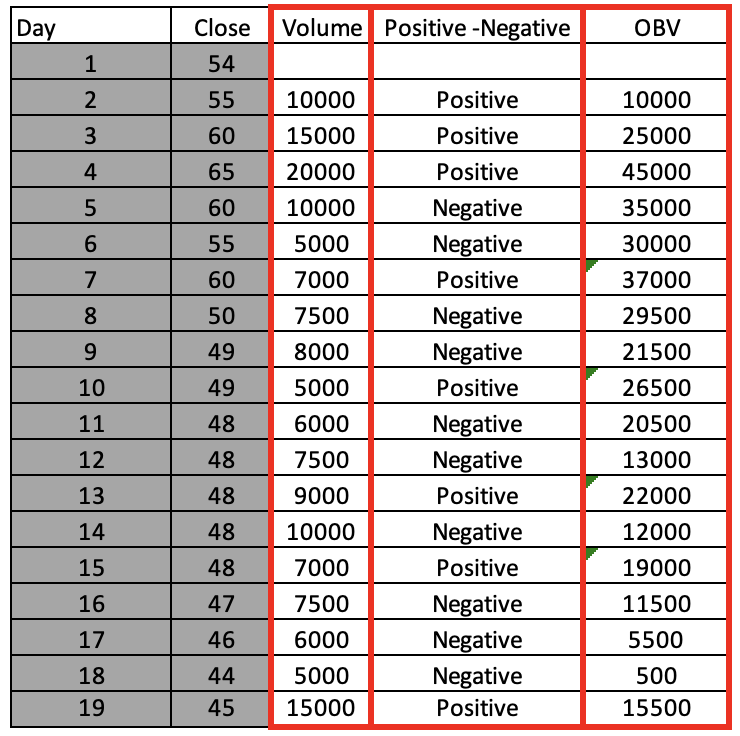
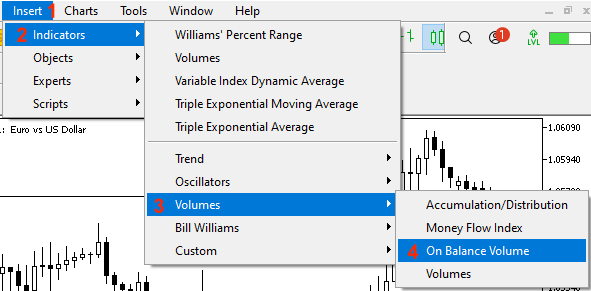
Then, we have now the OBV values calculated and it appears as a curve to measure the positive and negative volume flow. Fortunately, we do not need to calculate this indicator manually as you can find it among the built-in indicators in the MetaTrader 5. The following picture shows how to insert this indicator on the chart:
Once you select the indicator, the following indicator parameters window will open:
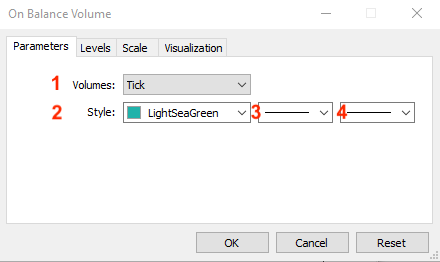
1 - the type of Volumes.
2 - the color of the OBV curve.
3 - the style of the OBV curve.
4 - the thickness of the OBV curve.
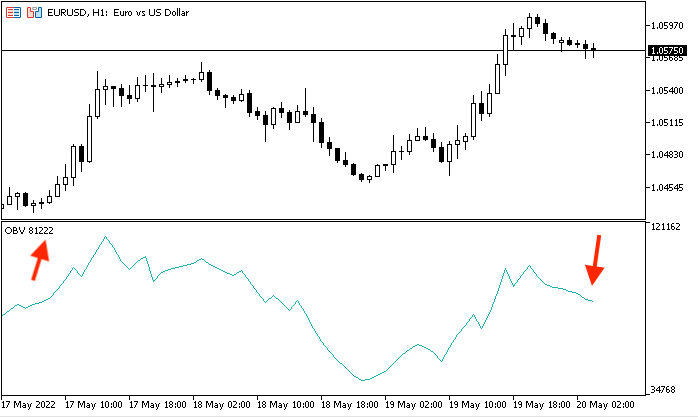
After you set the desired parameters and click OK, the indicator will be attached to the chart:
OBV strategy
In this part, we will learn how to use the OBV indicator based on its concept. We will have a look at simple strategies. However, please note that these strategies may not suit everyone. Therefore, you must test any strategy before using it to know how much it will be useful for you. Here we consider all these strategies with the main objective to learn the basics of the OBV indicator and to see how it works.
- Strategy one: Simple OBV movement
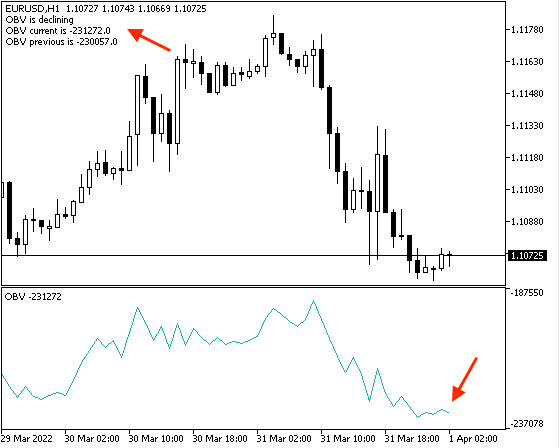
According to this strategy, we need to identify the direction of the OBV curve by comparing the current OBV value with the previous OBV value and see if the current value is greater than the previous one, which means OBV is rising. Vice versa, if the current value is less than the previous one, OBV is declining.
You can change the length of data that you need to compare the current OBV with more previous data but here we just share the idea of how we can use the indicator and how we can code this usage in MQL5. Later on, you you can optimize it according to your preferences.
Current OBV > previous OBV --> OBV is rising
Current OBV < previous OBV --> OBV is declining
- Strategy two: Simple OBV strength
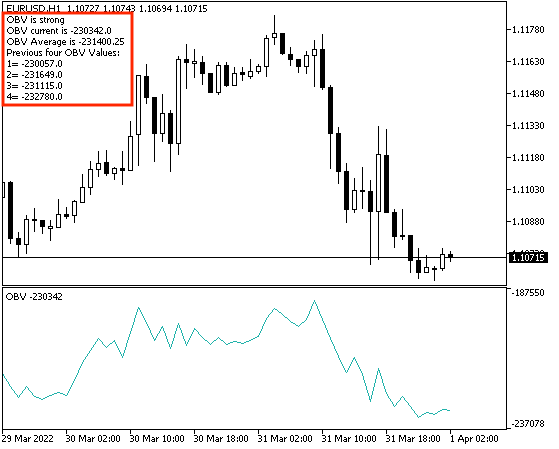
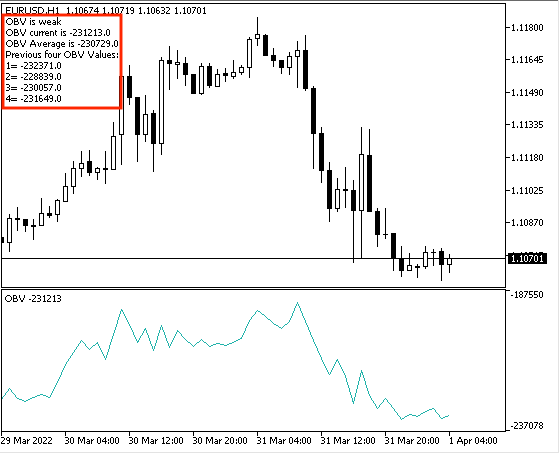
According to this strategy, we need to identify the strength of the current OBV value by comparing it with the average of the previous four OBV values. If the current OBV value is greater than the average of the previous four OBV values, the OBV is strong and vice versa, if the current OBV value is less than the average of the previous four OBV values, then the OBV is weak.
You can also increase the length of the average to compare it with the current data but the objective here is to see how to use the indicator. Then you can adjust whatever you want according to your preferences and testing results.
Current OBV > AVG of previous four OBV value --> OBV is strong
Current OBV < AVG of previous four OBV value --> OBV is weak
- Strategy three: Simple OBV - uptrend
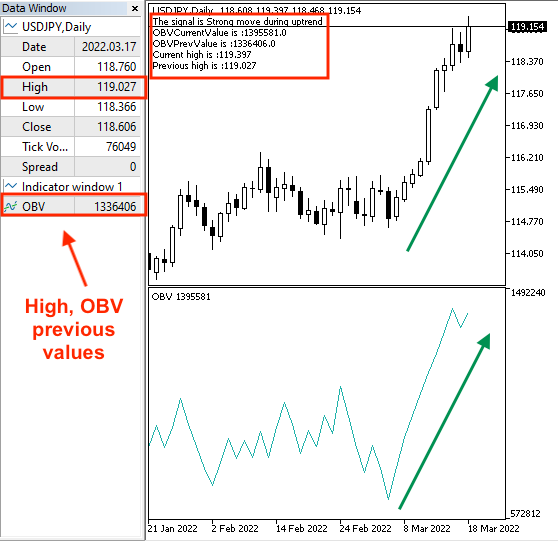
During the uptrend, as we know, it is better to see the volume moves with the trend. So the OBV should increase with the upward movement. So this strategy allows evaluating if the movement is strong or not. We will compare the current OBV value and the previous one and compare the current high and the previous high. When the current OBV value is greater than the previous OBV value and the current high is greater than the previous high, the up movement is strong during the uptrend.
Current OBV > previous OBV and the current high > the previous high --> Strong move during uptrend
- Strategy four: Simple OBV - downtrend
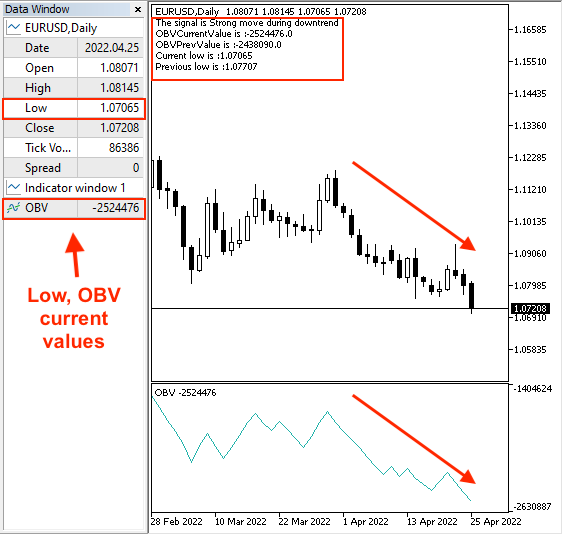
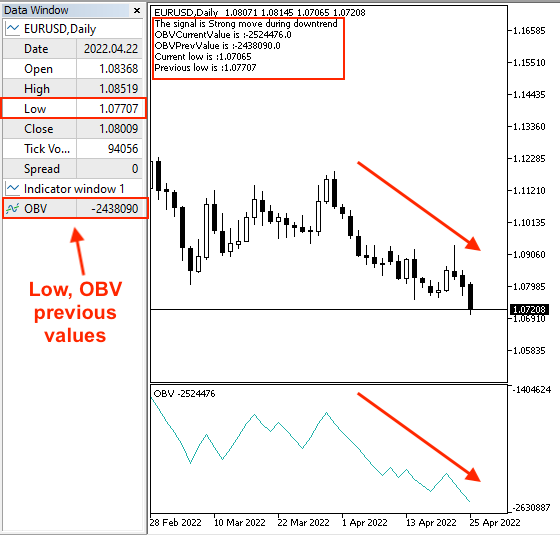
During the downtrend, it is better to see the volume moves with the trend. The OBV should increase with the down movement. This allows understanding if the movement is strong or not. We will compare the current OBV value and the previous OBV value and compare the same time between the current low and the previous low. When the current OBV value is less than the previous OBV value and the current low is less than the previous low, the down movement is strong during the downtrend.
Current OBV < previous OBV and the current low < the previous low --> Strong move during downtrend
OBV strategy blueprint
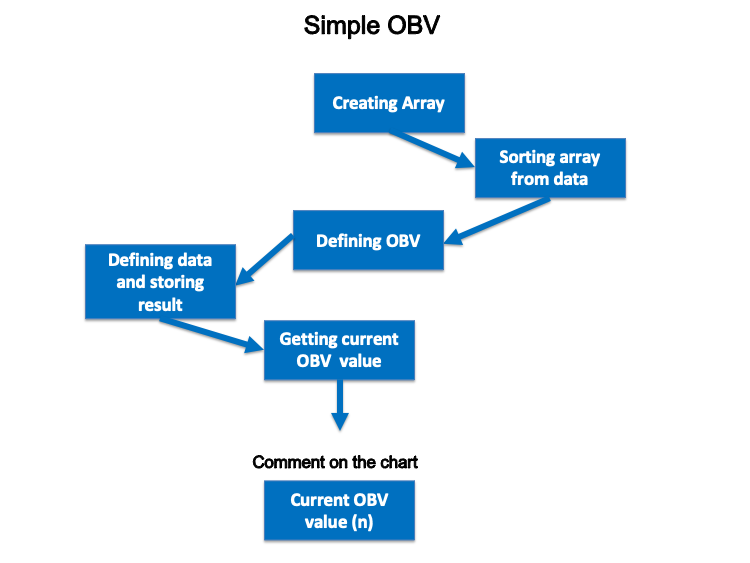
In this part, we will design a blueprint for each strategy. It will provide a clear step-by-step description of how to design a trading system for each mentioned strategy. First, we need to design a simple OBV to present a comment on the chart with the current OBV value. Here is the blueprint for that:
- Strategy one: Simple OBV movement:
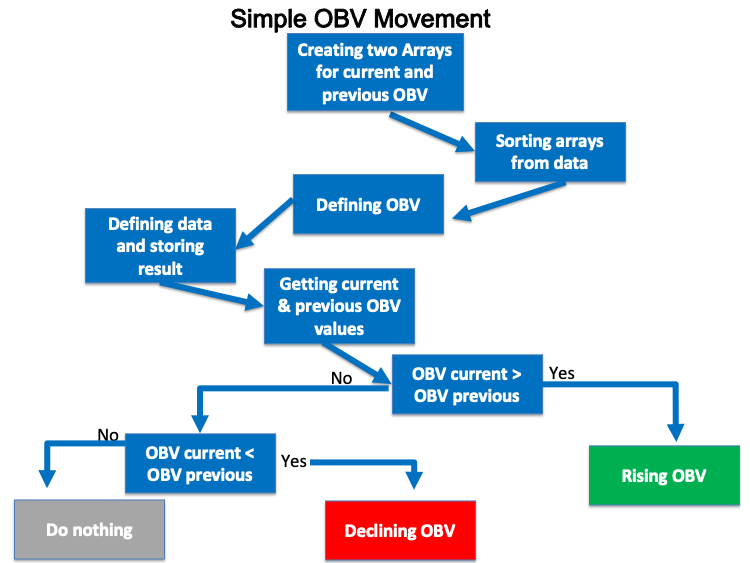
In this strategy, we need to know the direction of the OBV curve based on the current OBV value and the previous OBV value. So, for every tick, we need to check the current OBV and the previous OBV value and when the current value is greater than the previous, this will be a sign that the OBV is rising and vice versa, when the current value is less than the previous, this will be a sign that the OBV is declining.
The following is a step-by-step blueprint for this strategy to help us design a trading system for it:
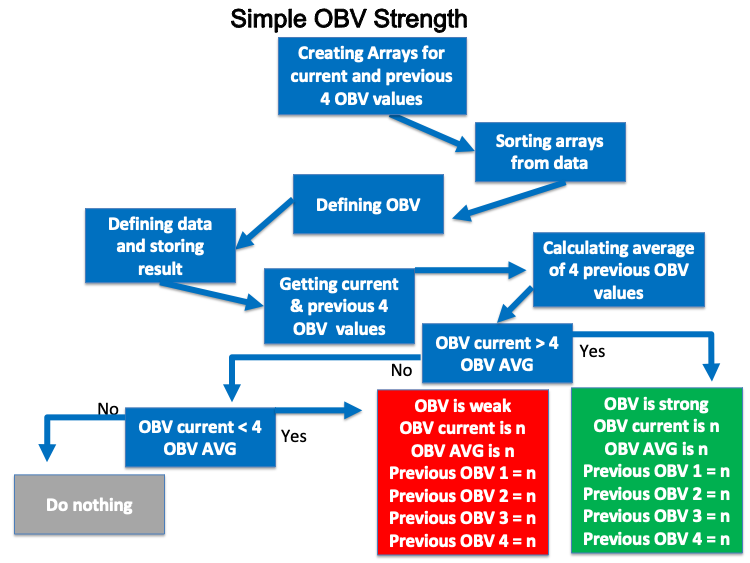
- Strategy two: Simple OBV strength:
In this strategy, we need to measure the strength of the current OBV by comparing it with the average of the previous four values. If the current OBV is greater than the average of the previous four OBV values then the OBV is strong and vice versa if the current OBV is less than the average of previous four OBV values then the OBV is weak.
The following is a step-by-step blueprint to create this trading system:
- Strategy three: Simple OBV - uptrend:
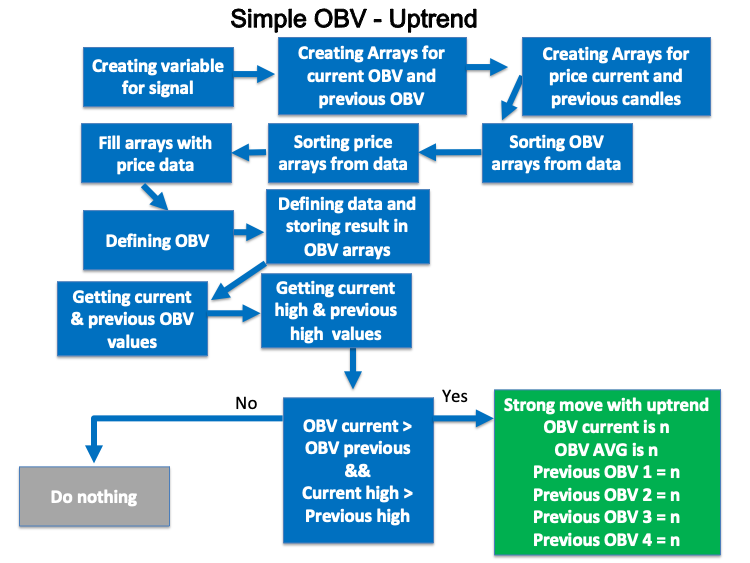
In this strategy, we need to take the advantage of one of the volume indicators that is the OBV to measure the current movement in the prices. So, during the uptrend, we need to check the current OBV value and compare it with the previous OBV value and if the current value is greater than the previous value and we need to check the current high price and compare it with the previous high price and if the current value is greater than the previous value this will be a sign the current up move is strong during the uptrend because we have the current OBV is greater than the previous OBV and the current high is greater than the previous high.
The following is a step-by-step blueprint to code this strategy:
- Strategy four: Simple OBV - downtrend:
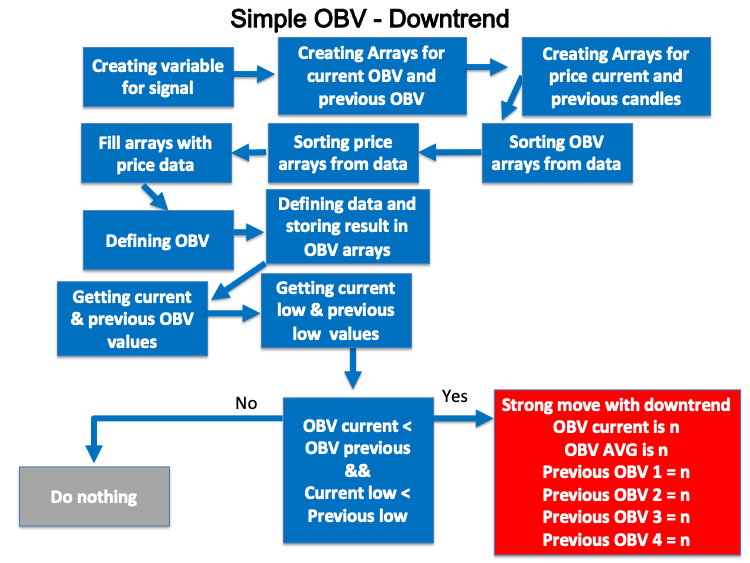
In this strategy, During the downtrend, we need to check the current OBV value and compare it with the previous OBV value and if the current value is less than the previous value and we need to check the current low price and compare it with the previous low price and if the current value is less than the previous value this will be a sign that the current down move is strong during the downtrend because we have the current OBV is less than the previous OBV and the current low is less than the previous low.
The following is a step-by-step blueprint to code this strategy:
OBV trading system
In this interesting part, we will learn how to create a trading system for each mentioned strategy to take the advantage of the programming and MQL5 as the programming is a magic tool that can help us to ease our life by creating a system that can do what we do manually and this is not the only benefit from that as it will execute and do what we need accurately and quickly and a lot of benefits that we can benefit from programming.
Now, we will start creating a trading system for each strategy. First, we will create a simple OBV trading system to generate a comment on the chart with the current OBV value.
- Creating an array for OBV by using the "double" function, the "double" is one real types or floating-point types that is represent values with a fractional part. For your info, there are two types of floating point and they are double and float. "double" type represents numbers with the double accuracy of float type:
double OBVArray[]; - Sorting the OBV array by using the "ArraySetAsSeries" function that returns true or false:
ArraySetAsSeries(OBVArray,true);
- Defining the OBV by using the "iOBV" function after creating an integer variable for OBVDef and the "iOBV" function returns the handle of the On Balance Volume indicator and its parameters are (symbol, period, applied volume):
int OBVDef =iOBV(_Symbol, _Period,VOLUME_TICK);
- Filling the OBVArray with OBVDef by using the "CopyBuffer" function that returns the copied data count and its parameters are (indicator handle, buffer num, start time, stop time, buffer):
CopyBuffer(OBVDef,0,0,3,OBVArray);
- Calculating the current OBV value after creating a double variable for OBVValue:
double OBVValue=OBVArray[0];
- Creating a comment by using the "comment" function to appear a comment on the chart with the current OBV value:
Comment("OBV Value is: ",OBVValue);
So, the following is the full code for the previous trading system that appears comment with the current OBV value:
//+------------------------------------------------------------------+
//|                                                   Simple OBV.mq5 |
//|                                  Copyright 2022, MetaQuotes Ltd. |
//|                                             https://www.mql5.com |
//+------------------------------------------------------------------+
#property copyright "Copyright 2022, MetaQuotes Ltd."
#property link      "https://www.mql5.com"
#property version   "1.00"
//+------------------------------------------------------------------+
void OnTick()
  {
   //creating an array for OBV
   double OBVArray[];

   //sorting the array from the current data
   ArraySetAsSeries(OBVArray,true);

   //defining OBV
   int OBVDef =iOBV(_Symbol, _Period,VOLUME_TICK);

   //defining EA, buffer, sorting in array
   CopyBuffer(OBVDef,0,0,3,OBVArray);

   //calculating current OBV value
   double OBVValue=OBVArray[0];

   //creating a comment with OBV value
   Comment("OBV Value is: ",OBVValue);
  }
//+------------------------------------------------------------------+
After compiling this code, we can find it in the navigator of the MetaTrader 5 the same as the following:
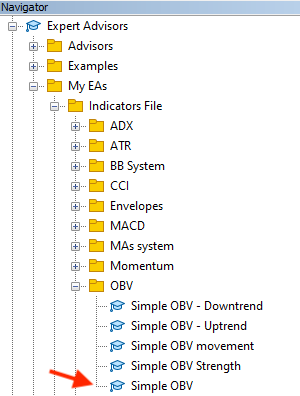
If we wanted to execute it, we will double-click on the file or drag and drop it on the chart, we will find the following window appear:
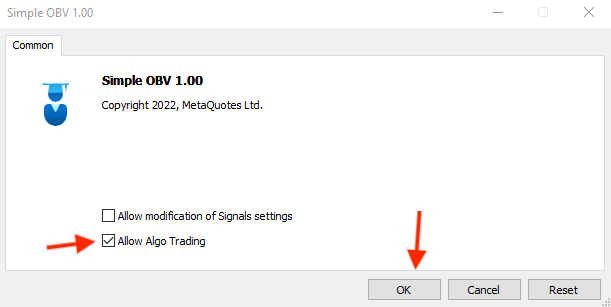
After pressing "OK", we will find that the expert advisor will be attached to the chart the same as the following picture:
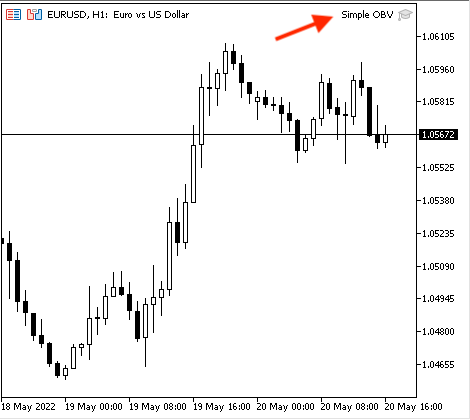
Then, we can find the generated signal appears the same as the following example from testing:
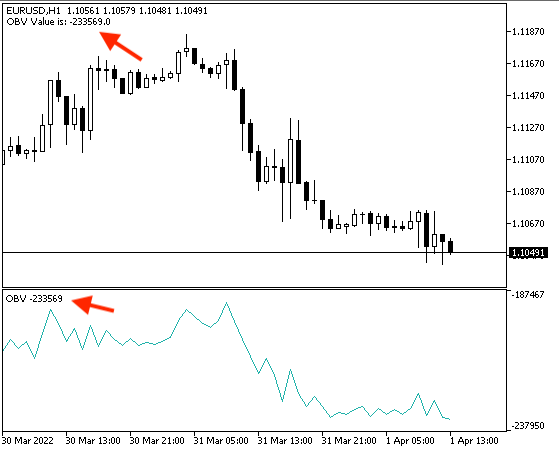
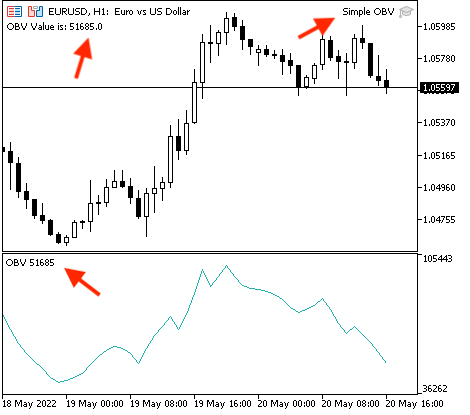
If we wanted to make sure that we will get the same value as the Meta Trader 5 built-in On Balance Volume indicator we can do that by inserting the On Balance Volume indicator the same as we mentioned before after attaching our created expert advisor then we will find that values will be the same and the following is an example of that:
Now, we need to create a trading system for each mentioned strategy, and the following is how to do that.
- Strategy one: Simple OBV movement:
According to this strategy the same as I mentioned, we need to compare two values and they are the current OBV value with the previous OBV value, and decide if the current value is greater than the previous value, we need a signal that appears as a comment on the chart that says "OBV is rising", the OBV current value, and the previous OBV value. The following is the full code to create this kind of strategy:
//+------------------------------------------------------------------+
//|                                          Simple OBV movement.mq5 |
//|                                  Copyright 2022, MetaQuotes Ltd. |
//|                                             https://www.mql5.com |
//+------------------------------------------------------------------+
#property copyright "Copyright 2022, MetaQuotes Ltd."
#property link      "https://www.mql5.com"
#property version   "1.00"
//+------------------------------------------------------------------+
void OnTick()
  {
//creating an two arrays for OBV
   double OBVArray1[];
   double OBVArray2[];

//sorting the array from the current data
   ArraySetAsSeries(OBVArray1,true);
   ArraySetAsSeries(OBVArray2,true);

//defining OBV
   int OBVDef =iOBV(_Symbol, _Period,VOLUME_TICK);

//defining EA, buffer, sorting in array
   CopyBuffer(OBVDef,0,0,3,OBVArray1);
   CopyBuffer(OBVDef,0,0,3,OBVArray2);

//getting the value of current and previous OBV
   double OBVCurrentValue=NormalizeDouble(OBVArray1[0],5);
   double OBVPrevValue=NormalizeDouble(OBVArray2[1],5);

//creating conditions of rising and declining OBV based on its values
   if(OBVCurrentValue>OBVPrevValue)
     {
      Comment("OBV is rising","\n","OBV current is ",OBVCurrentValue,"\n","OBV previous is ",OBVPrevValue);
     }

   if(OBVCurrentValue<OBVPrevValue)
     {
      Comment("OBV is declining","\n","OBV current is ",OBVCurrentValue,"\n","OBV previous is ",OBVPrevValue);
     }

  }
//+------------------------------------------------------------------+
- Differences in this code:
double OBVArray1[];
double OBVArray2[];
Sorting these two arrays from current data:
ArraySetAsSeries(OBVArray1,true);
ArraySetAsSeries(OBVArray2,true);
Filling these two arrays:
CopyBuffer(OBVDef,0,0,3,OBVArray1);
CopyBuffer(OBVDef,0,0,3,OBVArray2);
Getting values of the current and previous OBV by using the "NormalizeDouble" function that returns double value type with preset accuracy after creating a double variable for OBVCurrentValue and OBVPrevValue and parameters of the "NormalizeDouble" is (value, and digits), the value will be the OBVArray and digits will be 5 that is a number of digits after the decimal point:
double OBVCurrentValue=NormalizeDouble(OBVArray1[0],5);
double OBVPrevValue=NormalizeDouble(OBVArray2[1],5);
Setting conditions of rising and declining OBV by using the "if" function:
if(OBVCurrentValue>OBVPrevValue)
   {
    Comment("OBV is rising","\n","OBV current is ",OBVCurrentValue,"\n","OBV previous is ",OBVPrevValue);
   }

if(OBVCurrentValue<OBVPrevValue)
   {
    Comment("OBV is declining","\n","OBV current is ",OBVCurrentValue,"\n","OBV previous is ",OBVPrevValue);
   }
After compiling the expert will appear in the navigator window among the "Expert Advisors" folder in the MetaTrader 5 trading platform the same as the following:
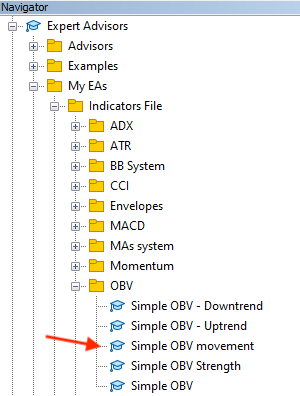
By double-clicking the expert file the following window will appear:
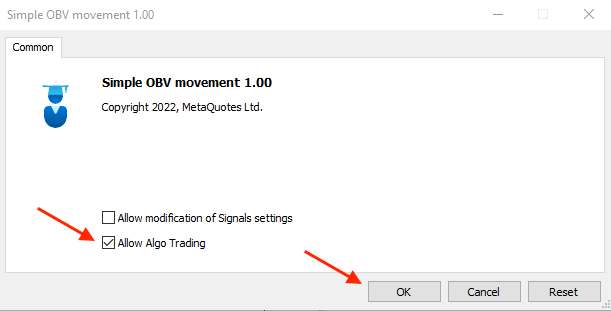
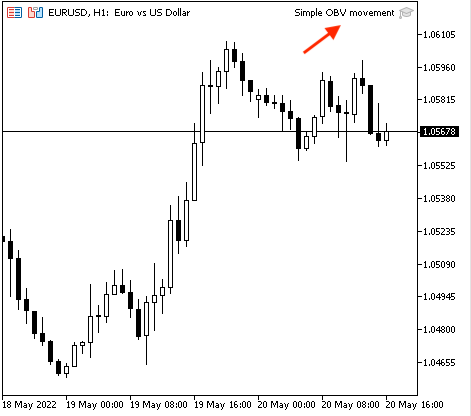
By pressing "OK", the expert will be attached to the chart the same as the following:
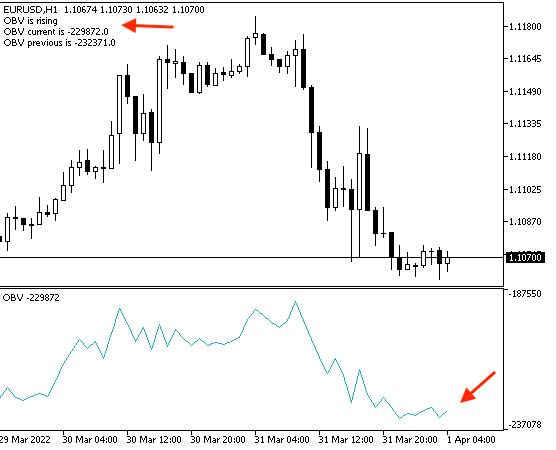
The following are examples from testing for generated signals according to this strategy,
Rising OBV:
Declining OBV:
- Strategy two: Simple OBV strength:
According to this strategy the same as I mentioned, we need to compare two values and they are the current OBV value and the average value of the previous four OBV values after calculating this average and then decide if the current value is greater than the average this means that the "OBV is strong" and vice versa, if the current value is less than the average this means that the "OBV is weak". The following is the full code to create a trading system for this strategy:
//+------------------------------------------------------------------+
//|                                          Simple OBV Strength.mq5 |
//|                                  Copyright 2022, MetaQuotes Ltd. |
//|                                             https://www.mql5.com |
//+------------------------------------------------------------------+
#property copyright "Copyright 2022, MetaQuotes Ltd."
#property link      "https://www.mql5.com"
#property version   "1.00"
//+------------------------------------------------------------------+
void OnTick()
  {
   //creating an six arrays for OBV
   double OBVArray0[];
   double OBVArray1[];
   double OBVArray2[];
   double OBVArray3[];
   double OBVArray4[];

   //sorting arrays from the current data
   ArraySetAsSeries(OBVArray0,true);
   ArraySetAsSeries(OBVArray1,true);
   ArraySetAsSeries(OBVArray2,true);
   ArraySetAsSeries(OBVArray3,true);
   ArraySetAsSeries(OBVArray4,true);

   //defining OBV
   int OBVDef =iOBV(_Symbol, _Period,VOLUME_TICK);

   //defining EA, buffer, sorting in arrays
   CopyBuffer(OBVDef,0,0,5,OBVArray0);
   CopyBuffer(OBVDef,0,0,5,OBVArray1);
   CopyBuffer(OBVDef,0,0,5,OBVArray2);
   CopyBuffer(OBVDef,0,0,5,OBVArray3);
   CopyBuffer(OBVDef,0,0,5,OBVArray4);

   //getting the value of current OBV & previous 5 values
   double OBVCurrentValue=NormalizeDouble(OBVArray0[0],5);
   double OBVPrevValue1=NormalizeDouble(OBVArray1[1],5);
   double OBVPrevValue2=NormalizeDouble(OBVArray2[2],5);
   double OBVPrevValue3=NormalizeDouble(OBVArray3[3],5);
   double OBVPrevValue4=NormalizeDouble(OBVArray4[4],5);

   //calculating average of previous OBV value
   double OBVAVG=((OBVPrevValue1+OBVPrevValue2+OBVPrevValue3+OBVPrevValue4)/4);

   if(OBVCurrentValue>OBVAVG)
   {
      Comment("OBV is strong","\n","OBV current is ",OBVCurrentValue,"\n","OBV Average is ",OBVAVG,"\n","Previous four OBV Values: ",
      "\n", "1= ",OBVPrevValue1,"\n", "2= ",OBVPrevValue2,"\n", "3= ",OBVPrevValue3,"\n", "4= ",OBVPrevValue4);
   }

   if(OBVCurrentValue<OBVAVG)
   {
      Comment("OBV is weak","\n","OBV current is ",OBVCurrentValue,"\n","OBV Average is ",OBVAVG,"\n","Previous four OBV Values: ",
      "\n", "1= ",OBVPrevValue1,"\n", "2= ",OBVPrevValue2,"\n", "3= ",OBVPrevValue3,"\n", "4= ",OBVPrevValue4);
   }

  }
//+------------------------------------------------------------------+
- Differences in this code:
Creating five arrays for OBV values:
double OBVArray0[];
double OBVArray1[];
double OBVArray2[];
double OBVArray3[];
double OBVArray4[];
Sorting these created arrays from the current data:
ArraySetAsSeries(OBVArray0,true);
ArraySetAsSeries(OBVArray1,true);
ArraySetAsSeries(OBVArray2,true);
ArraySetAsSeries(OBVArray3,true);
ArraySetAsSeries(OBVArray4,true);
Filling them with defined OBVDef:
CopyBuffer(OBVDef,0,0,5,OBVArray0);
CopyBuffer(OBVDef,0,0,5,OBVArray1);
CopyBuffer(OBVDef,0,0,5,OBVArray2);
CopyBuffer(OBVDef,0,0,5,OBVArray3);
CopyBuffer(OBVDef,0,0,5,OBVArray4);
Getting values of the current and the four previous OBV:
double OBVCurrentValue=NormalizeDouble(OBVArray0[0],5);
double OBVPrevValue1=NormalizeDouble(OBVArray1[1],5);
double OBVPrevValue2=NormalizeDouble(OBVArray2[2],5);
double OBVPrevValue3=NormalizeDouble(OBVArray3[3],5);
double OBVPrevValue4=NormalizeDouble(OBVArray4[4],5);
Calculating the average of the previous four OBV values after creating a double variable for the OBVAVG:
double OBVAVG=((OBVPrevValue1+OBVPrevValue2+OBVPrevValue3+OBVPrevValue4)/4);
Setting conditions of strong and weak OBV with the comment:
if(OBVCurrentValue>OBVAVG)
{
 Comment("OBV is strong","\n","OBV current is ",OBVCurrentValue,"\n","OBV Average is ",OBVAVG,"\n","Previous four OBV Values: ",
  "\n", "1= ",OBVPrevValue1,"\n", "2= ",OBVPrevValue2,"\n", "3= ",OBVPrevValue3,"\n", "4= ",OBVPrevValue4);
}

if(OBVCurrentValue<OBVAVG)
{
 Comment("OBV is weak","\n","OBV current is ",OBVCurrentValue,"\n","OBV Average is ",OBVAVG,"\n","Previous four OBV Values: ",
  "\n", "1= ",OBVPrevValue1,"\n", "2= ",OBVPrevValue2,"\n", "3= ",OBVPrevValue3,"\n", "4= ",OBVPrevValue4);
}
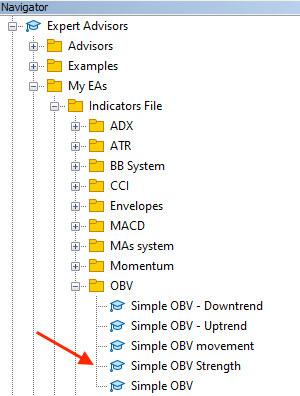
After compiling, we will find the expert the same as the following in the navigator window:
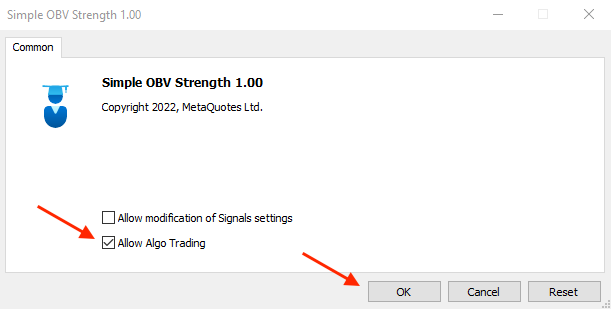
The following is the window of the expert after choosing the file to execute on the MetaTrader 5:
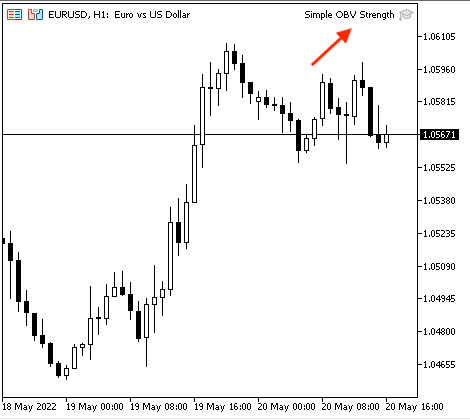
After clicking "OK", the expert will be attached to the chart the same as the following picture:
The following are examples from testing for signals:
Strong OBV:
Weak OBV:
- Strategy three: Simple OBV - uptrend:
According to this strategy, during the uptrend, we need to check if we have a higher high price and at the same time, we have a higher OBV value. So, we need to check if the current OBV value is greater than the previous OBV value and if the current high price is greater than the previous high price, then we have a signal of a "Strong move during uptrend". The following is the full code to create this kind of strategy:
//+------------------------------------------------------------------+
//|                                         Simple OBV - Uptrend.mq5 |
//|                                  Copyright 2022, MetaQuotes Ltd. |
//|                                             https://www.mql5.com |
//+------------------------------------------------------------------+
#property copyright "Copyright 2022, MetaQuotes Ltd."
#property link      "https://www.mql5.com"
#property version   "1.00"
//+------------------------------------------------------------------+
void OnTick()
  {
   //creating a string variable for signal
   string signal="";

   //creating two OBV arrays for OBV
   double OBVArray0[];
   double OBVArray1[];

   //creating two price arrays
   MqlRates PriceArray0[];
   MqlRates PriceArray1[];

   //sorting OBV arrays from the current data
   ArraySetAsSeries(OBVArray0,true);
   ArraySetAsSeries(OBVArray1,true);

   //sorting Price arrays from the current data
   ArraySetAsSeries(PriceArray0,true);
   ArraySetAsSeries(PriceArray1,true);

   //fill arrays with price data
   int Data0=CopyRates(_Symbol,_Period,0,3,PriceArray0);
   int Data1=CopyRates(_Symbol,_Period,0,3,PriceArray1);

   //defining OBV
   int OBVDef =iOBV(_Symbol, _Period,VOLUME_TICK);

   //defining EA, buffer, sorting in arrays
   CopyBuffer(OBVDef,0,0,3,OBVArray0);
   CopyBuffer(OBVDef,0,0,3,OBVArray1);

   //getting the value of current & the previous OBV
   double OBVCurrentValue=NormalizeDouble(OBVArray0[0],5);
   double OBVPrevValue=NormalizeDouble(OBVArray1[1],5);

   //getting the value of current high & the previous high
   double CurrentHighValue=NormalizeDouble(PriceArray0[0].high,5);
   double PrevHighValue=NormalizeDouble(PriceArray1[1].high,5);

   //strong move signal
   //if OBVCurrentValue>OBVPrevValue && current high> previous high
   if(OBVCurrentValue > OBVPrevValue && PriceArray0[0].high>PriceArray0[1].high)
   {
      signal="Strong move during uptrend";
   }

   //comment with the signal
   Comment("The signal is ",signal,"\n","OBVCurrentValue is :",OBVCurrentValue,
   "\n","OBVPrevValue is :", OBVPrevValue,"\n","Current high is :",CurrentHighValue,"\n","Previous high is :",PrevHighValue);
  }
//+------------------------------------------------------------------+
Differences in this code:
Creating a string variable for "signal" by using the "string" function that stores text strings assigned to empty as we will calculate it later:
string signal="";
Creating two arrays for OBV by using the "double" function and two arrays for prices by using the "MqlRates" function that stores information about the prices, volume, and spread:
//creating two OBV arrays for OBV
double OBVArray0[];
double OBVArray1[];

//creating two price arrays
MqlRates PriceArray0[];
MqlRates PriceArray1[];1[];
Sorting these arrays from the current data:
//sorting OBV arrays from the current data
ArraySetAsSeries(OBVArray0,true);
ArraySetAsSeries(OBVArray1,true);

//sorting Price arrays from the current data
ArraySetAsSeries(PriceArray0,true);
ArraySetAsSeries(PriceArray1,true);
Filling price arrays with price data by using the "CopyRates" function that gets history data of the "MqlRates" structure after creating integer variables for Data0 and Data1 for each array:
int Data0=CopyRates(_Symbol,_Period,0,3,PriceArray0);
int Data1=CopyRates(_Symbol,_Period,0,3,PriceArray1);
Defining the OBV and filling the two OBVArray with it:
int OBVDef =iOBV(_Symbol, _Period,VOLUME_TICK);

CopyBuffer(OBVDef,0,0,3,OBVArray0);
CopyBuffer(OBVDef,0,0,3,OBVArray1);
Getting values of OBV and highs:
//getting the value of current & the previous OBV
double OBVCurrentValue=NormalizeDouble(OBVArray0[0],5);
double OBVPrevValue=NormalizeDouble(OBVArray1[1],5);

//getting the value of current high & the previous high
double CurrentHighValue=NormalizeDouble(PriceArray0[0].high,5);
double PrevHighValue=NormalizeDouble(PriceArray1[1].high,5);
Setting conditions of the "Strong move during uptrend" and the comment:
Comment("The signal is ",signal,"\n","OBVCurrentValue is :",OBVCurrentValue,
"\n","OBVPrevValue is :", OBVPrevValue,"\n","Current high is :",CurrentHighValue,"\n","Previous high is :",PrevHighValue);
If we compile the code, we will find the expert in the navigator window:
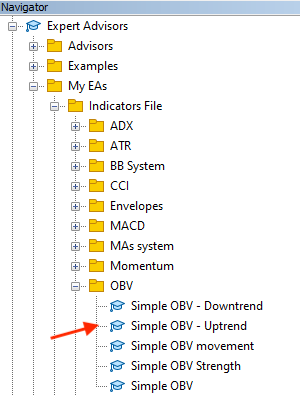
The expert window after choosing the file to execute on the MetaTrader 5 will be the same as the following:
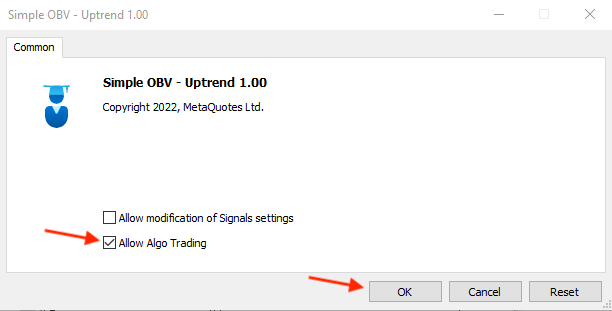
After clicking "OK", the expert will be attached to the chart the same as the following picture:
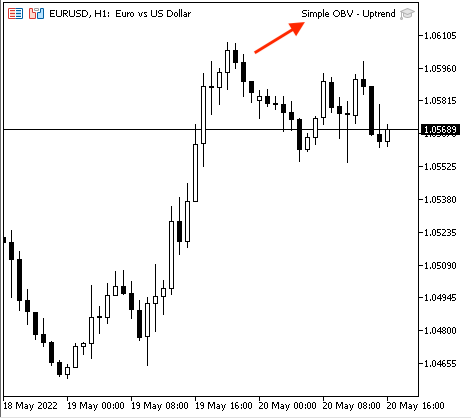
The following are examples from testing for signals,
Signal with data window for the current data:
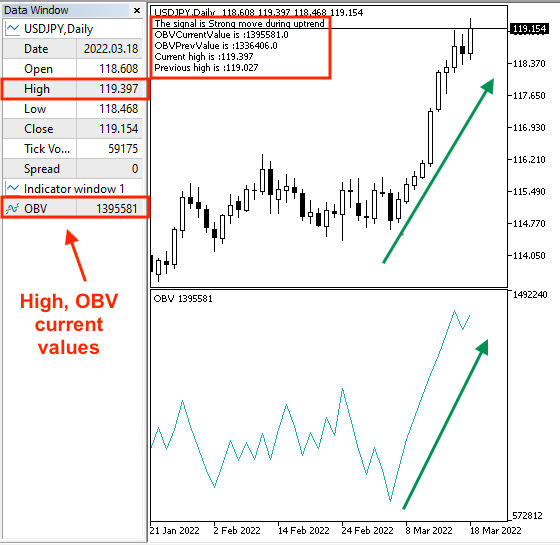
Signal with data window for the previous data:
- Strategy four: Simple OBV - downtrend:
According to this strategy, it will be the reverse of the simple OBV - uptrend strategy as we need to check if we have a lower low price and at the same time, we have a lower value of the OBV. So, we need to check if the current OBV value is less than the previous OBV value and if the current low price is less than the previous low price, then we have a signal of a "Strong move during downtrend". The following is the full code to create this kind of strategy:
//+------------------------------------------------------------------+
//|                                       Simple OBV - Downtrend.mq5 |
//|                                  Copyright 2022, MetaQuotes Ltd. |
//|                                             https://www.mql5.com |
//+------------------------------------------------------------------+
#property copyright "Copyright 2022, MetaQuotes Ltd."
#property link      "https://www.mql5.com"
#property version   "1.00"
//+------------------------------------------------------------------+
void OnTick()
  {
   //create a string variable for signal
   string signal="";

   //creating two OBV arrays
   double OBVArray0[];
   double OBVArray1[];

   //creating two price arrays
   MqlRates PriceArray0[];
   MqlRates PriceArray1[];

   //sorting OBV arrays from the current data
   ArraySetAsSeries(OBVArray0,true);
   ArraySetAsSeries(OBVArray1,true);

   //sorting Price arrays from the current data
   ArraySetAsSeries(PriceArray0,true);
   ArraySetAsSeries(PriceArray1,true);

   //fill array with price data
   int Data0=CopyRates(_Symbol,_Period,0,3,PriceArray0);
   int Data1=CopyRates(_Symbol,_Period,0,3,PriceArray1);

   //defining OBV
   int OBVDef =iOBV(_Symbol, _Period,VOLUME_TICK);

   //defining EA, buffer, sorting in arrays
   CopyBuffer(OBVDef,0,0,3,OBVArray0);
   CopyBuffer(OBVDef,0,0,3,OBVArray1);

   //getting the value of current OBV & the previous value
   double OBVCurrentValue=NormalizeDouble(OBVArray0[0],5);
   double OBVPrevValue=NormalizeDouble(OBVArray1[1],5);

   //getting the value of current OBV & the previous value
   double CurrentLowValue=NormalizeDouble(PriceArray0[0].low,5);
   double PrevLowValue=NormalizeDouble(PriceArray1[1].low,5);

   //strong move signal
   //if OBVCurrentValue>OBVPrevValue && current low> previous low
   if(OBVCurrentValue < OBVPrevValue && PriceArray0[0].low<PriceArray0[1].low)
   {
      signal="Strong move during downtrend";
   }

   //comment with the signal
   Comment("The signal is ",signal,"\n","OBVCurrentValue is :",OBVCurrentValue,
   "\n","OBVPrevValue is :", OBVPrevValue,"\n","Current low is :",CurrentLowValue,"\n","Previous low is :",PrevLowValue);
  }
//+------------------------------------------------------------------+
- Differences in this code:
Setting condition of the "Strong move during downtrend" and the comment:
Comment("The signal is ",signal,"\n","OBVCurrentValue is :",OBVCurrentValue,
"\n","OBVPrevValue is :", OBVPrevValue,"\n","Current low is :",CurrentLowValue,"\n","Previous low is :",PrevLowValue);
Now, we will compile it, then we can find the expert in the navigator window the same as the following:
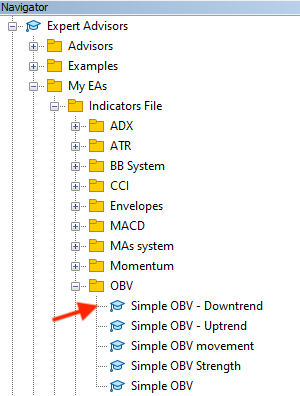
By dragging and dropping the file on the chart, the following window will appear:
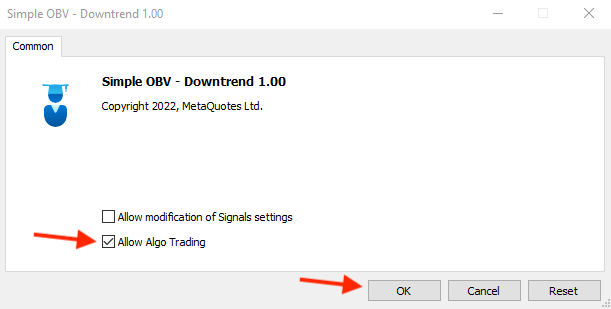
By pressing the "OK" button, the expert will be attached the same as the following picture:
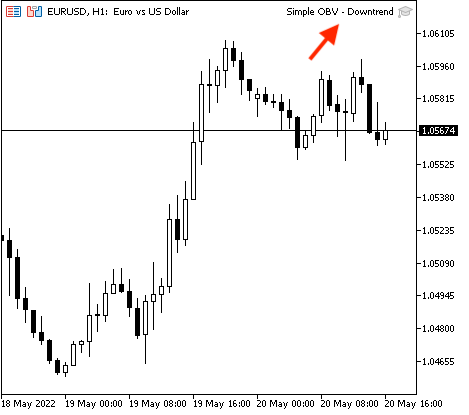
The following is an example of generated signals from testing,
Signal with current data window:
Signal with the previous data window:
Conclusion
At the conclusion of this article, we learned another new technical indicator that uses the volume in its calculation to see another perspective in the chart to enhance our trading decisions. this indicator is the On Balance Volume (OBV) and we learned it in detail as we learned what is the OBV indicator, what it measures, and we can calculate it manually to know what is hiding beyond its basics. We learned also, how we can use it according to its basics and learned some simple strategies that can be useful or can help us to realize new ideas that can be profitable and this is the main objective of this article and other articles in this series. We designed a blueprint for each mentioned strategy to help us to write the code for each strategy to create a trading system for them. After that, we created an expert advisor for each mentioned strategy by the MQL5 (MetaQuotes Language) to execute them in the MetaTrader 5 trading platform to generate signals automatically and accurately according to preset conditions and rules of each strategy.
I want to mention that one of the most beneficial things in technical analysis is that we can see more than one perspective about the financial instrument according to the tool that we use and we can also combine more than one tool or indicator, especially when we use some tools to view the whole picture of the financial instrument to be able to take the suitable decision clearly and this approach helps us to create a reliable trading system. So, let this approach in front of you while reading or learning anything to be able to realize which tool that can be used with another to give you more clear insights and better results.
I need to confirm again that this article and others in this series are for educational purposes only and designed for beginners only to learn the root of things and realize what we can do by programming, especially by the MQL5, and how much does it help us to ease and enhance our trading business. You must test any strategy before using it as there is nothing that can suit all people and you have to do your work in testing and validating anything to see if it is useful for you or not. I advise you to apply everything by yourself to deepen your learning and understanding.
I hope that you found this article useful and I hope that you learned something about the topic of this article or about any related topics in the trading world. If you found this article useful and you want to read similar articles, you can read my previous articles in this series to learn how to design a trading system based on popular technical indicators.
Warning: All rights to these materials are reserved by MetaQuotes Ltd. Copying or reprinting of these materials in whole or in part is prohibited.
This article was written by a user of the site and reflects their personal views. MetaQuotes Ltd is not responsible for the accuracy of the information presented, nor for any consequences resulting from the use of the solutions, strategies or recommendations described.
 Developing a trading Expert Advisor from scratch (Part 7): Adding Volume at Price (I)
 Video: Simple automated trading – How to create a simple Expert Advisor with MQL5
- Free trading apps
- Over 8,000 signals for copying
- Economic news for exploring financial markets
You agree to website policy and terms of use