MQL4 and MQL5 Programming Articles
Study the MQL5 language for programming trading strategies in numerous published articles mostly written by you - the community members. The articles are grouped into categories to help you quicker find answers to any questions related to programming: Integration, Tester, Trading Strategies, etc.
Follow our new publications and discuss them on the Forum!
Add a new article

You are missing trading opportunities:
- Free trading apps
- Over 8,000 signals for copying
- Economic news for exploring financial markets
Registration
Log in
You agree to website policy and terms of use
If you do not have an account, please register

MQL5 Cookbook: Position Properties on the Custom Info Panel
This time we will create a simple Expert Advisor that will get position properties on the current symbol and display them on the custom info panel during manual trading. The info panel will be created using graphical objects and displayed information will be refreshed at every tick. This is going to be much more convenient than all the time having to manually run the script described in the previous article of the series called "MQL5 Cookbook: Getting Position Properties".

Price Action Analysis Toolkit Development (Part 27): Liquidity Sweep With MA Filter Tool
Understanding the subtle dynamics behind price movements can give you a critical edge. One such phenomenon is the liquidity sweep, a deliberate strategy that large traders, especially institutions, use to push prices through key support or resistance levels. These levels often coincide with clusters of retail stop-loss orders, creating pockets of liquidity that big players can exploit to enter or exit sizeable positions with minimal slippage.

How to Create an Interactive MQL5 Dashboard/Panel Using the Controls Class (Part 1): Setting Up the Panel
In this article, we create an interactive trading dashboard using the Controls class in MQL5, designed to streamline trading operations. The panel features a title, navigation buttons for Trade, Close, and Information, and specialized action buttons for executing trades and managing positions. By the end of the article, you will have a foundational panel ready for further enhancements in future installments.

Drawing Dial Gauges Using the CCanvas Class
We can find dial gauges in cars and airplanes, in industrial production and everyday life. They are used in all spheres which require quick response to behavior of a controlled value. This article describes the library of dial gauges for MetaTrader 5.
Library for easy and quick development of MetaTrader programs (part X): Compatibility with MQL4 - Events of opening a position and activating pending orders
In the previous articles, we started creating a large cross-platform library simplifying the development of programs for MetaTrader 5 and MetaTrader 4 platforms. In the ninth part, we started improving the library classes for working with MQL4. Here we will continue improving the library to ensure its full compatibility with MQL4.

Building a Professional Trading System with Heikin Ashi (Part 1): Developing a custom indicator
This article is the first installment in a two-part series designed to impart practical skills and best practices for writing custom indicators in MQL5. Using Heikin Ashi as a working example, the article explores the theory behind Heikin Ashi charts, explains how Heikin Ashi candlesticks are calculated, and demonstrates their application in technical analysis. The centerpiece is a step-by-step guide to developing a fully functional Heikin Ashi indicator from scratch, with clear explanations to help readers understand what to code and why. This foundational knowledge sets the stage for Part Two, where we will build an expert advisor that trades based on Heikin Ashi logic.

Dr. Tradelove or How I Stopped Worrying and Created a Self-Training Expert Advisor
Just over a year ago joo, in his article "Genetic Algorithms - It's Easy!", gave us a tool for implementation of the genetic algorithm in MQL5. Now utilizing the tool we will create an Expert Advisor that will genetically optimize its own parameters upon certain boundary conditions...
Creating Non-Lagging Digital Filters
The article describes one of the approaches to determining a useful signal (trend) in stream data. Small filtering (smoothing) tests applied to market quotes demonstrate the potential for creating non-lagging digital filters (indicators) that are not redrawn on the last bars.

Tips from a professional programmer (Part I): Code storing, debugging and compiling. Working with projects and logs
These are some tips from a professional programmer about methods, techniques and auxiliary tools which can make programming easier.

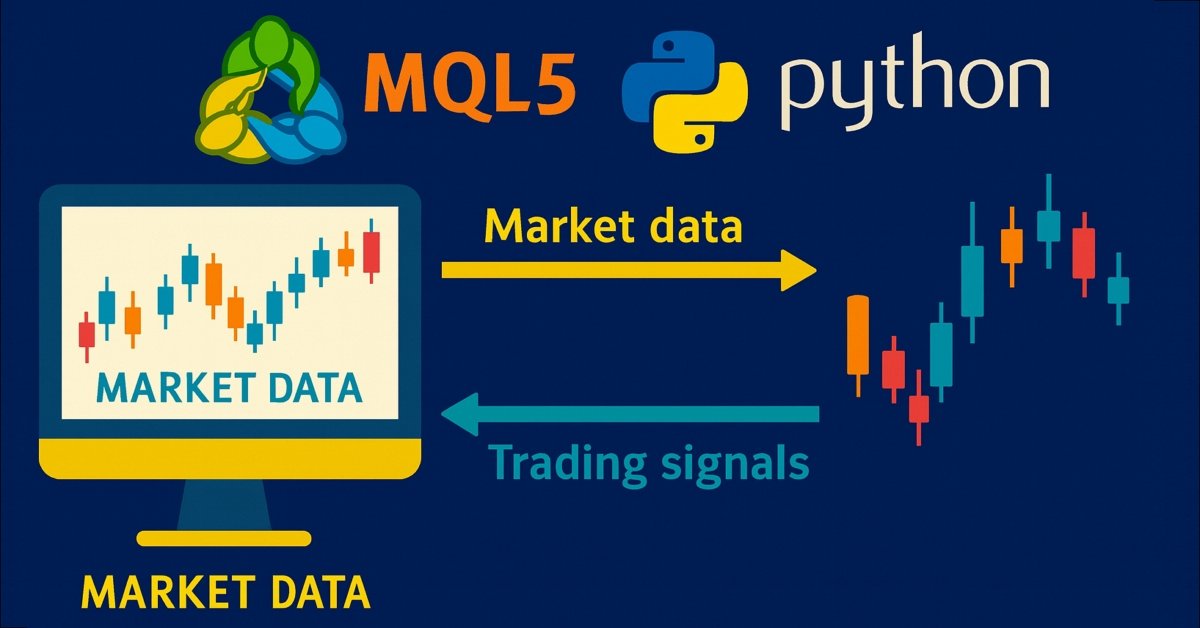
Python + MetaTrader 5: Fast Research Framework for Data, Features, and Prototypes
The article demonstrates how Python and MetaTrader 5 integration combines research flexibility and trade execution into a single workflow. Python is used for data analysis, feature selection and model training, while MetaTrader 5 is used for testing and trading automation. This approach simplifies the transfer of solutions into practice, increases reproducibility, and makes the development of trading systems faster and more structured.

Interaction between MеtaTrader 4 and MATLAB Engine (Virtual MATLAB Machine)
The article contains considerations regarding creation of a DLL library - wrapper that will enable the interaction of MetaTrader 4 and the MATLAB mathematical desktop package. It describes "pitfalls" and ways to overcome them. The article is intended for prepared C/C++ programmers that use the Borland C++ Builder 6 compiler.
Python + MetaTrader 5: Fast Research Framework for Data, Features, and Prototypes
The article demonstrates how Python and MetaTrader 5 integration combines research flexibility and trade execution into a single workflow. Python is used for data analysis, feature selection and model training, while MetaTrader 5 is used for testing and trading automation. This approach simplifies the transfer of solutions into practice, increases reproducibility, and makes the development of trading systems faster and more structured.
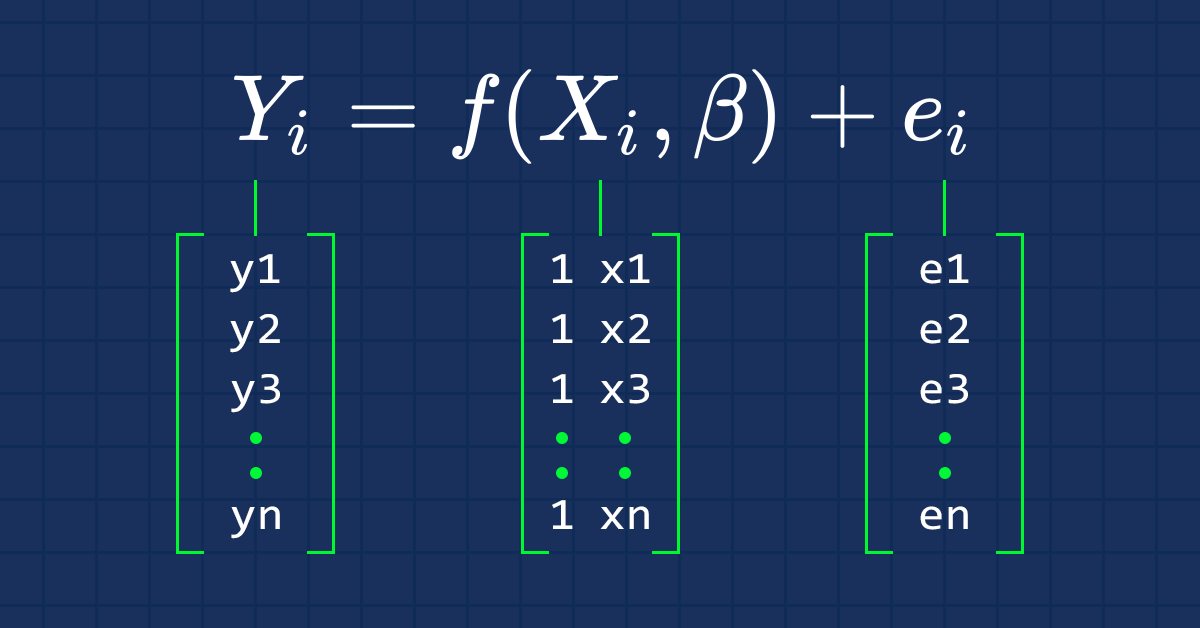
Data Science and Machine Learning (Part 03): Matrix Regressions
This time our models are being made by matrices, which allows flexibility while it allows us to make powerful models that can handle not only five independent variables but also many variables as long as we stay within the calculations limits of a computer, this article is going to be an interesting read, that's for sure.

The Prototype of a Trading Robot
This article summarizes and systematizes the principles of creating algorithms and elements of trading systems. The article considers designing of expert algorithm. As an example the CExpertAdvisor class is considered, which can be used for quick and easy development of trading systems.

How to Integrate Smart Money Concepts (BOS) Coupled with the RSI Indicator into an EA
Smart Money Concept (Break Of Structure) coupled with the RSI Indicator to make informed automated trading decisions based on the market structure.
Library for easy and quick development of MetaTrader programs (part VIII): Order and position modification events
In the previous articles, we started creating a large cross-platform library simplifying the development of programs for MetaTrader 5 and MetaTrader 4 platforms. In the seventh part, we added tracking StopLimit orders activation and prepared the functionality for tracking other events involving orders and positions. In this article, we will develop the class for tracking order and position modification events.

A Pause between Trades
The article deals with the problem of how to arrange pauses between trade operations when a number of experts work on one МТ 4 Client Terminal. It is intended for users who have basic skills in both working with the terminal and programming in MQL 4.
Learn how to design a trading system by Standard Deviation
Here is a new article in our series about how to design a trading system by the most popular technical indicators in MetaTrader 5 trading platform. In this new article, we will learn how to design a trading system by Standard Deviation indicator.
A system of voice notifications for trade events and signals
Nowadays, voice assistants play a prominent role in human life, as we often use navigators, voice search and translators. In this article, I will try to develop a simple and user friendly system of voice notifications for various trade events, market states or signals generated by trading signals.

Trader-friendly stop loss and take profit
Stop loss and take profit can have a significant impact on trading results. In this article, we will look at several ways to find optimal stop order values.

Automating Trading Strategies in MQL5 (Part 1): The Profitunity System (Trading Chaos by Bill Williams)
In this article, we examine the Profitunity System by Bill Williams, breaking down its core components and unique approach to trading within market chaos. We guide readers through implementing the system in MQL5, focusing on automating key indicators and entry/exit signals. Finally, we test and optimize the strategy, providing insights into its performance across various market scenarios.

Pair trading
In this article, we will consider pair trading, namely what its principles are and if there are any prospects for its practical application. We will also try to create a pair trading strategy.

How to deal with lines using MQL5
In this article, you will find your way to deal with the most important lines like trendlines, support, and resistance by MQL5.

Separate optimization of a strategy on trend and flat conditions
The article considers applying the separate optimization method during various market conditions. Separate optimization means defining trading system's optimal parameters by optimizing for an uptrend and downtrend separately. To reduce the effect of false signals and improve profitability, the systems are made flexible, meaning they have some specific set of settings or input data, which is justified because the market behavior is constantly changing.

Using cloud storage services for data exchange between terminals
Cloud technologies are becoming more popular. Nowadays, we can choose between paid and free storage services. Is it possible to use them in trading? This article proposes a technology for exchanging data between terminals using cloud storage services.

Neural networks made easy (Part 3): Convolutional networks
As a continuation of the neural network topic, I propose considering convolutional neural networks. This type of neural network are usually applied to analyzing visual imagery. In this article, we will consider the application of these networks in the financial markets.

MVC design pattern and its possible application
The article discusses a popular MVC pattern, as well as the possibilities, pros and cons of its usage in MQL programs. The idea is to split an existing code into three separate components: Model, View and Controller.
Graphical Interfaces IV: Informational Interface Elements (Chapter 1)
At the current stage of development, the library for creating graphical interfaces contains a form and several controls that can be attached to it. It was mentioned before that one of the future articles would be dedicated to the multi-window mode. Now, we have everything ready for that and we will deal with it in the following chapter. In this chapter, we will write classes for creating the status bar and tooltip informational interface elements.

Tester in the Terminal MetaTrader 4: It Should Be Known
The elaborate interface of the terminal MetaTrader 4 is a forefront, but beside this the terminal includes a deep-laid tester of strategies. And while the worth of MetaTrader 4 as a trading terminal is obvious, the quality of the tester's strategy testing can be assessed only in practice. This article shows the advantages and conveniences of testing in MetaTrader 4.

Here Comes the New MetaTrader 5 and MQL5
This is just a brief review of MetaTrader 5. I can't describe all the system's new features for such a short time period - the testing started on 2009.09.09. This is a symbolical date, and I am sure it will be a lucky number. A few days have passed since I got the beta version of the MetaTrader 5 terminal and MQL5. I haven't managed to try all its features, but I am already impressed.

Event handling in MQL5: Changing MA period on-the-fly
Suppose that simple MA (Moving Average) indicator with period 13 is applied to a chart. And we want to change the period to 20, but we do not want to go to indicator properties dialog box and edit the number 13 to 20: simply tired of these tedious actions with mouse and keyboard. And especially we don't want to open indicator code and modify it. We want to do all this with a single press of a button - "up arrows" next to the numeric keypad. In this article I'll describe how to do it.

Interaction between MetaTrader 4 and Matlab via CSV Files
Step-by-step instructions of how to organize data arrays exchange between MetaTrader 4 and Matlab via CSV files.

Continuous Walk-Forward Optimization (Part 6): Auto optimizer's logical part and structure
We have previously considered the creation of automatic walk-forward optimization. This time, we will proceed to the internal structure of the auto optimizer tool. The article will be useful for all those who wish to further work with the created project and to modify it, as well as for those who wish to understand the program logic. The current article contains UML diagrams which present the internal structure of the project and the relationships between objects. It also describes the process of optimization start, but it does not contain the description of the optimizer implementation process.
Price Action Analysis Toolkit Development (Part 36): Unlocking Direct Python Access to MetaTrader 5 Market Streams
Harness the full potential of your MetaTrader 5 terminal by leveraging Python’s data-science ecosystem and the official MetaTrader 5 client library. This article demonstrates how to authenticate and stream live tick and minute-bar data directly into Parquet storage, apply sophisticated feature engineering with Ta and Prophet, and train a time-aware Gradient Boosting model. We then deploy a lightweight Flask service to serve trade signals in real time. Whether you’re building a hybrid quant framework or enhancing your EA with machine learning, you’ll walk away with a robust, end-to-end pipeline for data-driven algorithmic trading.

DoEasy. Controls (Part 25): Tooltip WinForms object
In this article, I will start developing the Tooltip control, as well as new graphical primitives for the library. Naturally, not every element has a tooltip, but every graphical object has the ability to set it.
Learn how to design a trading system by Williams PR
A new article in our series about learning how to design a trading system by the most popular technical indicators by MQL5 to be used in the MetaTrader 5. In this article, we will learn how to design a trading system by the Williams' %R indicator.

Graphical Interfaces II: the Separation Line and Context Menu Elements (Chapter 2)
In this article we will create the separation line element. It will be possible to use it not only as an independent interface element but also as a part of many other elements. After that, we will have everything required for the development of the context menu class, which will be also considered in this article in detail. Added to that, we will introduce all necessary additions to the class, which is the base for storing pointers to all the elements of the graphical interface of the application.

Information Storage and View
The article deals with convenient and efficient methods of information storage and viewing. Alternatives to the terminal standard log file and the Comment() function are considered here.

Connecting NeuroSolutions Neuronets
In addition to creation of neuronets, the NeuroSolutions software suite allows exporting them as DLLs. This article describes the process of creating a neuronet, generating a DLL and connecting it to an Expert Advisor for trading in MetaTrader 5.

Automating Trading Strategies in MQL5 (Part 10): Developing the Trend Flat Momentum Strategy
In this article, we develop an Expert Advisor in MQL5 for the Trend Flat Momentum Strategy. We combine a two moving averages crossover with RSI and CCI momentum filters to generate trade signals. We also cover backtesting and potential enhancements for real-world performance.