Di Napoli MACD MT5
- Indikatoren
- Version: 1.1
- Aktualisiert: 13 Mai 2023

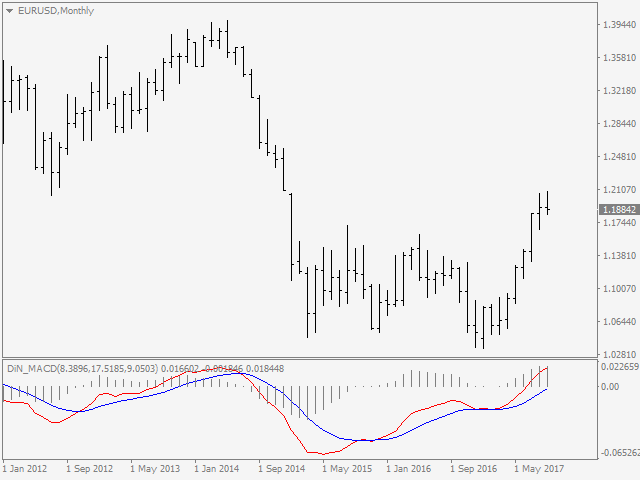
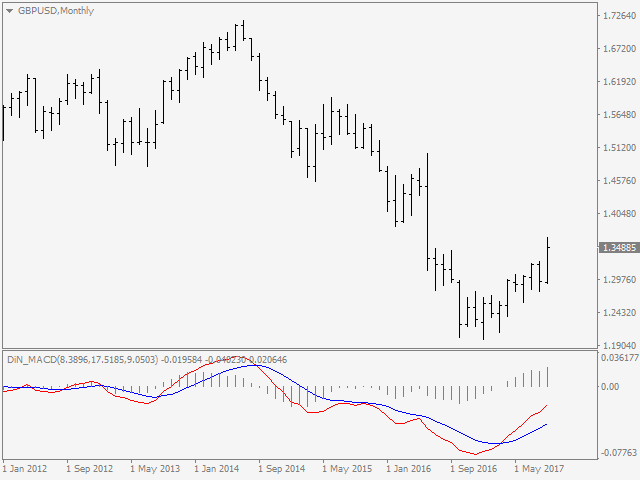
Nicht-proprietäre Studie von Joe Dinapoli, die zur Trendanalyse verwendet wird. Der Indikator gibt Trendsignale, wenn die schnelle Linie die langsame Linie durchdringt. Diese Signale bleiben erhalten, bis eine weitere Durchdringung erfolgt. Das Signal wird am Ende der Periode bestätigt. Er ist für alle Zeitrahmen anwendbar.
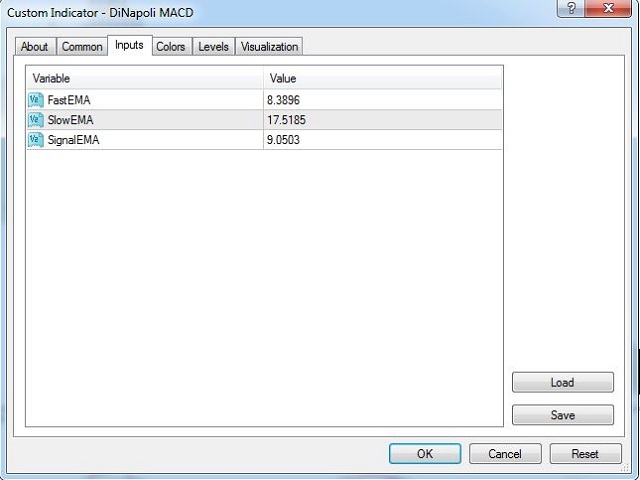
Parameter
- Fast EMA: Periode des schnellen gleitenden Durchschnitts.
- Slow EMA: Periode des langsamen gleitenden Durchschnitts.
- Signal EMA: Periode der Signallinie.
********************************************************************************
Wenn Sie den MACD-Trendwechsel mit dem populärsten MACD-Prognose-Indikator von Dinapoli frühzeitig erkennen wollen;
Bitte besuchen Sie ► https://www.mql5.com/en/market/product/52623
Sie brauchen den Standard-MACD-Indikator nicht mehr zu beobachten ! ! !
*********************************************************************************
Für Dinapoli MACD Dashboard Scanner;
Bitte besuchen Sie ► https://www.mql5.com/en/market/product/52813
*********************************************************************************
Für meine anderen Produkte;
Bitte besuchen Sie ►https://www.mql5.com/en/users/samil34


Legit Dinapoli MACD. Comparable with other popular Dinapoli MACD I've seen on TradingView