PRO Macd Predictor MT5
- Indikatoren
- Version: 1.1
- Aktualisiert: 13 Mai 2023
- Aktivierungen: 15

Sie können anhand des Drucks, der derzeit auf den Märkten lastet, und des Drucks, der in Zukunft auf den Märkten lasten wird, bestimmen, worauf Sie bei einem bestimmten Handel setzen wollen.
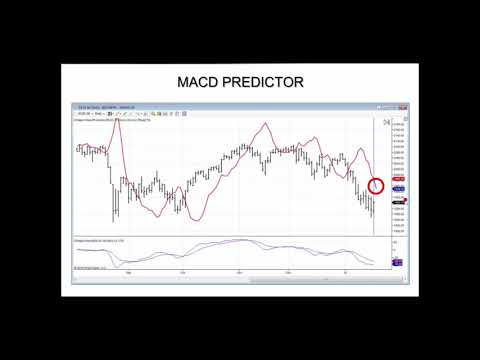
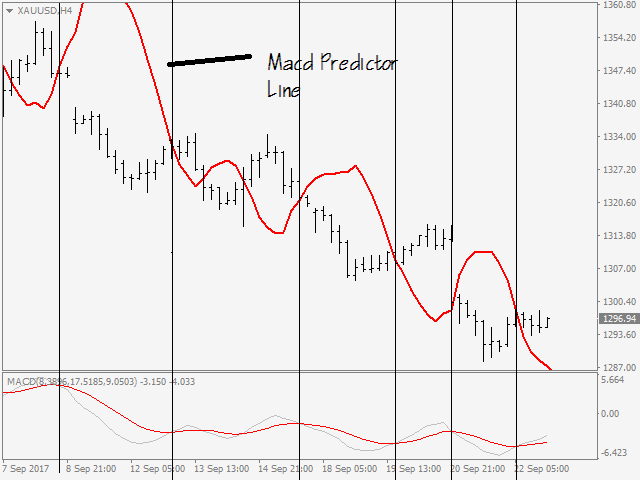
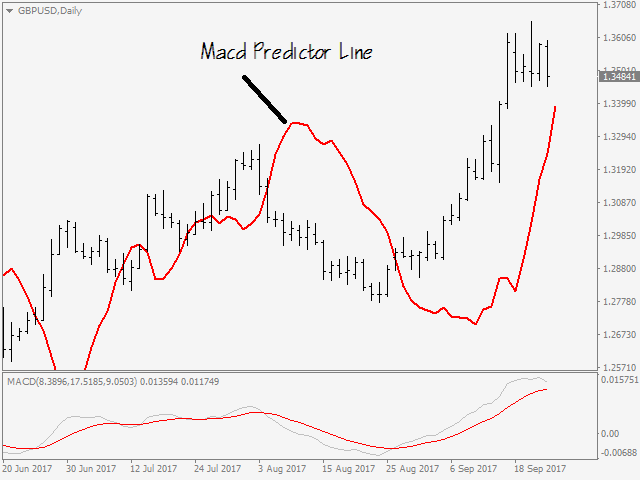
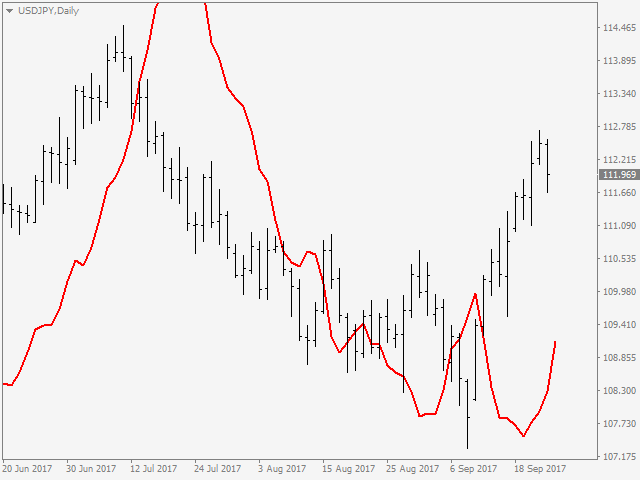
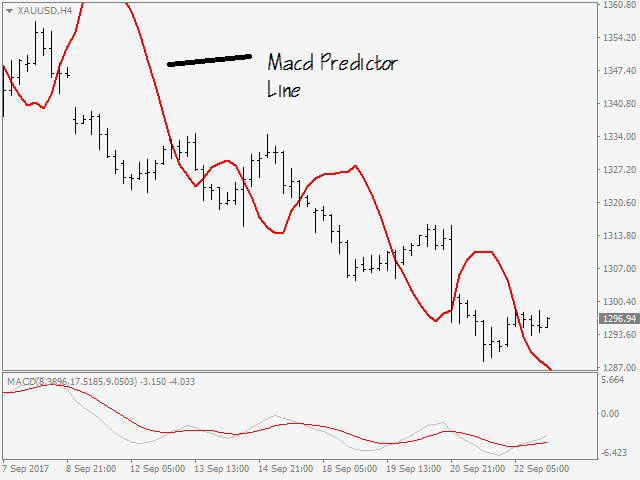
***Wie Sie wissen, verwenden viele Trader den MACD als Trendindikator. Wenn Sie Zugang zu diesem Indikator haben, der das Spiel verändert, haben Sie einen erheblichen Vorteil gegenüber denjenigen, die den Standard-MACD-Indikator verwenden.
Eingaben
- Fast EMA - Periode des schnellen gleitenden Durchschnitts.
- Slow EMA - Periode des langsamen gleitenden Durchschnitts.
- Signal EMA - Periode der Signallinie.
***Bitte zögern Sie nicht, mir irgendwelche Fragen zu diesem Indikator zu stellen... Ich bin hier, um Ihnen zu zeigen, wie Sie diesen Indikator verwenden können, bis Sie völlig zufrieden sind!
Für MT4 Version; bitte besuchen Sie ► https://www.mql5.com/en/market/product/52621
Für meine anderen Produkte; besuchen Sie bitte ►https://www.mql5.com/en/users/samil34

Der Benutzer hat keinen Kommentar hinterlassen