MACD Scanner MT4
- Indikatoren
- Version: 1.1
- Aktivierungen: 20

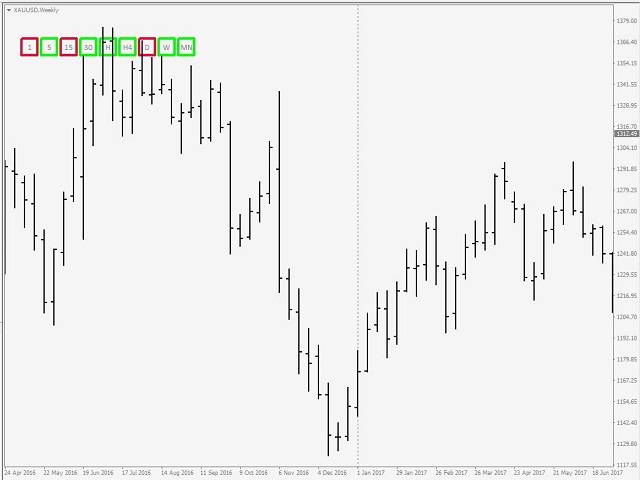
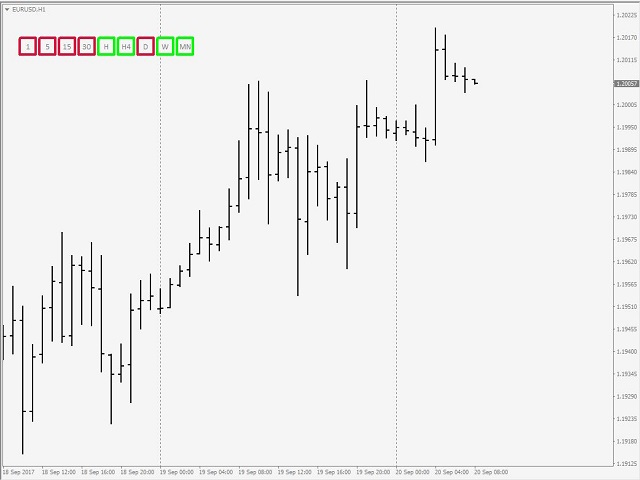
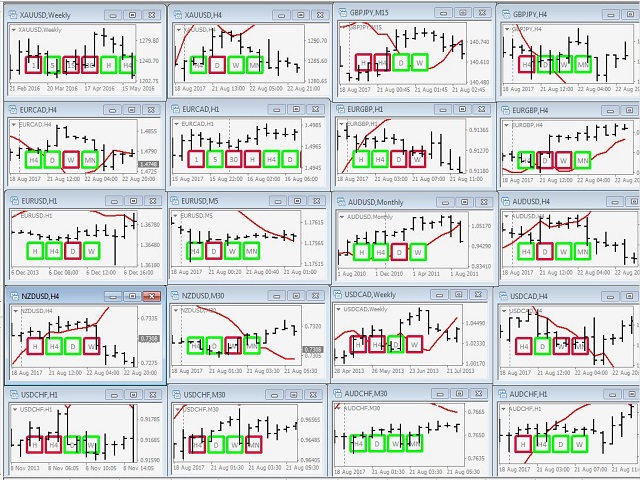
Der Indikator überwacht den MACD-Trend in mehreren Zeitrahmen für einen bestimmten Markt. Sie müssen nicht mehr zwischen den Charts hin- und herwechseln, um die Trendrichtung beim Handel zu überprüfen.
Hauptmerkmale
- Der Indikator kann für alle Märkte verwendet werden
- Überwacht jeden Zeitrahmen, von M1 bis MN
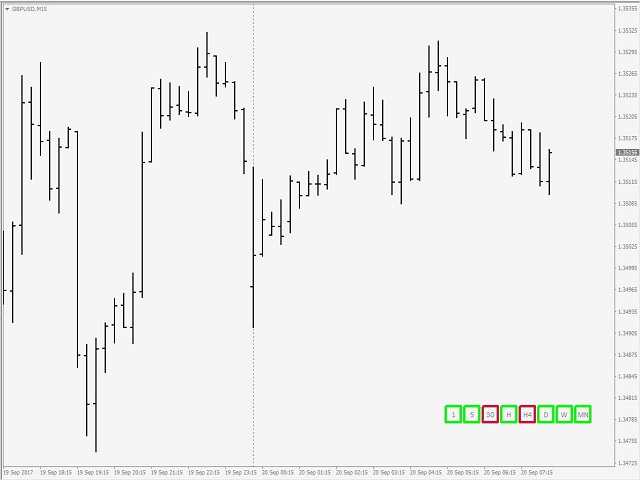
- Verschieben der Anzeigebeschriftung im Chart mit einem einzigen Klick
Verwendung des Indikators
Das Dashboard erscheint im linken und oberen Teil des Charts, wenn es angebracht ist. Die Hülle, die einen Zeitrahmen umschließt, wird bei einem Abwärtstrend rot, bei einem Aufwärtstrend grün. Wenn die Standardposition des Dashboards ungünstig ist, kann es an eine geeignete Stelle im Diagramm verschoben werden. Wählen Sie dazu die erste Shell aus (Doppelklick oder Einfachklick, je nachdem, wie Objekte auf dem Terminal des Benutzers ausgewählt werden) und ziehen Sie sie an die gewünschte Stelle. Lassen Sie sie fallen, und die anderen werden folgen.
Parameter
- FastEMA // Schneller EMA
- SlowEMA // Langsamer EMA
- SignalEMA// Signal EMA
- ZeitraumM1 // 1 Minute
- ZeitraumM5 // 5 Minuten
- ZeitraumM15// 15 Minuten
- ZeitraumM30// 30 Minuten
- ZeitraumH1 // 1 Stunde
- ZeitraumH4 // 4 Stunden
- ZeitraumD1 // Täglich
- ZeitraumW1 // Wöchentlich
- ZeitraumMN // Monatlich
- AlertOn // Warnung bei Trend
- PopAlrt // Popup-Warnung
- MailAlrt // E-Mail-Benachrichtigung
- PushAlrt // Push-Warnung
*********************************************************************************
Für Dinapoli MACD Dashboard Scanner;
Bitte besuchen Sie ► https://www.mql5.com/de/market/product/52812
*********************************************************************************
Wenn Sie den MACD-Trendwechsel mit dem beliebtesten MACD-Prädiktor-Indikator von Dinapoli im Voraus erkennen möchten;
Bitte besuchen Sie ► https://www.mql5.com/en/market/product/52621
Sie brauchen den Standard-MACD-Indikator nicht mehr zu überwachen!!!
*********************************************************************************
Für meine anderen Produkte;
Bitte besuchen Sie ► https://www.mql5.com/en/users/samil34

Der Benutzer hat keinen Kommentar hinterlassen