Di Napoli Thrust Scanner Dashboard MT5
- Indikatoren
- Version: 1.1
- Aktualisiert: 13 Mai 2023
- Aktivierungen: 20

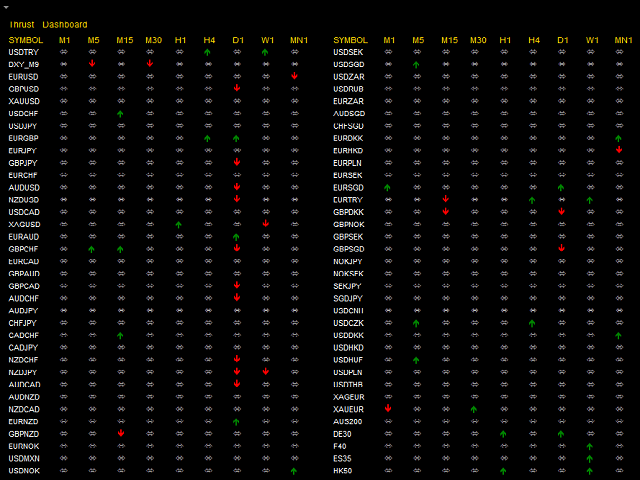
Der Indikator sucht nach Dinapoli-Schubmustern in mehreren Zeitrahmen für alle gefilterten Märkte und zeigt die Ergebnisse auf dem Dashboard an.
Hauptmerkmale
- Das Dashboard kann für alle Märkte verwendet werden
- Der Indikator kann auf MN1, W1, D1, H4, H1, M30, M15, M5 und M1 Zeitrahmen nach Schubmustern suchen
- Möglichkeit, die Anzahl der Bars zu wählen, die über/unter dem verschobenen gleitenden Durchschnitt liegen müssen, um den Thrust zu definieren
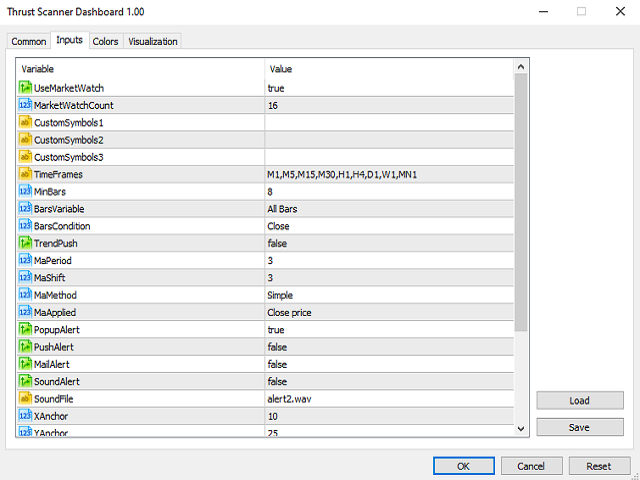
Parameter
- UseMarketWatch: Setzen Sie true, um alle im MarketWatch verfügbaren Symbole zu kopieren
- MarketWatchCount : Legen Sie die Anzahl der Symbole fest, die Sie aus der Marktbeobachtungsliste kopieren möchten.
- BenutzerdefinierteSymbole: Geben Sie die benutzerdefinierten Symbole ein, die im Dashboard verfügbar sein sollen.
- Minimum Bars: Mindestanzahl von Balken, die für den Thrust berücksichtigt werden sollen.
- Bars Variable: Sie können nur aufwärts oder abwärts gerichtete Bars zählen
- Balken Bedingung: Variable, um nur nicht berührende Balken über der DMA-Linie zu zählen
- Trend Push: Variabel, um aufeinanderfolgende Balken mit höheren Tiefs oder niedrigeren Hochs zu zählen.
- DMA-Periode: Periode des gleitenden Durchschnitts
- DMA-Verschiebung: Anzahl der für die Verschiebung des gleitenden Durchschnitts erforderlichen Balken
- DMA-Methode: Methode des gleitenden Durchschnitts
- Warnung bei Thrust: Geben Sie die Richtung des Schubs an, bei dem ein Alarm ausgelöst werden soll. Standard ist Beides
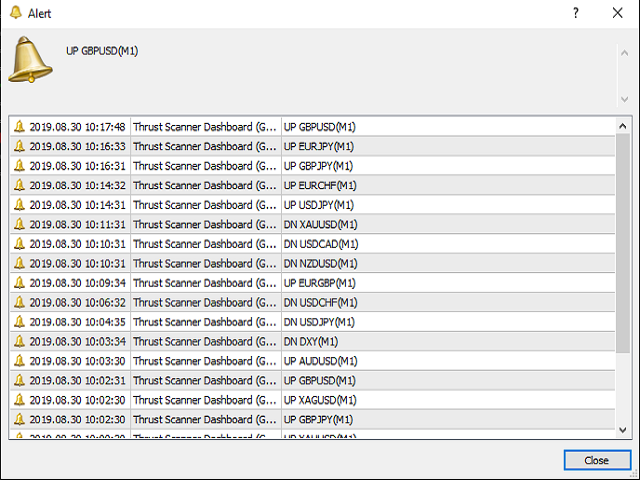
- Popup-Alarm: Setzen Sie True, um ein Popup-Fenster und einen akustischen Alarm auf dem Terminal zu aktivieren, wenn ein neuer Schub erzeugt wird. Setzen Sie False, um sie zu deaktivieren.
- E-Mail-Warnung: Stellen Sie True ein, um E-Mail-Benachrichtigungen zu erhalten, wenn ein neuer Schub erzeugt wird. Zum Deaktivieren setzen Sie False.
- Push-Benachrichtigung: Stellen Sie True ein, um Push-Benachrichtigungen auf Ihren Apple- oder Android-Geräten zu erhalten, wenn ein neuer Schub generiert wird. Zum Deaktivieren setzen Sie False.
- MaxRow: Begrenzen Sie die Anzahl der Zeilen im Dashboard.
Für die MT4 Version, besuchen Sie bitte => https://www.mql5.com/en/market/product/52832
Der Benutzer hat keinen Kommentar hinterlassen