Di Napoli Thrust Scanner MT5
- Indikatoren
- Version: 1.1
- Aktualisiert: 13 Mai 2023
- Aktivierungen: 15

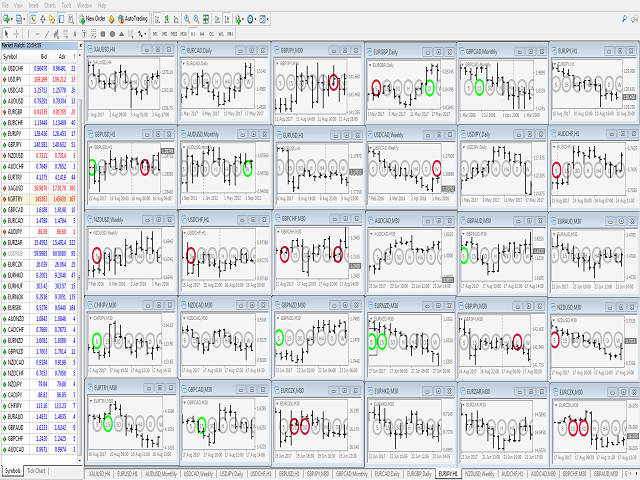
Der Indikator sucht nach Dinapoli-Schubmustern in mehreren Zeitrahmen für einen bestimmten Markt.
Hauptmerkmale
- Der Indikator kann für alle Märkte verwendet werden
- Er kann in den Zeitrahmen W1, D1, H4, H1, M30, M15 und M5 nach Schubmustern suchen
- Möglichkeit, die Anzahl der erforderlichen Balken über/unter dem verschobenen gleitenden Durchschnitt zu wählen, um den Thrust zu definieren
- Verschieben des Anzeige-Labels im Chart durch einfachen Klick
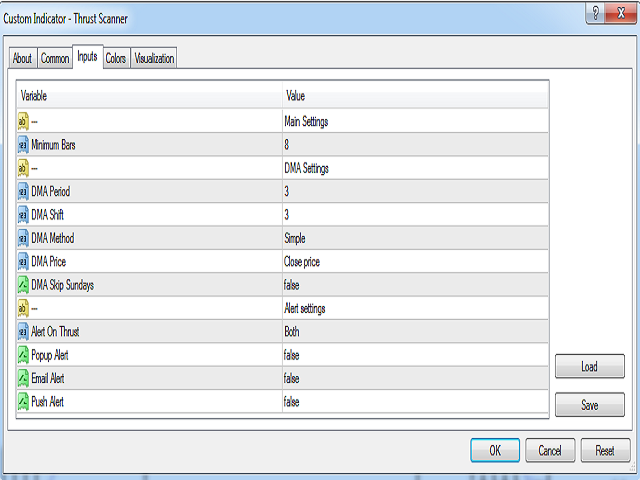
Parameter
- Minimum Balken: Geringste Anzahl von Bars zur Berücksichtigung des Thrusts
- DMA-Periode: Periode des gleitenden Durchschnitts
- DMA-Verschiebung: Anzahl der für die Verschiebung des gleitenden Durchschnitts erforderlichen Balken
- DMA-Methode: Methode des gleitenden Durchschnitts
- Bars Variable: Möglichkeit, nur aufwärts oder abwärts gerichtete Bars zu zählen
- Balken Bedingung: Variabel, um nur nicht berührende Balken über der DMA-Linie zu zählen
- Trend Push: Variabel, um aufeinanderfolgende Balken mit höheren Tiefs oder niedrigeren Hochs zu zählen.
- Alarm bei Thrust: Legen Sie die Richtung des Schubes fest, bei dem ein Alarm ausgelöst werden soll. Standard ist Beides.
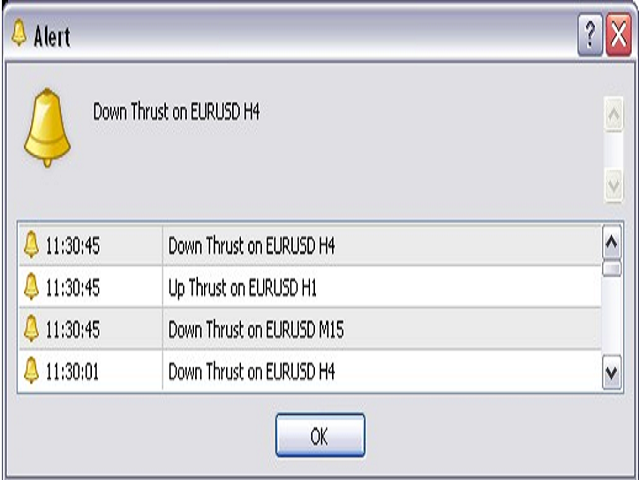
- Popup-Alarm: Stellen Sie True ein, um ein Popup-Fenster und einen akustischen Alarm auf dem Terminal zu aktivieren, wenn ein neuer Thrust erzeugt wird. Setzen Sie False, um sie zu deaktivieren.
- E-Mail-Warnung: Stellen Sie True ein, um E-Mail-Benachrichtigungen zu erhalten, wenn ein neuer Schub erzeugt wird. Zum Deaktivieren setzen Sie False.
- Push-Benachrichtigung: Stellen Sie True ein, um Push-Benachrichtigungen auf Ihren Apple- oder Android-Geräten zu erhalten, wenn ein neuer Schub generiert wird. Zum Deaktivieren stellen Sie False ein.
Verwendung der Indikatoren
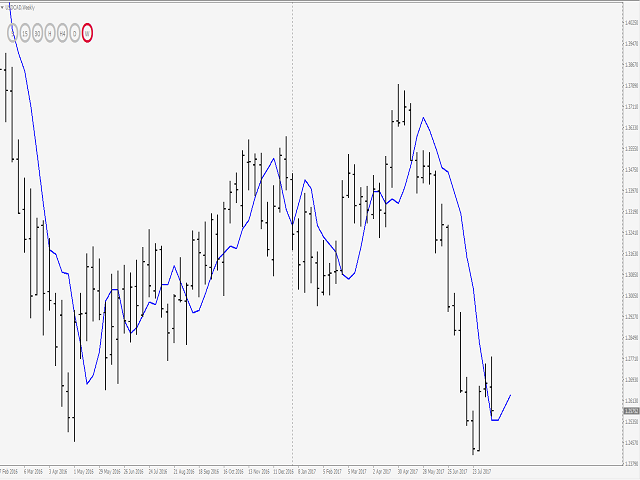
Das Dashboard wird im linken und oberen Teil des Charts angezeigt, wenn es angehängt ist. Die Hülle, die einen Zeitrahmen umschließt, wird bei einem Abwärtsschub rot, bei einem Aufwärtsschub grün und wird auf grau zurückgesetzt, wenn es kein Signal gibt.
Wenn die Standardposition des Dashboards ungünstig ist, kann es an eine geeignete Stelle im Diagramm verschoben werden. Wählen Sie dazu die erste Hülle, die das Dashboard umschließt, aus (Doppelklick oder Einfachklick, je nachdem, wie Objekte auf dem Terminal des Benutzers ausgewählt werden) und ziehen Sie sie an die gewünschte Stelle. Lassen Sie sie fallen, und die anderen werden ihr folgen.
Thrust Scanner speichert Ihre bevorzugte Position, wenn Sie den Indikator aus dem Chart entfernen. Wenn Sie den Thrust-Scanner-Indikator das nächste Mal in den Chart einfügen, wird das Dashboard an der gespeicherten bevorzugten Position angezeigt. Bitte entspannen Sie sich und genießen Sie Ihren Indikator!
Für die MT4 Version; besuchen Sie bitte => https://www.mql5.com/en/market/product/52830/
Für das Thrust Scanner Dashboard; besuchen Sie bitte => https://www.mql5.com/en/market/product/52833


Der Benutzer hat keinen Kommentar hinterlassen