Di Napoli Preferred Stochastic MT4
- Indikatoren
- Version: 1.0

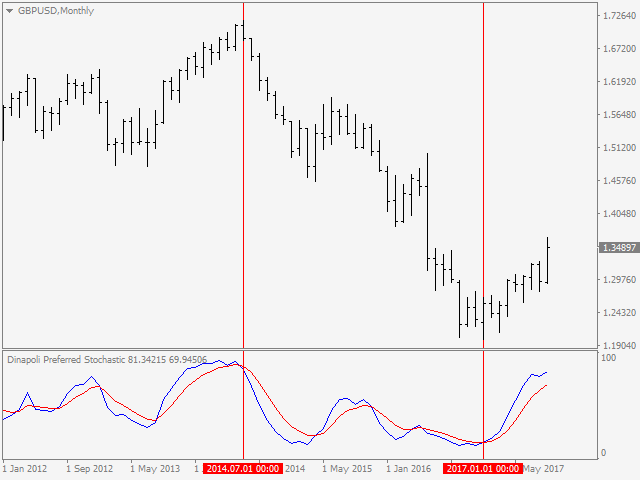
Nicht-proprietäre Studie von Joe Dinapoli, die zur Trendanalyse verwendet wird. Der Indikator gibt Trendsignale, wenn die schnelle Linie die langsame Linie durchdringt. Diese Signale bleiben erhalten, bis eine weitere Durchdringung erfolgt. Das Signal wird am Ende der Periode bestätigt. Er ist für alle Zeitrahmen anwendbar.
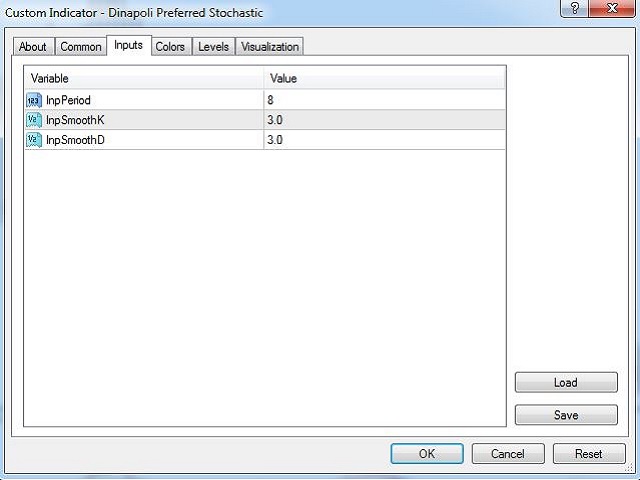
Eingaben
- lnpPeriode: Periode des gleitenden Durchschnitts.
- lnpSmoothK: %K-Periode.
- lnpGlattD: %D-Periode.
*********************************************************************************
Wenn Sie einen fortgeschrittenen Trendindikator suchen, können Sie auch den populärsten MACD-Prädiktor-Indikator von Dinapoli testen.
Bitte besuchen Sie ► https://www.mql5.com/en/market/product/52621
*********************************************************************************
Für meine anderen Produkte;
Bitte besuchen Sie ► https://www.mql5.com/en/users/samil34

Der Benutzer hat keinen Kommentar hinterlassen