Pivot Pro MT4
- Indikatoren
- Version: 1.0

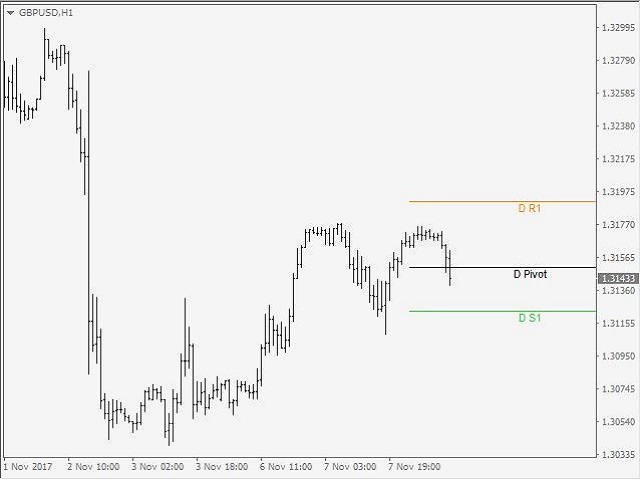
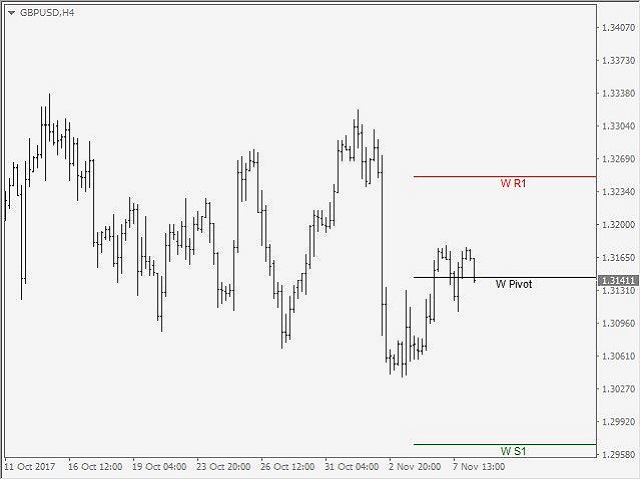
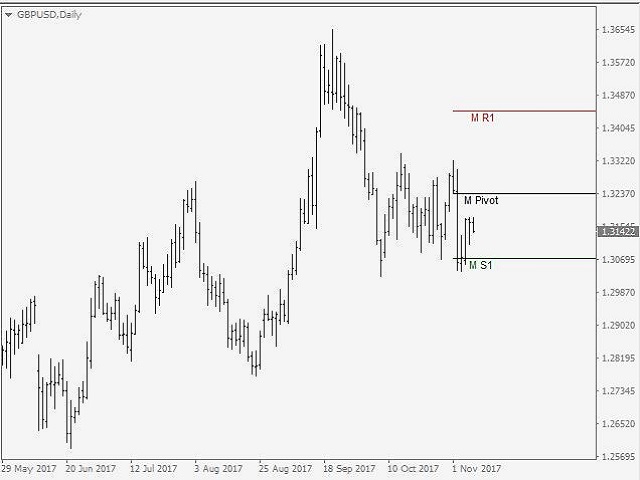
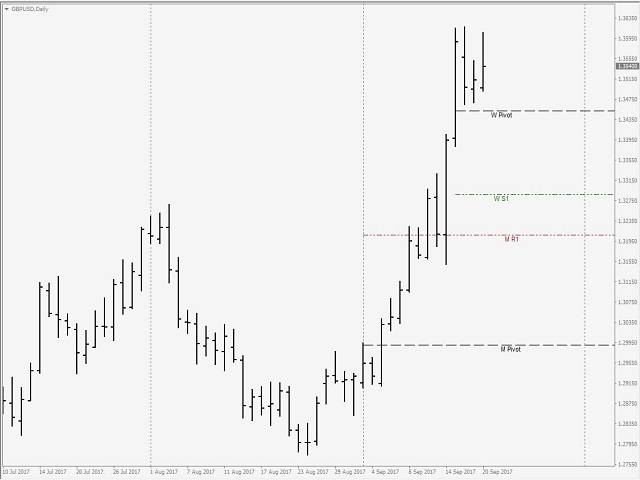
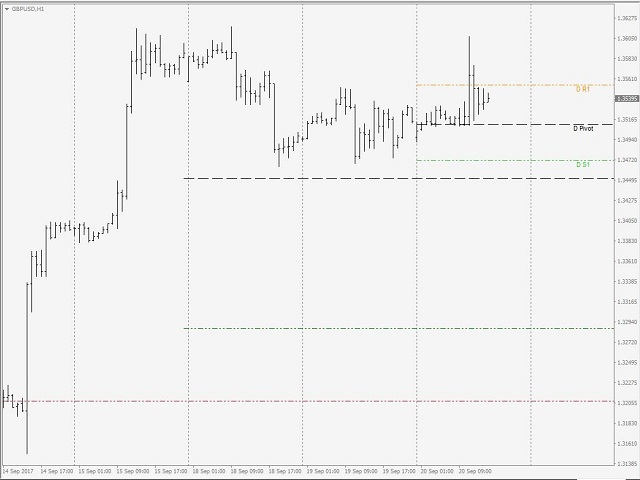
Zeichnet tägliche, wöchentliche und monatliche Pivots und die entsprechenden Unterstützungs- und Widerstandsniveaus (S1, S2, S3, R1, R2, R3). Ideal für die Platzierung von Stop-Losses und/oder die Verwendung als Break-Out-Strategie.
Merkmale
- Im Gegensatz zu anderen Pivot-Indikatoren auf dem Markt erhalten Sie sehr saubere Charts.
- Die Pivot-Levels werden unabhängig vom Zeitrahmen, auf dem Sie handeln, dargestellt, d.h. M1, M5, M15, M30, H1, H4 oder Daily-Zeitrahmen. Die Pivot-Levels ändern sich nicht, wenn Sie den Zeitrahmen wechseln.
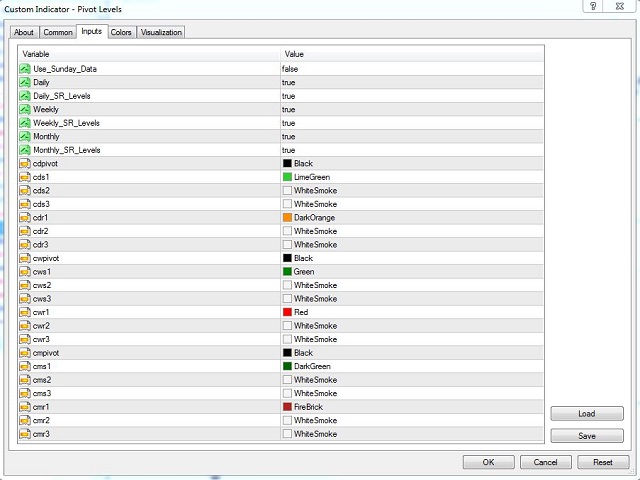
- Vollständig anpassbare Optionen.
Wenn Sie auch an Fibonacci-Levels interessiert sind, schauen Sie sich bitte mein erstaunliches Tool an, das auf dem Markt einzigartig ist ► https://www.mql5.com/en/market/product/52834
Für meine anderen Produkte; besuchen Sie bitte ► https://www.mql5.com/en/users/samil34


Excellent indicator!!! I use it on all of my charts.