Oscillator Predictor MT5
- Indikatoren
- Version: 1.1
- Aktualisiert: 13 Mai 2023
- Aktivierungen: 15

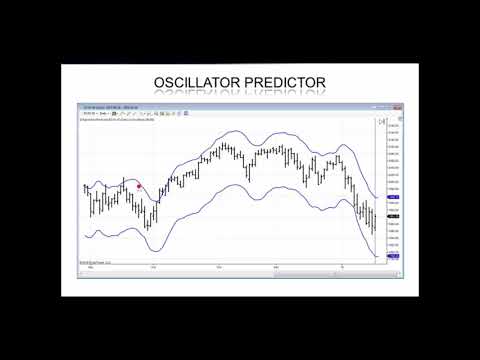
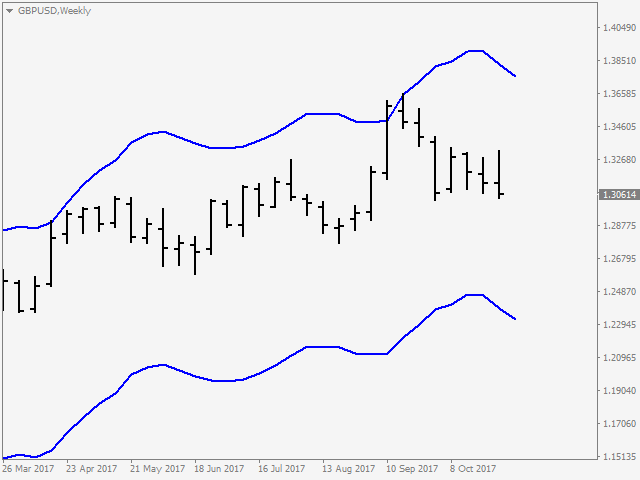
Sehr spezieller Indikator von Joe Dinapoli, der eine Ableitung des Detrended Oscillators ist. Mithilfe einer Reihe von Parametergleichungen wird ein prognostizierender Oszillator erstellt, der eine Periode im Voraus überkaufte und überverkaufte Bedingungen vorhersagt.
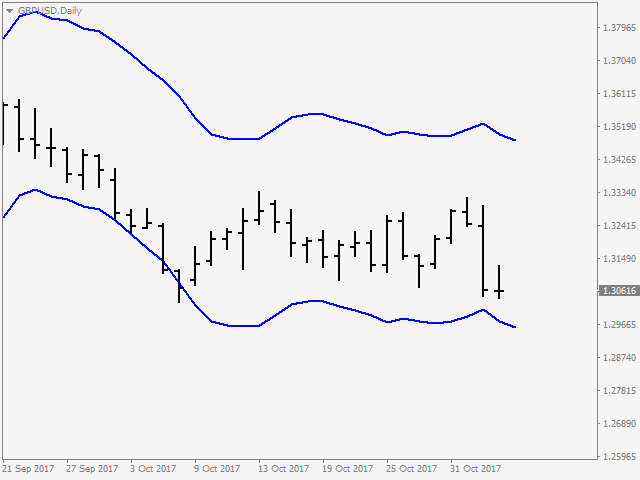
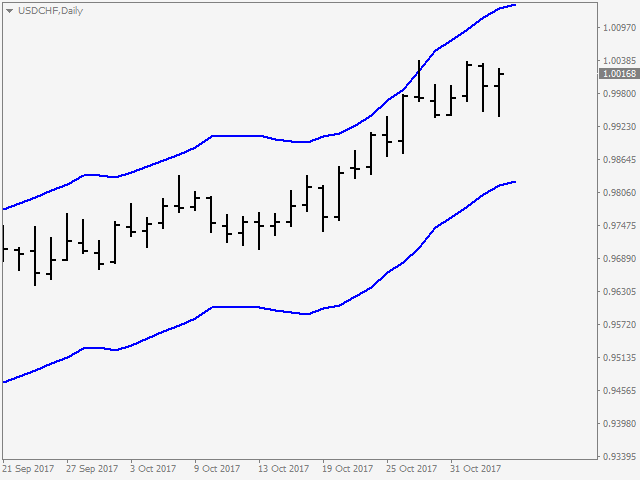
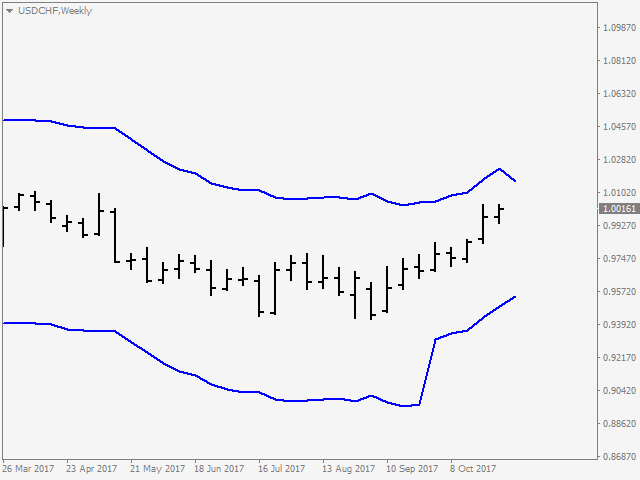
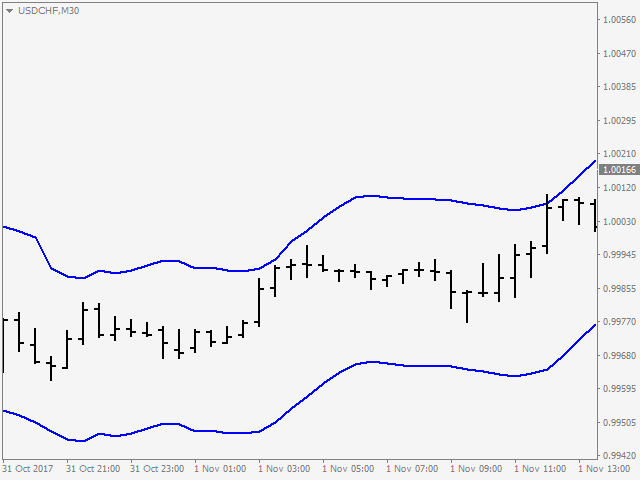
Die sich daraus ergebenden Vorhersagewerte werden als Bänder auf dem Balkendiagramm ausgedrückt, sowohl oberhalb als auch unterhalb des Marktes. Er kann mit einem Bollinger Band verwechselt werden, hat aber keinerlei Ähnlichkeit mit diesem.
Die Predictor-Bänder können auf verschiedene Weise verwendet werden, um den Ein- und Ausstieg in den Markt zu erleichtern.
Obwohl es für H4 und höhere Zeitrahmen empfohlen wird, kann es für den Intraday-Handel besonders nützlich sein.
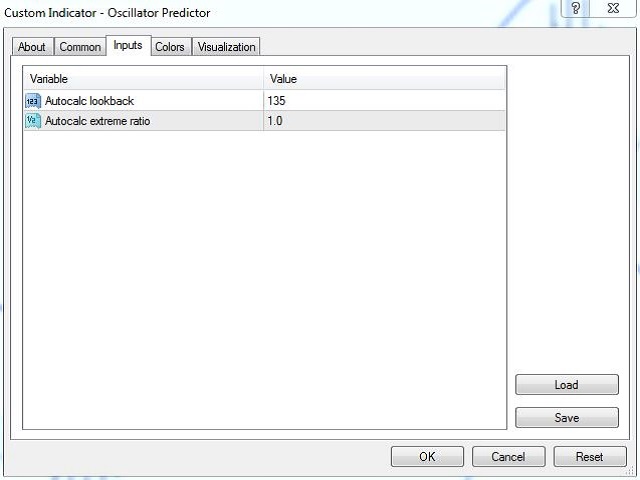
Eingaben
- Autocalc Lookback - Anzahl der Bars, die zur Berechnung der überkauften und überverkauften Bedingungen verwendet werden.
- Autocalc extreme ratio - prozentuales Verhältnis, das verwendet wird, um die maximale überkaufte und überverkaufte Bedingung festzulegen.
***Bitte zögern Sie nicht, mir irgendwelche Fragen zu diesem Indikator zu stellen... Ich werde hier sein, um Ihnen zu zeigen, wie Sie diesen Indikator verwenden, bis Sie völlig zufrieden sind!
Für MT4 Version; bitte besuchen Sie ► https://www.mql5.com/en/market/product/52625
Für meine anderen Produkte; besuchen Sie bitte ► https://www.mql5.com/en/users/samil34
Der Benutzer hat keinen Kommentar hinterlassen